
 ?Mathematical formulae have been encoded as MathML and are displayed in this HTML version using MathJax in order to improve their display. Uncheck the box to turn MathJax off. This feature requires Javascript. Click on a formula to zoom.
ABSTRACT
Introduction: Prolonged Hospital Length of Stay (PLOS) is an indicator of deteriorated efficiency in Quality of Care. One goal of public health management is to reduce PLOS by identifying its most relevant predictors. The objective of this study is to explore Machine Learning (ML) models that best predict PLOS.Methods: Our dataset was collected from the French Medico-Administrative database (PMSI) as a retrospective cohort study of all discharges in the year 2015 from a large university hospital in France (APHM). The study outcomes were LOS transformed into a binary variable (long vs. short LOS) according to the 90th percentile (14 days). Logistic regression (LR), classification and regression trees (CART), random forest (RF), gradient boosting (GB) and neural networks (NN) were applied to the collected data. The predictive performance of the models was evaluated using the area under the ROC curve (AUC).Results: Our analysis included 73,182 hospitalizations, of which 7,341 (10.0%) led to PLOS. The GB classifier was the most performant model with the highest AUC (0.810), superior to all the other models (all p-values <0.0001). The performance of the RF, GB and NN models (AUC ranged from 0.808 to 0.810) was superior to that of the LR model (AUC = 0.795); all p-values <0.0001. In contrast, LR was superior to CART (AUC = 0.786), p < 0.0001. The variable most predictive of the PLOS was the destination of the patient after hospitalization to other institutions. The typical clinical profile of these patients (17.5% of the sample) was the elderly patient, admitted in emergency, for a trauma, a neurological or a cardiovascular pathology, more often institutionalized, with more comorbidities notably mental health problems, dementia and hemiplegia.Discussion: The integration of ML, particularly the GB algorithm, may be useful for health-care professionals and bed managers to better identify patients at risk of PLOS. These findings underscore the need to strengthen hospitals through targeted allocation to meet the needs of an aging population.
Introduction
In 2019, healthcare expenditure (consumption of care and medical goods, CSBM) amounted to €208 billion in France, of which €97 billion was for hospital care (46.7%) [Citation1]. In addition to being the largest contributor to health-care spending, hospital expenditure accelerated in 2019 (+2.4%) to the point of increasing faster than the CSBM [Citation1]. In France, as in other Western countries, strategies to control health expenditure are similar and are notably based on the reduction in length of stay (LOS) [Citation2]. Numerous studies show that some of the beds occupied in hospitals in France are inadequately occupied, with approximately 10% of medical and surgical beds being inadequately occupied on a given day (5% in surgery, 17.5% in medicine) [Citation3]. LOS, defined as the interval time between admission and discharge (i.e., total bed-days occupied by a patient), is thus considered as an important indicator to evaluate quality of care and hospital performance. Prolonged LOS (PLOS) is associated with more consumption of hospital resources and costs, more complications (e.g., hospital-acquired infection, falls), increased mortality and deteriorated patient experience [Citation4,Citation5]. In addition, PLOS may impact negatively on admission of critically ill patients and denies timely access to treatment [Citation6]. For all these reasons, we need to better identify patients at high risk of PLOS to improve the quality of care and reduce associated health-care costs.
Over the last years, machine learning (ML) methods have gained momentum in health service research as an alternative to traditional statistical approaches such as logistic regression [Citation7–10]. ML methods do not require most of the assumptions used in traditional models and are able to account for interactions without having to explicitly model them [Citation11]. More and more ML models have now started to explore LOS. A recent study used a ML approach from a dozen different models to predict LOS in patients hospitalized for COVID-19 (N = 966 patients) [Citation12]. Another recent study explored two ML methods, the Random Forest (RF) and the Gradient Boosting model (GB), using an open-source available dataset [Citation13]. Last, Bacchi et al. applied neural network model to 313 patients admitted in general medical stay [Citation14]. Altogether, these findings suggest that ML approach may help hospital systems prepare for bed capacity needs. These studies, however, have been limited to either relatively small or very specific datasets, or only to a few models.
Thus, the objective of this work was to predict LOS using ML methods on a large population-based study from a French hospital medico-administrative database, based on the area under the receiving operating characteristic curve. For this purpose, we selected the following ML methods [Citation15]: random forest (RF), neural networks (NN), gradient boosting (GB), decision trees (CART), Logistic Regression (LR).
Methods
Study design
The design is based on a retrospective cohort study of all acute-care inpatient hospitalization cases discharged from January 1 to 31 December 2015, from the largest university health center in the South of France (Assistance Publique – Hôpitaux de Marseille, APHM). It used a dataset collected from the French Hospital database for all hospitalizations (PMSI – Programme de Médicalisation des Systèmes d’Information) [Citation16]. Research on retrospective data such as ours do not require compliance to the French Law Number 2012–300 of 5 March 2012 relating to the research involving human participants, as modified by the Order Number 2016–800 of 16 June 2016. In this context, it does not require approval from the French competent authority (Agence Nationale de Sécurité du Médicament et des Produits de Santé, ANSM) nor from the French ethics committee (Comités de Protection des Personnes, CPP).
Study setting and inclusion criteria
The APHM with its four hospitals (La Timone, La Conception, Sainte-Marguerite, and Hôpital Nord) is a public tertiary-care center with 3,400 beds and 2,000 physicians. It processes approximately 300,000 hospitalizations and 210,000 patients every year. The inclusion criteria were all acute-care hospitalizations for patients older than 18 years old and with a length of stay (LOS) > 24 hours (to exclude ambulatory care such as ambulatory surgery, radiotherapy, dialysis, chemotherapy, and transfusions that we did not want to predict). Were also excluded in-hospital mortalities and obstetrical stays.
Study outcomes
The study outcome was LOS transformed into a binary variable (short or ordinary LOS vs long or prolonged LOS – PLOS). There is no consensus on the choice of the cut point for PLOS and different cut points have been used in different studies [Citation17]. Some use ad-hoc values such as 3 days [Citation18], 7 days [Citation18,Citation19], or more frequently 14 days [Citation20–22], up to 21 days [Citation23,Citation24]. Others use statistical criteria such as 75th, 90th or 95th percentile [Citation3,Citation5,Citation25]. Tukey’s criterion [Citation26,Citation27] is also statistical in nature. It defines a cut point beyond which observations are considered outliers. It is computed as which in our case coincides with the 90th percentile (14 days).
Collected data
The dataset collected from the PMSI used 27 predictor variables:
- sociodemographic features: age, gender, state-funded medical assistance (the French AME i.e., health coverage for unregistered migrants), and free universal health care (the French CMU i.e., universal health coverage for those not covered by private or professional insurance);
- clinical features: category of disease based on the 10th revision of the International Statistical Classification of Diseases and 17 comorbidities from the Charlson comorbidity index [Citation28];
- hospitalization features: patient origin (home or other hospital institution), hospitalization via emergency departments, destination after hospital discharge (home or transfer to other hospital institution), and hospitalization via emergency departments in the previous 6 months.
Statistical models
Five distinct types of ML models were trained with the data: LR, CART, RF, GB, and three-hidden layers NN. Although detailed explanations are given elsewhere [Citation29], a brief summary is presented here.
LR is a general linear model of the exponential family such that , where
,
is a binary outcome,
the predictors and
is the weight vector to be estimated from the data by minimizing a given loss function.
CART [Citation30] ‘is a binary decision tree (DT) method that involves segmenting the predictor space into a number of simple regions. CART can be applied to both regression and classification problems, as in our study. A DT is constructed through an iterative process by applying a binary splitting rule. For each explanatory variable in the data, a rule of the form
(a ∈ R is a threshold) is used to split the initial set of observations (denoted, the root of the tree) into two subsets
and
(the sibling nodes). Each observation falling in those regions is then predicted by the highest frequency class. The best split is defined as the one minimizing a loss function (e.g., the Gini index, or the Entropy). Once the best split has been defined, the same process is applied to the two nodes
and
and repeated until a predefined minimum number of observations is reached. Then, a pruning algorithm can be used to search for an optimal subtree, given a penalty criterion (complexity parameter) applied to the objective function. A DT can be represented graphically and thus can be directly interpretable, given its simple structure’ Citation31.
RF [Citation32] ‘is an ensemble learning method based on aggregating n_estimators trees similar to the ones constructed with CART, each one grown using a bootstrap sample of the original data set. Each tree in the forest uses only a random subset of max_features predictors to determine the best split at each node. The trees are not pruned. The prediction by RF is the majority vote over the predictions made by the n_estimators trees. Other hyperparameters such as the minimum number of samples required to split an internal node (min_samples_split) or the maximum depth of a tree (max_depth) may be used to tune further the RF model.’ Citation31.
GB [Citation33] ‘is also an ensemble learning method based on DT but does not involve bootstrap sampling. It is built sequentially using a weak learner (e.g., shallow classification trees). The GB is initialized with the best guess of the response (e.g., the majority vote); then, the gradient is calculated, and a model is then fit to the residuals to minimize the loss function. The current model thus obtained is added to the previous model, adjusted by a learning_rate parameter. The user may specify the number of trees (n_estimators), a tree depth equal to max_depth and a given minimum number of observations in the trees terminal nodes, min_samples_leaf.’ [Citation31, p. 3].
NN [Citation34] ‘are nonlinear statistical models for regression or classification. They are structured in layers of “neurons” where the input layer is made of the predictor variables, followed by intermediate layers called hidden layers, and the output layer. Each neuron is a linear combination of the neurons of the previous layer, to which is applied a non-linear activation function, typically the relu function. Usually, the activation function used in the output layer is the softmax for multiclass classification and the sigmoid for binary classification. Thus, the output layer contains as many neurons as there are classes, but only one for binary classification. The weights of the linear combinations are the parameters of the model, and they are estimated through an optimization algorithm called (stochastic) gradient descent. The loss function optimized in binary classification is the cross-entropy to which a decay penalty may be applied’ [Citation31, p. 3].
Statistical analyses
Descriptive analyses for the sociodemographic, clinical, and hospitalization data were expressed as frequencies and percentages. For each predictor (sociodemographic, clinical, and hospitalization data), the two categories of LOS (long vs. short) were compared by estimating their difference in proportions through a statistical test of proportions. The effect size of this difference is then estimated with Cohen’s d standardized difference (SD). SD use effect size methods to identify meaningful differences between groups that, unlike p-values, are not influenced by sample size. Values greater than 0.20 are clinically significant [Citation35].
In the following, model performance is estimated through the area under the receiver operating characteristic curve (ROC, AUC). Indeed, given that our outcome class proportions are quite imbalanced (90% short vs 10% PLOS), threshold-dependent measures of performance such as the accuracy or the F1 are less reliable [Citation36–38].
To train and evaluate the different models (i.e., LR, CART, RF, NN, and GB), the dataset was split into 80% full training sample and 20% hold out test sample, stratified on the outcome variable. The first step was to tune each of the different model (i.e., CART, RF, NN, and GB – LR, as the reference model has no hyperparameter to be tuned). The 80% full training sample is again split into 80% training set and 20% validation set. We performed a 10-fold cross validation to tune the hyperparameters with the training set, then assessed model performance with the validation set for that specific resampling split, and the optimal hyperparameters for that resampling split are saved. This process is repeated 10 times over 10 different resampling splits. The hyperparameters corresponding to the highest performance over these 10 resampling splits are now used to compare each of the 5 models 100 times over 100 different resampling splits. The performance of each model is saved for each split and the mean performances of the different models over 100 splits are compared using paired t-test (post hoc tests with Bonferroni correction). Given the large sample size, the p-value of the test statistic is completed with the Cohen’s size effect, to appreciate the amplitude of the difference in performance. In addition, we computed the performance of each model (classifier) on the hold out test sample in which the model has never ‘seen’ – this is not only a supplementary indication on the classifier’s performance but also provides the means to check for overfitting.
Lastly, we computed variable importance (VI), averaged over the 100 resampling splits. VI provides a simple way to inspect each model and gain insights on which variables are most influential in predicting the outcome, and to what extent. Here, permutation feature importance is used to estimate variable importance. Permutation feature importance is defined as the decrease in a model score when a single feature value is randomly shuffled [Citation32,Citation39]. The larger the decrease in score, the more important the variable.
All analyses were implemented in Python 3.7 [Citation40] with Sci Kit Learn 0.24.1 [Citation41] and Keras 2.4.0 [Citation42]
Results
Characteristics of the population
The initial dataset of the 2015 cohorts contains 118,650 admissions. After exclusion of non-adult stays with death and hospitalizations for ambulatory and obstetrical care, 73,182 hospitalizations were retained. The most common diseases were digestive disease and nervous system conditions. In total, 7341 (10.03%) hospitalizations resulted in PLOS. The characteristics of the sample are presented in .
Table 1. Sample characteristics (significant effect size are highlighted in yellow).
Factors associated with LOS
Based on the Cohen’s d standardized difference in proportions, the destination of discharge to other institutions shows a significant and sizeable higher proportion of PLOS than to home (d = 0.727 p-value <0.0001). Next comes those who are admitted for Chemotherapy and Radiotherapy who display a sizeable and significant lower level of PLOS (d = −0.390, p-value <0.0001), followed by the origin of patient where other institutions are associated to higher proportion of PLOS (d = 0.294, p-value <0.0001). displays all the significant difference in proportion of LOS for which the size effect is at least equal to 0.2 (small effect).
Predictive model performance
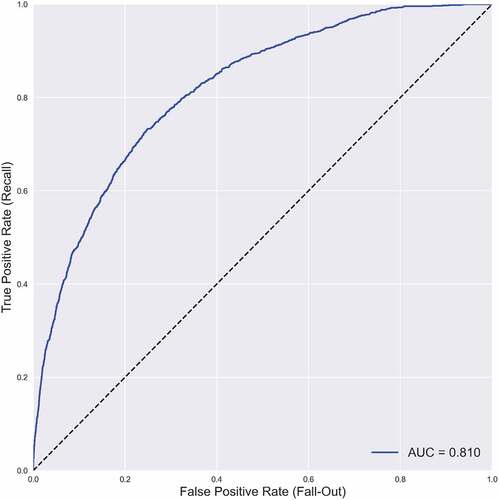
The predictive performance of each model is presented in , and the comparison of each model’s AUC is presented in . The GB classifier was the most performant model with the highest AUC (0.810), superior to all the other models (all p-values <0.0001). The performance of the RF, GB and NN models (AUC ranged from 0.808 to 0.810) was superior to that of the LR model (AUC = 0.795); all p-values <0.0001. In contrast, LR was superior to CART (AUC = 0.786), p < 0.0001. As the values are close, the size effects are also provided by the Cohen’s d, which confirms small effects between GB and RF or NN but large effects between all others. Thus, the seemingly small difference in value between the AUC of LR and the other classifiers, when accounting for their standard errors are in fact very large ones. However, the performance of NN and RF are identical. The ROC curve for the best model (i.e., GB) is presented in .
Table 2. Performance of the tuned classifiers over 100 (re)sampling experiments.
Table 3. AUC paired T-tests of classifiers’ performance over 100 experiments (Bonferonni corrected, with effect size).
Figure 1. Best model: gradient boosting mean ROC curve.
Variable importance
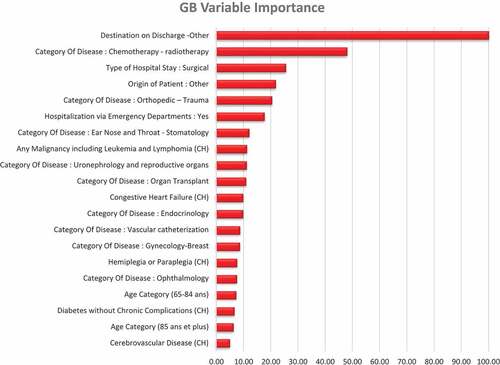
The variable importance of the best model (i.e., GB) is presented in . In the GB classifier as well as in all the others, the variable most predictive of the categorical LOS was the destination of the patient after hospitalization. Destination to other institutions but not home was associated to PLOS. The typical clinical profile of these patients (17.5% of the sample) was the elderly patient, admitted in emergency, for a trauma, a neurological or a cardiovascular pathology, more often institutionalized, with more comorbidities, notably dementia and hemiplegia (supplementary file #1). This is coherent with the bivariate analysis. Two of the other most important variables were also identified in the bivariate analysis: the origin of the patient from other institutions was predictive of PLOS, whereas the admission for chemotherapy or radiotherapy was associated with short LOS. The model also included admission for orthopedic trauma and surgical type of hospital stay to be predictive of PLOS.
Figure 2. Gradient boosting variable importance (20 highest).
The variable importance of the other models is presented in supplementary file #2.
Discussion
One of the strategies to address the sustainability of health-care systems is to reduce the length of inpatient hospital stay. Reducing LOS is expected to release bed capacity as well as staff time and to reduce costs associated with inappropriate patient days in hospital. In addition, PLOS is associated with more medical complications and longer discharge delays. Therefore, improving LOS prediction with the best artificial intelligence method remains a key challenge, especially to enable better bed planning, care delivery and cost optimization. Linear and logistic regression methods have been supplanted by ML and deep learning (DL) models, yet it remains challenging to identify, benchmark and select optimal prediction methods given the discrepancy in data sources, inclusion criteria, choice of input variables, and metrics used [Citation43,Citation44].
In our study, GB displays the best performance level for predicting LOS. In a recent study [Citation45], LOS prediction was modeled with multiple linear regression, support vector machine, RF and GB. GB outperformed all the other models using a basic training-test split with a 70–30% ratio. In another study, RF slightly outperformed GB [Citation13]. NN as a multiple layer perceptron (MLP) is often used as a benchmark to other ML models but GB consistently outperforms NN on tabular datasets [Citation14,Citation15]. This is verified again here for the three-hidden layers NN (5 layers MLP).
Scientific efforts to provide accurate prediction of LOS have been steady for half of a century [Citation43]. While the use of ML in health-related research has become more and more popular, its application on LOS remains scattered. A recent systematic review conducted by Bacchi et al. [Citation44] identified only 21 articles predicting LOS including regression and classification as well as different medical specialties group patients. Several shortcomings have been highlighted by the authors and considered in our work.
The failure to provide the criteria of inclusion as well as the lack of demographic and clinical information such as disease prevalence details: this issue has been carefully considered in our work with detailed clinical and organizational information.
The lack of information regarding the distribution of the LOS outcome and the handling of the outliers: in our study, we considered as a prolonged stay any potential outlier of the quantitative LOS variable, according to a valid and reproducible criterion: Tukey’s criterion [Citation26,Citation27]. The distribution of long and short LOS is provided for the whole dataset and for each variable.
The absence of separate datasets for training and assessment leading to overfitting (i.e., inflation of the model performance) [Citation44]: model assessment must be implemented on a dataset never seen by the trained model. Selecting randomly a test-training split of the data set might lead to an overly optimistic or pessimistic outcome [Citation29,Citation43]. Hence, cross validation is recognized as an alternative. However, k-fold cross validation may also lead to overfitting unless separate validation sets are used [Citation44,Citation46]. Thus, some authors suggest that rigorous performance evaluation requires multiple randomized partitioning of the available data, with model selection performed separately in each trial [35, p. 2103]. In this study, we have used separate validation sets for model selection and hyperparameter tuning and another different holdout test set to check for overfitting.
Beyond the limitations noted in these reviews, we suggest other areas in which improvements may be needed.
First of these is a systematic reporting of the feature importance. One reason why this is not implemented is that most of the learners use their inbuilt feature importance computation, while others do not. Permutation importance may be called for estimating feature importance in a way that is equivalent for all ML models. Thus, in our case, all the learners concur that the feature most predictive (by far) of PLOS is the Destination of Patient on Discharge to other but home.
Another potential area of improvement lies in the use of resampling-based statistical tests to compare performance. To account for any randomness involved in training-validation splits, we may supplement any performance comparison with, say 100 resampling of the training and validation set. From this perspective, each learner becomes comparable to an experimental condition and each resampling to a statistical unit. It now becomes possible to apply a means comparison between the learners over 100 samples, using for example post-hoc methods and Bonferroni correction. And the observed difference can not only be estimated in terms of statistical significance but also in terms of effect size [Citation47]. Under this perspective, the use of the holdout test sample becomes at best a way of verifying the absence of overfitting.
Finally, our findings identify important levers for action for health-care professionals, planners and health policy. Destination to other institutions, especially for elderly patient, admitted in emergency, for a trauma, a neurological or a cardiovascular pathology, more often institutionalized and with more comorbidities were associated with substantial PLOS. Previous studies have shown that discharge destination have significant impact on LOS. In a sample of 313,144 medical records of all patients older than 18, discharge destination was one of the main LOS predictors [Citation48]. In addition, another study confirmed that older patients’ PLOS (>17 days) was associated with discharge to places other than usual residence [Citation49]. Indeed, hospitalizations are frequently associated in older people with an increased risk of functional decline both during hospitalization and following discharge [Citation50]. These findings provide a rationale for increased staffing for elderly patients requiring intensive care in hospitals, particularly for those with cognitive impairment and multiple comorbidities. Needing more caring time than usual was reported for 20% of older patients in general and for 57% of the patients with dementia [Citation51]. Considering the demographic change, this situation will worsen and there is thus an urgent need to strengthen hospitals with targeted allocation to meet the needs of an aging population.
Perspectives and limitations. Some of our variables are collected before or during hospitalization, whereas others are collected at or after discharge (different time sequence). However, as mentioned earlier, ours is a retrospective study; thus, all the data have been collected from the past anyway (2015). These are but only a part of all the challenges and limitations inherent to retrospective studies [Citation52,Citation53]. Furthermore, there are many other predictors that could have been relevant for this study, not the least of which are all the biology-related variables such as the vital constants and the lab analyses as well as the clinical notes. Some of these variables are time sequential (collected periodically every given number of hours). So indeed, the timing of the data collection is a central one, much easier to handle with retrospective studies than in any other design [Citation52]. Unfortunately, only a subset of these variables was available for our study.
Over the last recent years, GB and its subsequent improvements, such as XGBoost, Light GBM and Catboost have proven to be superior to the traditional GB [Citation54–56] which has consistently outperformed the best classical Machine Learning and Statistical Models [Citation14,Citation15]. More recently authors and researchers have made tremendous progress in the field of explainable AI, thus allowing for an interpretability of the ML predictions no less relevant than the classical LR models [Citation57,Citation58]. Finally, some very accessible Auto Machine Learning models (AutoML) have also been developed over the last several months such as the AutoGluon package [Citation59][] which offers the possibility of implementing rather advanced ML with the most current and best performing models using only very few lines of code. ML is quickly becoming mainstream and may easily be deployed at least in a hospital’s information system to help detect risks in Quality of Care such as the deterioration of the patients’ experience or the efficiency of bed management .
Conclusion
The integration of ML, particularly the GB algorithm, may be useful for health-care professionals and planners to better identify patients at risk of PLOS. These findings underscore the need to strengthen hospitals through targeted allocation to meet the needs of an aging population.
Supplemental Material
Download Zip (19.2 KB)Disclosure statement
No potential conflict of interest was reported by the authors.
Supplementary material
Supplemental data for this article can be accessed online at https://doi.org/10.1080/20016689.2022.2149318
References
- Direction de la Recherche, des Études, de l’Évaluation et des Statistiques, “Les dépenses de santé en 2019 - Résultats des comptes de la santé - Édition 2020,” Vie publique.fr. cited 2022 Jan 11 Available from https://www.vie-publique.fr/rapport/276352-les-depenses-de-sante-en-2019-resultats-des-comptes-de-la-sante
- Baumann A, Wyss K. The shift from inpatient care to outpatient care in Switzerland since 2017: policy processes and the role of evidence. Health Policy. 2021 Apr;125(4):512–11.
- Exertier Les inadéquations hospitalières en France : fréquence, causes et impact économique , et al. In: Le panorama des établissements de santé (Paris: DREES) . 2011. 33–45.
- Rojas‐García A, Turner S, Pizzo E, et al. Impact and experiences of delayed discharge: a mixed‐studies systematic review. Health Expect. 2018 Feb;21(1):41–56.
- Marfil-Garza BA, et al. Risk factors associated with prolonged hospital length-of-stay: 18-year retrospective study of hospitalizations in a tertiary healthcare center in Mexico. PLoS One. 2018;13(11):e0207203.
- Tefera GM, Feyisa BB, Umeta GT, et al. Predictors of prolonged length of hospital stay and in-hospital mortality among adult patients admitted at the surgical ward of Jimma University medical center, Ethiopia: prospective observational study. J Pharm Policy Pract. 2020Jun;13:24.
- Acion L, Kelmansky D, van der Laan M, et al. Use of a machine learning framework to predict substance use disorder treatment success. PLOS ONE. 2017 Apr;12(4):e0175383.
- Ahn JM, Kim S, Ahn K-S, et al. A deep learning model for the detection of both advanced and early glaucoma using fundus photography. PLOS ONE. 2018 Nov;13(11):e0207982.
- Chekroud AM, et al. Cross-trial prediction of treatment outcome in depression: a machine learning approach. Lancet Psychiatry. 2016 Mar;3(3):243–250.
- Gholipour C, Rahim F, Fakhree A, et al. Using an artificial neural networks (ANNs) model for prediction of intensive care unit (ICU) Outcome and length of stay at hospital in traumatic patients. J Clin Diagn Res. 2015 Apr;9(4):OC19–OC23.
- Kuhn M, Johnson K, Applied Predictive Modeling. New York: Springer-Verlag, 2013. cited 2018 Sep 05. [Online]. Available from: //www.springer.com/us/book/9781461468486
- Ebinger J, et al. A machine learning algorithm predicts duration of hospitalization in COVID-19 patients. Intell Based Med. 2021Jan;5:100035.
- Mekhaldi RN, Caulier P, Chaabane S, et al. Using machine learning models to predict the length of stay in a hospital setting. Trends and innovations in information systems and technologies. Cham; 2020. 202–211. 10.1007/978-3-030-45688-7_21.
- Bacchi S, et al. Prediction of general medical admission length of stay with natural language processing and deep learning: a pilot study. Intern Emerg Med. 2020 Sep;15(6):989–995.
- Fernández-Delgado M, Cernadas E, Barro S, et al. Do we need hundreds of classifiers to solve real world classification problems? J Mach Learn Res. 2014;15:3133–3181.
- Boudemaghe T, Belhadj I. Data resource profile: the French national uniform hospital discharge data set database (PMSI). Int J Epidemiol. 2017 Apr;46(2): 392–392. DOI:10.1093/ije/dyw359.
- Williams TA, Ho KM, Dobb GJ, et al. Effect of length of stay in intensive care unit on hospital and long-term mortality of critically ill adult patients. Br J Anaesth. 2010 Apr;104(4):459–464.
- Hassan A, et al. Clinical outcomes in patients with prolonged intensive care unit length of stay after cardiac surgical procedures. Ann Thorac Surg. 2012 Feb;93(2):565–569.
- Mahesh B, Choong CK, Goldsmith K, et al. Prolonged stay in intensive care unit is a powerful predictor of adverse outcomes after cardiac operations. Ann Thorac Surg. 2012 Jul;94(1):109–116.
- Becker GJ, Strauch GO, Saranchak HJ. Outcome and cost of prolonged stay in the surgical intensive care unit. Arch Surg. 1984 Nov;119(11):1338–1342.
- Laupland KB, Kirkpatrick AW, Kortbeek JB, et al. Long-term mortality outcome associated with prolonged admission to the ICU. Chest. 2006 Apr;129(4):954–959.
- Zampieri FG, et al. Admission factors associated with prolonged (>14 days) intensive care unit stay. J Crit Care. 2014 Feb;29(1):60–65.
- MacIntyre NR, Epstein SK, Carson S, et al. Management of patients requiring prolonged mechanical ventilation: report of a NAMDRC consensus conference. Chest. 2005 Dec;128(6):3937–3954.
- White AC. Long-term mechanical ventilation: management strategies. Respir Care. 2012 Jun;57(6):889–899.
- Blumenfeld YJ, El-Sayed YY, Lyell DJ, et al. Risk factors for prolonged postpartum length of stay following cesarean delivery. Am J Perinatol. 2015 Jul;32(9):825–832.
- Tukey J. Exploratory Data Analysis. 1st ed. Reading Mass: Pearson; 1977.
- Everitt BS, Skrondal A. The Cambridge dictionary of statistics. 4th ed. Cambridge UK New York: Cambridge University Press; 2010.
- Quan H, et al. Coding algorithms for defining comorbidities in ICD-9-CM and ICD-10 administrative data. Med Care. 2005 Nov;43(11):1130–1139.
- Hastie T, Tibshirani R, Friedman J, The Elements of Statistical Learning: Data Mining, Inference, and Prediction, Second Edition, 2nd ed. New York: Springer-Verlag, 2009. cited 2018 Sep 06. [Online]. Available from: //www.springer.com/us/book/9780387848570
- Breiman L, Friedman J, Stone CJ, et al. Classification and regression trees. Florida: CRC press; 1984.
- Jaotombo F, et al. Machine-learning prediction of unplanned 30-day rehospitalization using the French hospital medico-administrative database. Medicine (Baltimore). 2020 Dec;99(49):e22361.
- Breiman L. Random Forests. Mach Learn. 2001 Oct;45(1):5–32.
- Friedman JH. Greedy function approximation: a gradient boosting machine. Ann Stat. 2001 Oct;29(5):1189–1232.
- The handbook of brain theory and neural networks. Arbib MA, editor. Cambridge MA: A Bradford Book; 1995.
- Goulet-Pelletier J-C, Cousineau D. A review of effect sizes and their confidence intervals, Part I: the Cohen’s d family. TQMP. 2018 Dec;14(4):242–265.
- Wardhani NWS, Rochayani MY, Iriany A, et al., “Cross-validation metrics for evaluating classification performance on imbalanced data,” in 2019 International Conference on Computer, Control, Informatics and its Applications (IC3INA), Oct. 2019, pp. 14–18. doi: 10.1109/IC3INA48034.2019.8949568.
- Huang J, Ling CX. Using AUC and accuracy in evaluating learning algorithms. IEEE Trans Knowledge Data Eng. 2005 Mar;17(3):299–310.
- Kaur H, Pannu HS, Malhi AK. A systematic review on imbalanced data challenges in machine learning: applications and solutions. ACM Comput Surv. 2019 Aug;52(4):1–79.
- Altmann A, Toloşi L, Sander O, et al. Permutation importance: a corrected feature importance measure. Bioinformatics. 2010 May;26(10):1340–1347.
- Van Rossum G, De Boer J. Interactively testing remote servers using the python programming language. CWI Q. 1991 Dec;4(4):283–303.
- Pedregosa F, et al. Scikit-learn: machine learning in python. J Mach Learn Res. 2011;12:2825–2830.
- Chollet F, “Keras,” GitHub repository, 2015, [Online]. Available: https://github.com/fchollet/keras%7D%7D
- Lequertier V, Wang T, Fondrevelle J, et al. Hospital length of stay prediction methods: a systematic review. Med Care. 2021 Oct;59(10):929–938.
- Bacchi S, Tan Y, Oakden-Rayner L, et al. Machine learning in the prediction of medical inpatient length of stay. Intern Med J. 2020. DOI:10.1111/imj.14962
- Rachda Naila M, Caulier P, Chaabane S, et al. A comparative study of machine learning models for predicting length of stay in hospitals. J Inf Sci. 2021 Sep;37:1025–1038.
- Cawley GC, Talbot NLC. On over-fitting in model selection and subsequent selection bias in performance evaluation. J Mach Learn Res. 2010;11(70):2079–2107.
- Bland JM, Altman DG. Statistics Notes: bootstrap resampling methods. BMJ. 2015Jun;350:h2622.
- Brasel KJ, Lim HJ, Nirula R, et al. Length of stay: an appropriate quality measure? Arch Surg. 2007 May;142(5):461–466.
- Lisk R, et al. Predictive model of length of stay in hospital among older patients. Aging Clin Exp Res. 2019 Jul;31(7):993–999.
- Koskas P, Pons-Peyneau C, Romdhani M, et al. Hospital discharge decisions concerning older patients: understanding the underlying process. Canad J Aging/La Revue canadienne du vieillissement/La Revue canadienne du vieillissement. 2019 Mar;38(1):90–99.
- Hendlmeier I, Bickel H, Heßler-Kaufmann JB, et al. Care challenges in older general hospital patients. Z Gerontol Geriat. 2019 Nov;52(4):212–221.
- Talari K, Goyal M. Retrospective studies – utility and caveats. J R College Physicians Edinburgh. 2020 Dec;50(4):398–402.
- Tofthagen C. Threats to validity in retrospective studies. J Adv Pract Oncol. 2012;3(3):181–183.
- Chen T, Guestrin C, “XGBoost: a scalable tree boosting system,” in Proceedings of the 22nd ACM SIGKDD International Conference on Knowledge Discovery and Data Mining, New York, NY, USA, Aug. 2016, pp. 785–794. doi: 10.1145/2939672.2939785.
- Ke Guolin, Meng, Qi, Finley, Thomas, Wang, Taifeng, Chen, Wei, Ma, Weidong, Ye, Qiwei, Liu, Tie-Yan LightGBM: A Highly Efficient Gradient Boosting Decision Tree Advances in Neural Information Processing Systems 30: Annual Conference on Neural Information Processing Systems 2-4 December Long Beach, CA. In: . Vol. 30 Guyon, Isabelle, von Luxburg, Ulrike, Bengio, Samy, Wallach, Hanna M., Fergus, Rob, Vishwanathan, S. V. N., Garnett, Roman 3149–3157 . 2017. Available fromhttps://proceedings.neurips.cc/paper/2017/hash/6449f44a102fde848669bdd9eb6b76fa-Abstract.html
- Prokhorenkova Liudmila, Gusev Gleb, Vorobev Aleksandr, Dorogush, Anna Veronika, Gulin, Andrey CatBoost: Unbiased Boosting with Categorical Features . Vol. 31 (NY: Curran Associates Inc.)6639–6649. 2018. NIPS'18: Proceedings of the 32nd International Conference on Neural Information Processing System 3-8 December 2018 Montréal, Canada. Available fromhttps://proceedings.neurips.cc/paper/2018/hash/14491b756b3a51daac41c24863285549-Abstract.html
- Linardatos P, Papastefanopoulos V, Kotsiantis S. Explainable AI: a review of machine learning interpretability methods. Entropy. 2021 Jan;23(1, Art. no. 1):DOI:10.3390/e23010018
- Lundberg SM, et al. From local explanations to global understanding with explainable AI for trees. Nat Mach Intell. 2020 Jan;2(1, Art. no. 1). DOI:10.1038/s42256-019-0138-9.
- Erickson N, et al., “AutoGluon-tabular: robust and accurate AutoML for structured data.” arXiv, Mar. 13, 2020. doi: 10.48550/arXiv.2003.06505
Appendix
A github of the codes used in this article is available here: