
ABSTRACT
Background: The increasing prevalence of obesity imposes a significant cost burden on individuals and societies worldwide.
Objective: In this nationally representative study, the association between body mass index (BMI) groups and the number of metabolic comorbidities (MetC) with total direct costs was investigated in the Finnish population.
Study design, setting, and participants: The study cohort included 5,587 adults with BMI ≥18.5 kg/m2 who participated in the cross-sectional FinHealth 2017 health examination survey conducted by the Finnish Institute for Health and Welfare. Data on healthcare resource utilization (HCRU) and drug purchases were collected from national healthcare and drug registers.
Main outcome measure: The primary outcome was total direct costs (costs of primary and secondary HCRU and prescription medications).
Results: Class I (BMI 30.0–34.9 kg/m2) and class II – III (BMI ≥35.0 kg/m2) obesity were associated with 43% and 40% higher age- and sex-adjusted direct costs, respectively, compared with normal weight, mainly driven by a steeply increased comorbidity in the higher BMI groups. In all BMI groups combined, individuals with ≥2 MetCs comprised 39% of the total study population and 60% of the total costs.
Conclusion: To manage the cost burden of obesity, treatment should be given equal consideration as other chronic diseases, and BMIs ≥30.0 kg/m2 should be considered in treatment decisions.
Introduction
The increasing prevalence of obesity and obesity-related comorbidities (ORCs) imposes a significant burden on individuals and societies worldwide [Citation1]. In the 38 OECD countries, over half of the population had overweight (body mass index, BMI ≥25.0 kg/m2) and almost one in four people had obesity (BMI ≥30.0 kg/m2) in 2014 [Citation2]. In these countries, overweight, obesity, and ORCs comprised 2–8% of total healthcare expenditure. In addition to direct medical costs, obesity and ORCs are associated with reduction in disease-free life years, premature mortality, lost productivity, and decreased quality of life (QoL), magnifying the negative macroeconomic consequences [Citation3–5].
Prevention of obesity through policy changes and effective care strategies is critical to curbing the worsening obesity epidemic. Obesity treatment still lags behind many other chronic diseases [Citation2,Citation6–9]. Lifestyle and behavioral interventions, the cornerstones of obesity management, do not provide sustainable weight loss in most individuals [Citation8]. Pharmacological and surgical interventions, which provide an efficient treatment for obesity together with lifestyle modifications, are currently limited by accessibility, lack of recognition of obesity as a chronic condition, costs, and multiple environmental factors and misbeliefs [Citation8,Citation10,Citation11].
Detailed cost analyses form a basis for modeling the burden of obesity and for evaluating the effect of interventions and resource allocation [Citation6,Citation12]. In this nationally representative study, we investigated the association between BMI groups and the number of metabolic comorbidities (MetCs; high blood pressure, high blood triglycerides, low levels of high-density lipoprotein [HDL], and insulin resistance; representing four of the five metabolic syndrome (MetS) components excluding abdominal obesity, which in itself is not metabolic) with total direct costs (healthcare resource utilization [HCRU] and medication costs) in Finland. Additionally, we assessed the contribution of different BMI groups, stratified by number of MetCs, on the total direct costs at the population level.
Materials and Methods
Study design and study cohort
The study cohort was based on the national, cross-sectional FinHealth 2017 health examination survey conducted by the Finnish Institute for Health and Welfare in 2017 [Citation4,Citation13], supplemented with data from the Finnish national health registers (Supplementary Table 1).
Study groups
The analyses were based on 5,587 FinHealth 2017 study participants who had BMI measured in the health examination and were not underweight (BMI <18.5 kg/m2). The following BMI subgroups were defined according to WHO’s classifications: 18.5–24.9 kg/m2 (normal weight, NW), 25.0–29.9 kg/m2 (overweight, OW), 30.0–34.9 kg/m2 (class I obesity, OBI), and ≥35.0 kg/m2 (class II – III obesity, OBII – III). Moreover, subgroups were formed based on the number of MetCs present (0, 1, or ≥2; of 4 possible MetCs). Presence of MetCs was defined based on laboratory measurements in the FinHealth 2017 health examinations (National Cholesterol Education Program’s Adult Treatment Panel III report (ATP III) criteria for MetS components), and based on the purchases of selected medications data from the Prescription Register by the Social Insurance Institution of Finland (Supplementary Methods) [Citation14].
Outcomes
The primary outcome of the study was total direct costs, including costs of HCRU and prescription medications. The healthcare costs were calculated based on standard unit costs reported by the Finnish Institute for Health and Welfare [Citation15]. The two components (HCRU costs, prescription medication costs) were considered individually as secondary outcomes.
Statistical analyses
In all analyses, the weighting of observations was used to match the distribution of known background factors (age, sex, etc.) in the group of participants with that in the whole Finnish population [Citation16]. Data analyses are detailed in the Supplementary Material.
Ethical Considerations
See Supplementary Material.
Results
Association between BMI group and the number of MetCs
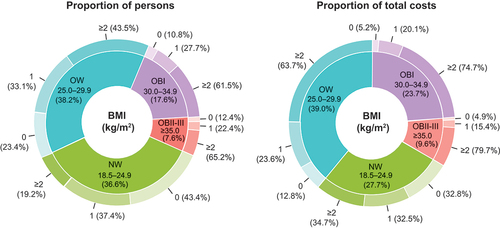
The baseline demographic and clinical characteristics of the study population are presented in Supplementary Table 2. The prevalence of MetCs increased with higher BMI groups: the proportion of individuals with 0 MetCs was 43.4% in NW, 23.4% in OW, 10.8% in OBI, and 12.4% in OBII – III groups (). Most of the individuals with obesity had ≥2 MetCs: 61.5% for OBI and 65.2% for OBII – III. When adjusted for age and sex, individuals with OW, OBI, and OBII – III had a 2.3-fold (odds ratio [OR]; 2.33; 95% CI, 1.97–2.76), 5.7-fold (OR, 5.70; 95% CI, 4.55–7.14), and 10.0-fold (OR, 9.97; 95% CI, 7.23–13.74) risk of having ≥2 MetCs, respectively, compared with patients with NW (p < 0.001).
Figure 1. Proportion of individuals (a) and total costs (b) of the total Finnish population attributed by body mass index (BMI, kg/m2) and number of metabolic comorbidities. The inner circle shows the proportions by BMI group and the outer circle the proportions by number of metabolic comorbidities.
BMI groups stratified by number of MetCs and total direct costs
Class I obesity individuals comprised 17.6% of the total study population and 23.7% of the total costs, and the corresponding percentages were 7.6% and 9.6% for the OBII – III (). All BMI groups combined, individuals with ≥2 MetCs comprised 39.4% of the total study population and 59.7% of the total costs, whereas individuals without MetCs comprised 27.6% of the total study population and 15.8% of the costs.
Association between BMI group, number of MetCs, and direct costs
Average annual total direct costs were 1,527€, 2,060€, 2,720€, and 2,539€ per person for individuals with NW, OW, OBI, and OBII – III, respectively (, Supplementary Table 3). When adjusted for age and sex, OBI and OBII – III were associated with 43% (rate ratio [RR], 1.43; 95% Cl, 1.18–1.73; p < 0.001) and 40% higher costs (RR, 1.40; 95% CI, 1.13–1.75; p < 0.001), respectively, compared with the NW group ().
Figure 2. Characterization of the annual total direct costs, healthcare costs, and pharmacotherapy costs (mean with 95% confidence intervals) in the body mass index (BMI) groups and by the number of metabolic comorbidities (0, 1, ≥2).
Figure 3. The rate ratios (95% confidence intervals) of annual total direct costs estimated using the age- and sex-adjusted overdispersed Poisson regression model.
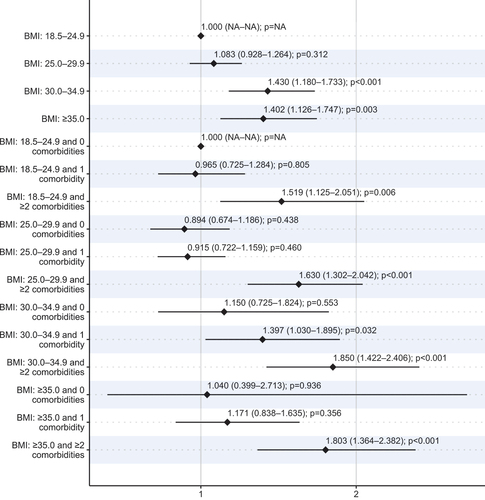
In the model considering both BMI and the number of MetCs, having ≥2 MetC was associated with significantly increased total direct costs in all BMI groups compared with the NW and 0 MetCs group (RR, 1.52–1.85, p < 0.001). The age- and sex-adjusted direct costs were also significantly higher for OBI and 1 MetC individuals compared with NW and 0 MetCs (RR, 1.40; 95% CI, 1.03–1.86, p = 0.032).
Having ≥2 MetCs was associated with significantly increased costs in all BMI groups compared with the NW and 0 MetCs group also when total healthcare and medication costs were considered as separate outcomes (Figure S1 and S2). The rate ratios were higher for medication costs (1.66–2.88) compared with healthcare costs (1.48–1.66).
Of the individual MetCs, the association with total direct costs was highest for low HDL levels (rate ratio [RR], 1.70; 95% Cl 1.49–1.95), followed by high blood triglycerides (RR, 1.45; 95% Cl 1.27–1.64), and insulin resistance (RR, 1.43; 95% Cl 1.23–1.66) (p < 0.001), while high blood pressure alone was not associated with total direct costs (Supplementary Table 4). In the multivariate model including all four MetCs and BMI groups, only low HDL levels (RR, 1.62; 95% CL, 1.29–2.02),) and insulin resistance (RR, 1.33; 95% Cl 1.145–1.55) were associated with significantly increased total costs (Supplementary Table 5). All MetCs were correlated, with the strongest correlation between low HDL levels and high blood triglycerides (Cramer´s V, 0.63) (Supplementary Table 6).
Discussion
This study indicated that OBI and OBII – III were associated with 43% and 40% higher age- and sex-adjusted direct costs, respectively, compared with normal weight, mainly driven by the steeply increased number of comorbidities in higher BMI groups. Compared with individuals with NW, the risk of having ≥2 MetCs was 2.3-times higher for individuals with OW, 5.7-times higher for OBI, and 10.0-times higher for OBII – III. At the population level, the biggest share of total direct costs occurred in individuals with OW and ≥2 MetCs (24.8% of total costs) and class I obesity and ≥2 MetCs (17.7%).
In previous studies, analyses of costs of obesity suggest that at the individual level, the higher the BMI, the higher are both direct and indirect costs [Citation3,Citation17–20]. Moreover, being overweight was associated with adverse health outcomes and excess costs [Citation1,Citation20,Citation21]. Interestingly, our results indicate that compared with individuals with NW, the age-and sex-adjusted increase in direct costs was at a similar level in OBI and OBII – III groups. This is significant, first because the proportion of individuals with OBI (17.6%) was 2.3-times higher than those with OBII – III (7.6%), and their contribution to total direct costs at the societal level was substantial (23.7%). Second, treatment of obesity in real-world clinical practice is often focused on individuals with severe obesity [Citation11]. This suggests that providing efficient treatments for the more numerous individuals with OBI could be a remarkable opportunity for improving health and managing the increasing costs associated with obesity.
A possible explanation for the similar results for OBI and OBII – III is an almost equal distribution of the number of risk factors in these groups. In line with previous studies, our results suggested that direct costs were mainly determined by the number of MetCs [Citation22]. Having ≥2 MetCs was associated with increased costs in all BMI groups, including NW (52% higher costs) and OW (63%), but there was a trend toward larger effect sizes in the OBI (85%) and OBII – III (80%) groups. In individuals with OBI, having only 1 MetC was also associated with increased total costs (40%). Although these findings underline the importance of identification and treatment of MetCs irrespective of BMI, it should be noted that the prevalence of MetCs increased significantly with higher BMI groups: over 60% of individuals in obesity groups had ≥2 MetCs as compared with 19% in the NW group.
Consistent with previously reported data, the increase in BMI group was associated with a smaller increase in HCRU costs (0–29%) compared with medication costs (45–112%) [Citation23]. This is an intrinsic result of increased comorbidity in higher BMI groups, suggesting that health management in individuals with obesity is focused on medication treatments of comorbid conditions individually. However, to fully tackle the burden of obesity, a paradigm shift regarding the recognition of obesity itself as a chronic, treatable disease, is needed. Targeting obesity represents a ponderable opportunity for multimorbidity prevention and managing the growing burden of healthcare. Weight loss positively affects all MetS components, and projections have suggested that decreasing BMI even by 1% across the population can substantially reduce the health burden from non-communicable diseases [Citation7].
Comparison of the economic burden of obesity between countries and studies is challenging due to heterogeneities in prevalence, methodological approaches, and in healthcare and payer systems [Citation24]. In most studies, the classification of BMI is based on self-reported data, prone to weight underestimation [Citation25]. This study was based on a national health examination survey, allowing us to utilize BMI data measured in clinical examinations and subsequently extrapolate results at a national level. Such data are imperative to guide decision-making and healthcare resource allocation locally and provide valuable insight into direct costs attributable to different BMI groups at the population level.
The strength of this study was the comprehensive laboratory and medication data available, which allowed us to assess the presence of MetCs based on clinical measures instead of only the International Classification of Diseases − 10th revision diagnosis codes. MetS and its components are typically underscreened and underdiagnosed, and by using clinical measurements, we could catch patients lacking a diagnostic code [Citation26,Citation27]. Our study limitations stem from its cross-sectional design: no longitudinal costs considering possible weight changes were investigated. Moreover, using BMI as a measure of body fat has limitations, e.g., it is unable to distinguish between lean and fat mass [Citation28]. Additionally, data and costs of private healthcare (cover approximately 25% of healthcare provided in Finland) were not available from the registers used. Further studies, including indirect costs, are essential to evaluate the full burden of excess BMI in Finland. Noteworthy, although the FinHealth study sample was formed using random sampling, and weighting was used in analyses, individuals with the weakest physical condition may have opted out of health examinations. This may cause bias, especially in the highest BMI groups, and may partly explain the similar results observed in OBI and OBII – III individuals.
Our results highlight the importance of paying attention to the whole range of BMIs ≥30.0 kg/m2 in obesity treatment. In addition to urgent actions needed from different stakeholders to stop the growing prevalence of this preventable disease, treatment for obesity should be given equal consideration as for other chronic diseases [Citation29]. Several treatments, including medications with proven efficacy in clinical trials and real-world clinical practice, should be considered together with lifestyle guidance to support weight management [Citation8,Citation11].
Supplemental Material
Download MS Word (1.8 MB)Supplemental Material
Download MS Word (1.8 MB)Acknowledgments
THL Biobank granted permission for the FinHealth 2017 study (permit number BB2019_27) and delivered study data. We acknowledge the FinHealth 2017 participants. Harlan Barker from MedEngine Oy is acknowledged for language review.
Disclosure statement
TY is the owner of MedEngine Oy. AV and JM are employees of MedEngine Oy. TS and KM are employees of Novo Nordisk and TS owns shares in Novo Nordisk. KP, TL, and AL have no competing interests.
Supplementary data
Supplemental data for this article can be accessed online at https://doi.org/10.1080/20016689.2023.2166313
Additional information
Funding
References
- Health effects of overweight and obesity in 195 countries over 25 years. N Engl J Med. 2017 Jun;377(1):13–7. DOI:10.1056/NEJMoa1614362.
- OECD. The Heavy Burden of Obesity. 2019. 240 p.
- Kjellberg J, Tange Larsen A, Ibsen R, et al. The socioeconomic burden of obesity. Obes Facts. 2017;10(5):493–502.
- Vesikansa A, Mehtälä J, Jokelainen J, et al. The association of body mass index with quality of life and working ability: a Finnish population-based study. Qual Life Res Int J Qual Life Asp Treat Care Rehabil. 2022 Feb;31(2):413–423. 10.1007/s11136-021-02993-0.
- Goettler A, Grosse A, Sonntag D. Productivity loss due to overweight and obesity: a systematic review of indirect costs. BMJ Open. 2017 Oct;7(10):e014632.
- Andersson E, Eliasson B, Steen Carlsson K. Current and future costs of obesity in Sweden. Health Policy. 2022;126(6):558–564.
- Wang YC, McPherson K, Marsh T, et al. Health and economic burden of the projected obesity trends in the USA and the UK. Lancet Lond Engl. 2011 Aug;378(9793):815–825.
- Müller TD, Blüher M, Tschöp MH, et al. Anti-obesity drug discovery: advances and challenges. Nat Rev Drug Discov. 2022;21(3):201–223.
- Hugh Waters and Marlon Graf, America’s Obesity Crisis The Health and Economic Costs of Excess Weight. Milken Institute. 2018. https://milkeninstitute.org/sites/default/files/reports-pdf/Mi-Americas-Obesity-Crisis-WEB_2.pdf
- Bessesen DH, Van Gaal LF. Progress and challenges in anti-obesity pharmacotherapy. Lancet Diabetes Endocrinol. 2018 Mar;6(3):237–248.
- Ahmad NN, Robinson S, Kennedy-Martin T, et al. Clinical outcomes associated with anti-obesity medications in real-world practice: a systematic literature review. Obes Rev Off J Int Assoc Study Obes. 2021 Nov;22(11):e13326.
- Webber L, Divajeva D, Marsh T, et al. The future burden of obesity-related diseases in the 53 WHO European-Region countries and the impact of effective interventions: a modelling study. BMJ Open. 2014 Jul;4(7):e004787. 10.1136/bmjopen-2014-004787.
- Koponen P, Borodulin K et al. Terveys, toimintakyky ja hyvinvointi Suomessa FinTerveys 2017 - tutkimus. Finnish Institute for Health and Welfare. 2018 [cited 2023 Jan 13]. Avilable from:http://urn.fi/URN:ISBN:978-952-343-105-8
- Panel on Detection, Evaluation, and Treatment of High Blood Cholesterol in Adults, E. Expert Panel on DetectionEvaluation, and treatment of high blood cholesterol in adults. executive summary of the third report of the national cholesterol education program (NCEP) expert panel on detectionEvaluation, and Treatment of High Blood Cholesterol in Adults (Adult Treatment Panel III)JAMA2001 May 1628512486–249710.1001/jama.285.19.2486
- Kapiainen S, Väisänen A, Haula T. Terveyden- ja sosiaalihuollon yksikkökustannukset Suomessa vuonna 2011 [Internet]. 2014 [cited 2022 Jun 28]. Available from: https://www.julkari.fi/handle/10024/114683
- Borodulin K, Sääksjärvi K. FinHealth 2017 Study: Methods. Finnish Institute for Health and Welfare. 2019 [cited 2023 Jan 13]. Avilable from: http://urn.fi/URN:ISBN:978-952-343-449-3
- Arterburn DE, Maciejewski ML, Tsevat J. Impact of morbid obesity on medical expenditures in adults. Int J Obes. 2005;29(3):334–339.
- Yates N, Teuner CM, Hunger M, et al. The economic burden of obesity in Germany: results from the population-based KORA studies. Obes Facts. 2016;9(6):397–409. DOI:10.1159/000452248
- Cawley J, Biener A, Meyerhoefer C, et al. Direct medical costs of obesity in the United States and the most populous states. J Manag Care Spec Pharm. 2021 Mar;27(3):354–366. 10.18553/jmcp.2021.20410.
- Ward ZJ, Bleich SN, Long MW, et al. Association of body mass index with health care expenditures in the United States by age and sex. PLoS ONE. 2021 Mar;16(3):e0247307.
- Kent S, Green J, Reeves G, et al. Hospital costs in relation to body-mass index in 1·1 million women in England: a prospective cohort study. Lancet Public Health. 2017 May;2(5):e214–22. 10.1016/S2468-2667(17)30062-2.
- Boudreau DM, Malone DC, Raebel MA, et al. Health care utilization and costs by metabolic syndrome risk factors. Metab Syndr Relat Disord. 2009 Aug;7(4):305–314. 10.1089/met.2008.0070.
- Vesikansa A, Mehtälä J, Mutanen K, et al. Obesity and metabolic state are associated with increased healthcare resource and medication use and costs: a Finnish population-based study. Eur J Health Econ. [2022 Sep 5[cited 2022 Nov 30]; Available from]. Internet. DOI:10.1007/s10198-022-01507-0
- Kent S, Fusco F, Gray A, et al. Body mass index and healthcare costs: a systematic literature review of individual participant data studies. Obes Rev Off J Int Assoc Study Obes. 2017 Aug;18(8):869–879.
- Connor Gorber S, Tremblay M, Moher D, et al. A comparison of direct vs. self-report measures for assessing height, weight and body mass index: a systematic review. Obes Rev off J Int Assoc Study Obes. 2007 Jul;8(4):307–326.
- Fujiyoshi A, Murad MH, Luna M, et al. Metabolic syndrome and its components are underdiagnosed in cardiology clinics. J Eval Clin Pract. 2011 Feb;17(1):78–83. 10.1111/j.1365-2753.2010.01371.x.
- Kim EG, Kaelber DC. Phenotypic prevalence of obesity and metabolic syndrome among an underdiagnosed and under screened population of over 50 million children and adults. Front Genet InternetAvailable from. 2022 [cited 2022 Dec 2]; 13. 10.3389/fgene.2022.961116.
- Buss J. Limitations of body mass index to assess body fat. Workplace Health Saf. 2014 Jun;62(6):264.
- Bray GA, Kim KK, Wilding JPH. Federation on behalf of the WO. obesity: a chronic relapsing progressive disease process. A position statement of the world obesity federation. Obes Rev. 2017 Jul;18(7):715–723.