
ABSTRACT
Exhaled breath temperature has been suggested to reflect airway inflammation, and it would be plausible to measure the peripheral airway temperature as a correlate to peripheral airway inflammation. This study aims to explore the relative peripheral airway temperature in patients with asthma, chronic obstructive pulmonary disease (COPD) or systemic sclerosis (SSc) compared to healthy controls, and relate to lung function and exhaled nitric oxide.
Sixty-five subjects (16 asthmatics, 18 COPD patients, 17 SSc patients and 14 healthy subjects) performed fractional exhaled breath temperature measurements using a novel device, fractional exhaled NO measurements, spirometry, impulse oscillometry, body plethysmography and CO-diffusion capacity test.
A significant overall difference among all the patient groups was seen in both the Tmax (= peak values of the entire exhalation) and T3max (= peak value of the last fraction of the exhaled volume). A significant difference in T3/T1 ratio (= the ratio of peripheral versus central air temperature) was found between asthmatic subjects and those with COPD or SSc. In addition, T1max (= temperature in the central), T3max (= peripheral airways) and the T3/T1ratio related to several volumetric measurements (both in absolute values and as percent predicted), such as vital capacity, total lung capacity, forced expiratory volume in 1 s, and diffusion capacity.
The temperature ratio of the peripheral versus central airways was lower in patients with COPD or SSc compared to asthmatics, who in turn presented similar levels as the controls. There was also a large overlap between the groups. Overall, the airway temperatures were related to absolute lung volumes, and specifically, the peripheral temperature was related to the gas diffusion capacity (% predicted), suggesting a link to the vascular component.
Introduction
Asthma, chronic obstructive pulmonary disease (COPD) and systemic sclerosis (SSc) are all diseases in which inflammation plays a role against different pathogenetic backgrounds.
Asthma is an obstructive disease with inflammation in both the central and peripheral airways, and it has been demonstrated that the involvement of the small-airways is associated with more severe asthma [Citation1]. The asthmatic response involves constriction of the bronchi, increased mucus production and vasodilation [Citation2,Citation3].
COPD is also an inflammatory obstructive disease covering a spectrum between chronic bronchitis and emphysema, in which the inflammatory component is superimposed on functional tissues destruction in the central (bronchitis) and peripheral compartments of the airways (emphysema) [Citation4].
SSc is a connective tissue disease characterized by fibrosis in the skin and internal organs, encompassing also the lungs. Interstitial lung disease (ILD) is a frequent complication with excessive fibrosis and vascular obliteration leading to respiratory failure [Citation5]. The peripheral manifestation of the vascular involvement is often seen as Raynaud’s phenomenon, and involvement of internal organs may result in pulmonary arterial hypertension or renal crisis [Citation6].
Inflammation is a feature of most respiratory diseases and brings about hypervascularization and increased blood flow in the airway wall with subsequent increase in the temperature of the affected tissues. The thermal signal can be further imparted to the expired air and can be captured by high precision measurement devices and used as an objective measure of the level of the underlying airway inflammation. The measurement of exhaled breath temperature (EBT) can be done with a hand-held device, which assesses the temperature plateau over multiple breaths [Citation7,Citation8]. In some studies, the EBT of asthmatics has been shown to be higher than in healthy subjects [Citation9–Citation12]. In contrast, EBT has been shown to be decreased in patients suffering from COPD when compared with healthy controls, but increased compared to healthy controls during COPD exacerbations [Citation13]. This suggests that EBT is a resulting vector of different processes in the respiratory system and explains why it displays both inter- and intrapersonal variations, and why its use in clinical management has been questioned [Citation14,Citation15].
No method has established itself as a gold standard in assessing the state of the peripheral airways [Citation16]. Furthermore, non-invasive capturing of an inflammatory signal in the lung periphery is more difficult. As exhaled nitric oxide (NO) in the periphery was known to be increased in some asthmatics [Citation17], an approach based on the two-compartment model of NO exchange [Citation18] had been attempted: alveolar NO was suggested to reflect peripheral airway inflammation and was subsequently shown to be elevated in asthma [Citation19], COPD [Citation20] and SSc [Citation21]. It would therefore be interesting to measure the EBT of the fraction that specifically originated from the peripheral airways (FrEBT). A prototype for FrEBT measurement, FracTAir, was manufactured by the Technical department of the Medical University in Sofia and was tested for reproducibility of the results and safety. During a single deep breathing cycle, it fractionates the exhaled air and their temperatures are measured by separate thermal sensors.
Our hypothesis was that peripheral inflammation in obstructive airway diseases could be measured both as an increase in temperature in the peripheral airways as well as an increase in alveolar NO. We therefore aimed to measure the FrEBT from different lung compartments in patients with asthma, COPD and SSc, and compared to healthy subjects. A secondary aim of this study was to investigate the relationship between FrEBT and alveolar NO, as well as volumetric and other physiological parameters of the lung.
Materials and methods
Subjects
Sixty-five subjects were recruited for this study; 16 asthmatics, 18 COPD patients, 17 SSc patients and 14 healthy controls (). All subjects were free of respiratory tract infection for at least 3 weeks prior to investigation. All asthmatics had a doctor’s diagnosed asthma defined according to GINA guidelines [Citation22]. All COPD patients had an FEV1/FVC<0.7 and FEV1% of predicted normal (%p) <80 and had no history of asthma. The COPD patients were further classified into GOLD [Citation23] stage II (n = 13) and III (n = 5). All SSc patients fulfilled the criteria for SSc according to the classification criteria for SSc [Citation24]. The healthy controls had no history of airway diseases.
Table 1. Patient characteristics
Atopy was based on self-reported allergy to airborne allergen due to an interview prior to the tests. Three of the healthy subjects reported atopy to pollen. Fourteen of the asthmatics reported allergy to pollen (n = 12), to fur animals (n = 12) and house dust mite (n = 8). Three of the COPD patients reported allergy to pollen, of which one was also allergic to fur animals. Half of the subjects were tested in December 2015 and half of them (including five atopic asthmatics) were tested in July-mid August 2016 (i.e. during pollen season).
All study participants signed written informed consent, and the study was approved by the Regional Ethics Review Board in Lund, Dnr 2015–157.
Study design
The patients answered a questionnaire providing information about smoking habits, airway symptoms, medication, atopy and recent air tract infections. Thereafter, subjects performed measurement of FrEBT, fractional exhaled NO and lung functions. All subjects were investigated after taking their daily medication. Due to difficulties with tightly pursing their lips around the mouthpieces, one asthmatic and one SSc patient were not able to perform the FrEBT and the NO measurements and were excluded for further analyses. Additionally, four SSc patients were unable to complete the NO measurement and were excluded from the NO analyses and correlations.
Device description
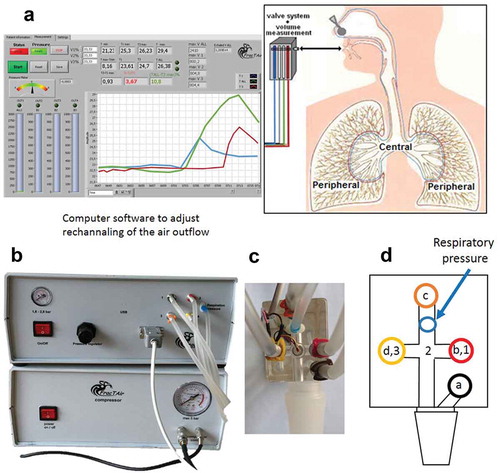
The FrEBT measuring equipment (FracTAir) consists of a fast-reacting inflatable balloon valve system operated by a computer (). It allows steering of the expired airflow through channels with sensitive temperature sensors. During initial deep inhalation, the inspired volume is measured and the sequence of valve openings is adjusted so as to yield volumes of air characteristic of central and peripheral airways during expiration. This function is adjustable so as to sample portions of air according to the investigator’s preference. Differences and ratios between exhaled breath temperatures of Caw and Paw are calculated and shown on the display of a computer.
Figure 1. Device description showing the valve system with the different temperature sensors. Computer software (a) is used to adjust the rechannelling of the air outflow from the different airway compartments (central and peripheral airways). Pictures show the apparatus (b) and handheld sensor system (c), and a schematic figure (d) of the sensor system shows the four valves (a-d) and the three sensors (1–3). Valve ‘a’ is open during inhalation, and valve ‘b-d’ are open during the first, second and third fractions, respectively, of the exhalations. Sensor 1–3 measures exhaled breath temperature in the first (blue curve in (a)), total (green curve in (a)) and third (red curve in (a)) fractions, respectively
Fractional exhaled breath temperature measurement
The sample portions of the exhaled air through a single breath were set to equal thirds (33%, 33% and 33%) for the three different fractions. Air from the dead space and of bronchial origin was supposed to be exhaled within the first 33%, and of alveolar origin within the last 33%. The device measured the lowest (Tmin) and the highest (Tmax) recorded temperatures throughout the entire exhaled breath, as well as the highest recorded temperatures in the first (T1max) and third fractions (T3max). In addition, the ratio [%] between T3max and T1max (called T3/T1 ratio) was calculated; T3/T1 ratio = (T3max – T1max)/T1max * 100.
Nitric oxide (NO)
A NIOX Flex (Aerocrine AB, Stockholm, Sweden) was used to measure exhaled NO at flow rates of 50 (giving FENO50), 100, 200 and 300 ml/s. Estimations of alveolar NO concentration and bronchial NO flux were made in a two-compartment linear model [Citation18] where flow rates of 100–300 ml/s were used.
Lung function
Subjects performed flow-volume spirometry and impulse oscillometry (MasterScreen, Erich Jaeger GmbH, Würzburg, Germany), body plethysmography together with flow-volume spirometry (MasterScreen Body, Erich Jaeger GmbH) and single breath helium dilution carbon monoxide diffusion (MasterScreen Diffusion, Erich Jaeger GmbH) in the given order. Lung function measurements were performed according to the manufacturer’s instructions and European Respiratory Society/American Thorax Society recommendations [Citation25–Citation27]. The reference values used were established by Crapo et al. [Citation28] (spirometry), from ECSC (Body plethysmography and DLCO) [Citation29] and Vogel (IOS) [Citation30]. From spirometry, forced expiratory volume in 1 s (FEV1), forced vital capacity (FVC), vital capacity (VC) and inspiratory capacity (IC) were recorded. From IOS, respiratory resistance at frequencies 5 Hz (R5) and 20 Hz (R20) was recorded as well as reactance at 5 Hz (X5), resonant frequency (Fres) and reactance area (AX). From body plethysmography, total lung capacity (TLC), residual volume (RV), inspiratory resistance (Rin), expiratory resistance (Rex) and total resistance (Rtot) were recorded. Using single breath helium dilution with CO-diffusion test, diffusing capacity (DLCO) and alveolar volume (VA) was measured, and DLCO/VA was calculated.
Statistics
Non-parametric tests were used overall since not all parameters showed significant normal distribution. Mann–Whitney non-parametric test was used for comparison between two separate groups. Kruskal–Wallis non-parametric test was used for analyses between several groups, and, if significant, followed by Dunn’s multiple comparison test. Correlations were sought using Spearman’s correlation test. Binary logistic regression analyses were performed to adjust the temperatures for lung function parameters. Statistical analyses were performed using Graph Pad Prism 5 and a p-value <0.05 was considered significant. All data are presented as median (interquartile range).
Results
EBT values
The temperature values acquired from the FracTAir device are displayed in (a-e). A significant overall group difference was seen among the groups in both Tmax (p = 0.033; )) and T3 max (p = 0.033; )). There were also significantly lower levels of the T3/T1 ratio ()) in patients with COPD (p = 0.036) or SSc (p = 0.018) compared to asthmatics, who in turn presented similar levels as the controls ()).
Figure 2. Temperature values in controls, asthma, COPD and SSc patients, showing Tmin (a), T1max (b), Tmax (c), T3max (d) and the T3/T1 ratio (e). * = p < 0.05, – (– -) = overall significance between groups after Kruskal–Wallis test and between asthmatics and COPD patients using a subsequent Dunn’s post hoc test; solid line (─ ) = significance between specific groups after Mann–Whitney test
Correlations to temperature values
Almost all temperature values correlated significantly to each other (except for Tmax and T3max in relation to the T3/T1 ratio).
Tmin did not correlate to any lung function parameters.
T1max correlated to FEV1 (r = 0.35, p = 0.0047), FVC (r = 0.43, p = 0.0004), TLC (r = 0.34, p = 0.0062), VC (r = 0.41, p = 0.0007), IC (r = 0.34, p = 0.0074), DLCO (r = 0.27, p = 0.033) and VA (r = 0.39, p = 0.0016). The T1max values did not correlate to any of the %p values.
Tmax correlated to several absolute values; FEV1 (r = 0.50, p < 0.0001), FVC (r = 0.48, p < 0.0001), TLC (r = 0.32, p = 0.0095), VC (r = 0.47, p < 0.0001), air trapping index RV/TLC (r = −0.33, p = 0.0078), IC (r = 0.41, p = 0.0008), Rex (r = −0.38, p = 0.0026), DLCO (r = 0.50, p < 0.0001), VA (r = 0.47, p = 0.0001), and DLCO/VA (r = 0.47, p = 0.0001). The Tmax values only correlated to some of the %p values, i.e. DLCO%p (r = 0.35, p = 0.0053), VA%p (r = 0.26, p = 0.037) and DLCO/VA%p (r = 0.38, p = 0.0022).
T3max also correlated to several absolute values; FEV1 (r = 0.50, p < 0.0001), FVC (r = 0.59, p < 0.0001), TLC (r = 0.46, p = 0.0002), VC (r = 0.57, p < 0.0001), RV/TLC (r = −0.30, p = 0.016), IC (r = 0.52, p < 0.0001), DLCO (r = 0.52, p < 0.0001), VA (r = 0.55, p < 0.0001) and DLCO/VA (r = 0.38, p = 0.0023)()). The T3max values only correlated to some of the %p values, i.e. DLCO%p (r = 0.30, p = 0.016), VA%p (r = 0.27, p = 0.034) and DLCO/VA%p (r = 0.27, p = 0.030) ()).
Figure 3. Correlations between T3max and different lung function parameters; FEV1 (a), FVC (b), DLCO (c), DLCO%p (d), VA%p (e) and DLCO/VA%p (f) in all subjects
The correlations to the T3/T1 ratio were first investigated within the control group only. The T3/T1 ratio then correlated to several lung volume and diffusion capacity values; FVC (r = 0.62, p = 0.022), TLC (r = 0.688, p = 0.007), VC (r = 0.60, p = 0.023), IC (r = 0.70, p = 0.005), VA (p = 0.62, p = 0.018). Also to some of the %p values, such as TLC%p (r = 0.65, p = 0.012), IC%p (r = 0.65, p = 0.012), DLCO%p (r = 0.60, p = 0.034), VA%p (r = 0.60, p = 0.024).
A similar correlation pattern was seen among all subjects, since the T3/T1 ratio then correlated to; FEV1 (r = 0.36, p = 0.0035), FVC (r = 0.37, p = 0.0027), VC (r = 0.37, p = 0.0032), IC (r = 0.36, p = 0.0041), R20 (r = 0.34, p = 0.0071), DLCO (r = 0.45, p = 0.0002), VA (p = 0.37, p = 0.0032), and DLCO/VA (r = 0.32, p = 0.0094) ()). The T3/T1 ratio correlated to some of the %p values, such as FVC%p (r = 0.27, p = 0.030), IC%p (r = 0.35, p = 0.0058), R20%p (r = 0.37, p = 0.0035), DLCO%p (r = 0.39, p = 0.0014), VA%p (r = 0.42, p = 0.0007), and DLCO/VA%p (r = 0.27, p = 0.035) ()).
Figure 4. Correlations between the T3/T1 ratio and different lung function parameters; FEV1 (a), FVC (b), DLCO (c), DLCO%p (d), VA%p (e) and DLCO/VA%p (f) in all subjects
None of the temperature values correlated to any of the exhaled NO parameters.
Adjustment of T1/T3 for potential confounders
After adjusting for FEV1, DLCO and DLCO%p, the difference in T1/T3 between asthmatics and COPD patients was no longer significant (p = 0.57, p = 0.29 and p = 0.28), but showed a tendency of remaining significant after adjustment for FVC and TLC (p = 0.095 and p = 0.076).
Similarly, the difference between asthmatics and SSc patients was abolished after adjusting for FEV1, FVC, TLC and DLCO (p = 0.14, p = 0.28, p = 0.15 and p = 0.27), but showed a tendency of remaining significant after adjustment for DLCO%p (p = 0.086).
Discussion
This is the first study using a device that measures the temperature of fractions of the exhaled breath. We could hereby measure the temperature from the peripheral airways in relation to the central and found that the relative temperature in the peripheral airways was lower in patients with COPD or SSc compared to asthmatics, who in turn presented similar levels as the controls. Overall, the temperatures measured from both central and peripheral airways were dependent on the absolute lung volume, but specifically, the peripheral temperature was related to gas diffusion capacity also as %p, suggesting a link to the vascular component.
Most of the temperature values, such as Tmax, T1max, T3max, and the T3/T1 ratio, showed significant correlations with several volumetric parameters, such as FEV1, FVC, VC and TLC, but not to the corresponding %p values. A prolonged exhalation provides a longer time over which the temperature sensors are heated, and thus they reach higher temperatures during the single breath. In fact, neither T1max nor T3max displayed plateau values during any single breath (data not shown), which is evidence for the relationship between the temperature values and absolute lung volumes. It is likely that with increasing of the exhaled volume, the measured values are brought closer to their plateau values. A quicker sensor could maybe reach the plateau earlier. The T3-fraction consistently measures higher maximum levels than the T1-fraction ()), suggesting that the T3-fraction would keep increasing with higher peripheral-exhaled volumes, possibly also affecting the T3/T1 ratio. In addition, the last fraction contains air that has been exposed to more airway surface than the first fraction, which probably also affects T3. The FracTAir device allows adjustment of the slicing of the stream of exhaled air into different proportions. Thus, using a different division of the exhaled volume of air (e.g. 10%:20%:70%) would yield another volumetric relationship between central and peripheral airways.
Being the parameter of greatest interest in this study, the T3/T1 ratio displayed lower levels of the T3/T1 ratio in patients with COPD or SSc compared to asthmatics, who in turn presented similar levels as the controls ()). This is in accordance with the higher blood flow in asthmatics, which overall is shown to be related to an increase in exhaled breath temperatures [Citation12]. The lower levels of the T3/T1 ratio in COPD may be due to a decreased ability in COPD patients to effectively warm inhaled air in the alveolar compartments. COPD patients suffering from emphysema have increased alveolar membrane thickness, destruction of endothelial cells and a diminishing number of alveolar capillaries. This would reduce their ability to effectively warm-up inhaled air, and in turn, lower the T3/T1 ratio. Similarly, the SSc patients have impaired vascularization systemically. This is most probably present also in the lungs, and give rise to a reduced ability to warm up the air in the alveolar compartment. This lowers the measured temperature values, and specifically the T3/T1 ratio. However, there is a major overlap between the different groups, and the clinical usefulness is currently limited.
Similarly, there was an overall group difference among the groups in both Tmax and T3 max probably driven by the lower levels in patients with COPD or SSc.
A method often used to reflect vascularization in the lung is DLCO. This parameter differs according to the overall physiological lung status and is likely to affect the outcome of the temperature measurements. Accordingly, our finding of lower relative temperature in the peripheral lung compartment (measured as the T3/T1 ratio) is supported by significantly lower levels of DLCO%p in both COPD and SSc patients compared to controls (both are p < 0.001) and asthmatics (p = 0.002 and p = 0.014, respectively). Both Tmax and T3max correlated to not only DLCO but also DLCO%p; however, only moderately, and this correlation was stronger for the T3/T1 ratio. This suggests that the individual vascular construction has an impact on the temperature of the air exhaled from the peripheral parts of the lungs. An endothelial dysfunction has previously been shown in both asthma and COPD [Citation31], and may also be an important component in the differential exhaled air temperatures.
Another interesting positive relationship was found between the T3/T1 ratio and R20 measured by IOS. Since the R20 values represent central resistance in the airways, and the T3/T1 ratio represents the percent of the relative difference between the first and third exhaled fractions (i.e. how much warmer the peripheral-exhaled air is compared to the centrally derived air), this may suggest either that an increased central resistance raises peripheral temperature, or that an increased central resistance lowers central temperature. One explanation could be that an increased central resistance reflects increased central inflammatory engagement with subsequent mucus production, decreasing temperature communication between the blood of the central airways and ventilated air, thus giving rise to a decrease in measured central temperature. However, neither T1max nor T3max displays significant correlation separately with any airway resistance measurement, which may mean that both central and peripheral airways are involved in the increased T3/T1 ratio in these patients.
Our hypothesis was that an increased temperature in the airways, originating due to inflammation, would correlate with increased NO levels, similar to what has been demonstrated previously in the airway as a whole [Citation32]. However, we were not able to find any significant correlation between alveolar NO or any of the other NO measurements. We did not find any difference in NO between the groups, which contrasts with previous studies [Citation20,Citation21]. Apart from a technical explanation (the measured fractional components of NO and EBT in the airways may not be the same), this could be also due to the fact that many of the patients, both asthmatics, COPD and SSc patients were on inhaled or oral corticosteroids, which might decrease the levels of exhaled NO [Citation33]. In addition, it has been shown that ICS treatment can restore endothelial-mediated vasodilation in the airway of subjects with asthma or COPD [Citation31], which may also affect the exhaled breath temperatures. Steroid-naïve patients would be interesting to investigate instead, but are difficult to find.
Conclusion
This is the first study measuring the temperature of fractions of the exhaled breath. We found that the relative temperature in the peripheral airways was lower in patients with COPD or SSc compared to asthmatics, who in turn presented similar levels as the controls. In general, the temperatures measured from both central and peripheral airways were dependent on the absolute lung volume, but specifically, the temperature of the air from the peripheral fraction was related to gas diffusion capacity, also as %p, suggesting its association to the vascular component.
Acknowledgments
This work was supported by independent research grants from the Swedish Heart and Lung foundation, Swedish Research Council, Evy and Gunnar Sandberg’s Foundation, Crafoord Foundation, Alfred Österlund Foundation and Royal Physiographic Society in Lund. The construction of the FracTAir device was made possible by a research grant from Chiesi Pharma.
Disclosure statement
No potential conflict of interest was reported by the authors.
References
- van der Wiel E, Ten Hacken NH, Postma DS. van den Berge M. Small-airways dysfunction associates with respiratory symptoms and clinical features of asthma: a systematic review. J Allergy Clin Immunol. 2013;131(3):646–9.
- Park HS, Kim SY, Kim SR, et al. Targeting abnormal airway vascularity as a therapeutical strategy in asthma. Respirology. 2010;15(3):459–471.
- Ribatti D, Puxeddu I, Crivellato E, et al. Angiogenesis in asthma. Clinical and Experimental Allergy: Journal of the British Society for Allergy and Clinical Immunology. 2009;39(12):1815–1821.
- Baraldo S, Turato G, Saetta M. Pathophysiology of the small airways in chronic obstructive pulmonary disease. Respiration. 2012;84(2):89–97.
- Wells AU. Interstitial lung disease in systemic sclerosis. Presse Med. 2014;43(10 Pt 2):e329–43.
- Desbois AC, Cacoub P Systemic sclerosis: an update in 2016. Autoimmunity reviews. 2016.
- Popov TA, Kralimarkova TZ, Dimitrov VD. Measurement of exhaled breath temperature in science and clinical practice. Breathe. 2012;8(3):187–192.
- Popov TA, Kralimarkova TZ, Tzachev CT, et al. Development of an individual device for exhaled breath temperature measurement. IEEE Sens J. 2010;10(1):110–113.
- Garcia G, Bergna M, Uribe E, et al. Increased exhaled breath temperature in subjects with uncontrolled asthma. Int J Tuberculosis Lung Dis. 2013;17(7):969–972.
- Leonardi S, Cuppari C, Lanzafame A, et al. Exhaled breath temperature in asthmatic children. J Biol Regul Homeost Agents. 2015;29(2 Suppl 1):47–54.
- Melo RE, Popov TA, Sole D. Exhaled breath temperature, a new biomarker in asthma control: a pilot study. J Bras Pneumol. 2010;36(6):693–699.
- Paredi P, Kharitonov SA, Barnes PJ. Correlation of exhaled breath temperature with bronchial blood flow in asthma. Respir Res. 2005;6:15.
- Lazar Z, Bikov A, Martinovszky F, et al. Exhaled breath temperature in patients with stable and exacerbated COPD. J Breath Res. 2014;8(4):046002.
- Crespo Lessmann A, Giner J, Torrego A, et al. Usefulness of the exhaled breath temperature plateau in asthma patients. Respiration. 2015;90(2):111–117. .
- Hamill L, Ferris K, Kapande K, et al. Exhaled breath temperature measurement and asthma control in children prescribed inhaled corticosteroids: A cross sectional study. Pediatr Pulmonol. 2016;51(1):13–21. .
- Scichilone N, Contoli M, Paleari D, et al. Assessing and accessing the small airways; implications for asthma management. Pulm Pharmacol Ther. 2013;26(2):172–179. .
- Alving K, Weitzberg E, Lundberg JM. Increased amount of nitric oxide in exhaled air of asthmatics. Eur Respir J. 1993;6(9):1368–1370.
- Tsoukias NM, George SC. A two-compartment model of pulmonary nitric oxide exchange dynamics. J Appl Physiol. 1998;85(2):653–666.
- Tufvesson E, Aronsson D, Ankerst J, et al. Peripheral nitric oxide is increased in rhinitic patients with asthma compared to bronchial hyperresponsiveness. Respir Med. 2007;101(11):2321–2326.
- Brindicci C, Ito K, Resta O, et al. Exhaled nitric oxide from lung periphery is increased in COPD. Eur Respir J. 2005;26(1):52–59.
- Wuttge DM, Bozovic G, Hesselstrand R, et al. Increased alveolar nitric oxide in early systemic sclerosis. Clin Exp Rheumatol. 2010;28(5 Suppl 62):S5–S9.
- Global Initiative for Asthma. Global Strategy for asthma management and prevention, http://www.ginasthma.org2016.
- Vestbo J, Hurd SS, Agusti AG, et al. Global strategy for the diagnosis, management, and prevention of chronic obstructive pulmonary disease: GOLD executive summary. Am J Respir Crit Care Med. 2013;187(4):347–365. .
- van den Hoogen F, Khanna D, Fransen J, et al. classification criteria for systemic sclerosis: an American College of Rheumatology/European League against Rheumatism collaborative initiative. Arthritis Rheumatism. 2013;65(11):2737–2747. .
- Miller MR, Hankinson J, Brusasco V, et al. Standardisation of spirometry. Eur Respir J. 2005;26(2):319–338. .
- Wanger J, Clausen JL, Coates A, et al. Standardisation of the measurement of lung volumes. Eur Respir J. 2005;26(3):511–522. .
- Macintyre N, Crapo RO, Viegi G, et al. Standardisation of the single-breath determination of carbon monoxide uptake in the lung. Eur Respir J. 2005;26(4):720–735. .
- Crapo RO, Morris AH, Gardner RM. Reference spirometric values using techniques and equipment that meet ATS recommendations. Am Rev Respir Dis. 1981;123(6):659–664.
- Quanjer PH, Tammeling GJ, Cotes JE, et al. Lung volumes and forced ventilatory flows. Report Working Party Standardization of Lung Function Tests, European Community for Steel and Coal. Official Statement of the European Respiratory Society. The European respiratory journal Supplement. 1993;16:5–40.
- S. V. Implementation der Sollwertgleichungen für IOS. Impuls-Oszillometrie. pmi-Verlag. 1994:S:148–52.
- Wanner A, Mendes ES. Airway endothelial dysfunction in asthma and chronic obstructive pulmonary disease: a challenge for future research. Am J Respir Crit Care Med. 2010;182(11):1344–1351.
- Piacentini GL, Peroni D, Crestani E, et al. Exhaled air temperature in asthma: methods and relationship with markers of disease. Clinical and Experimental Allergy: Journal of the British Society for Allergy and Clinical Immunology. 2007;37(3):415–419. .
- Saleh D, Ernst P, Lim S, et al. Increased formation of the potent oxidant peroxynitrite in the airways of asthmatic patients is associated with induction of nitric oxide synthase: effect of inhaled glucocorticoid. Faseb J. 1998;12(11):929–937.