
ABSTRACT
Asthma is a heterogenous disease characterized by airway inflammation and variable expiratory airflow limitation resulting in variable respiratory symptoms. Characterization of airway inflammation is important to choose the optimal treatment for severe asthma patients eligible for biological treatment. However, counting cells in induced sputum samples are a time-consuming process, highly dependent on personal skills. Replacing eosinophil and neutrophil cell counting with qPCR for transcripts of selected mast cell, and basophil genes may provide more reproducible results.
Aims
The objective of this study was to compare qPCR with microscopy in asthma endotyping.
Methods
A qPCR method measuring five mast cell/basophil genes was applied on induced sputum samples from 30 severe asthma patients and compared with microscopy. Target gene Ct-values (CPA3, GATA2, HDC, MS4A2, TPSAB1/TPSB2) were referenced to household β-actin Ct values as a measure of relative mRNA abundance of the target in each sample. Target/β-actin-ratios in eosinophilic and non-eosinophilic groups determined by microscopy with an eosinophil threshold of 3% in 400 cells were compared using Mann–Whitney U Test. Spearman´s correlations were used to test for correlation between targets vs. FENO and targets vs. blood eosinophil counts.
Results
The study demonstrated a statistical difference in relative mRNA abundance for four mast cell/basophil specific genes. CPA3, GATA2, HDC and MS4A2 were elevated in eosinophilic asthma versus non-eosinophilic asthma patients. The study found that GATA2, CPA3, MS4A2 and TPSAB1/TPSB2 transcripts are positively correlated with FENO. Neither the five mast cell genes nor the five-gene signature correlated with blood eosinophils. The five-gene signature with a target/β-actin-ratio cut-off ≥2 generated sensitivity = 87%, specificity = 94%, NPV = 88% and PPV = 92% compared to microscopy.
Conclusion
This study confirms the contribution of mast cells in the pathogenesis of EA and suggests that mast cell mRNA markers could be one of the biomarkers used to identify EA
Introduction
Asthma rates as the second most prevalent global chronic respiratory disease [Citation1,Citation2] and this high disease burden of asthma remains a social and economic challenge for national health-care services [Citation3]. Asthma is a highly heterogenous disease due to the vastly complex pathogenesis that differs significantly from patient to patient. The pathogenesis is characterized by an ongoing imbalance between respiratory smooth muscle cells, airway epithelium, external triggers, e.g. allergens, and lastly the inflammatory environment, i.e., immune cells, antibodies, and cytokine milieu [Citation4]. Asthma phenotype relates to clinical features of the disease, while asthma endotype relates to the inflammatory environment of the airways. Asthma can be categorised into different patterns of inflammation, namely eosinophilic, neutrophilic, mixed, and paucigranulocytic, often dichotomised into Type 2 or eosinophilic asthma (EA) and Non-type 2 or non-eosinophilic asthma (NEA) [Citation5]. The characterisation of the asthma endotype has become more relevant to determine as biologic agents have emerged in asthma treatment [Citation6,Citation7] targeting specific patterns of inflammation that are associated with a type 2 phenotype. Assessing differentially expressed transcripts in induced sputum from controls and patients with asthma has identified transcripts expressed selectively in mast cell and basophil granulocytes. Characterisation of these transcripts in induced sputum has been shown to be of clinical relevance [Citation8–12]. MC-related mRNA expression in IS of the transcription factor GATA binding protein 2 (GATA2) tha controls much of mast cell differentiation [Citation13], carboxypeptidase A3 (CPA3), tryptase α/β-1/tryptase β2 (TPSAB1/TPSB2), membrane-spanning 4A2 (MS4A2, FceRIb), and histidine decarboxylase (HDC) have been linked to several clinical parameters such as elevated sputum eosinophils, elevated fraction of exhaled nitric oxide (FeNO), poor asthma control, EA vs. NEA classification, and response to inhaled corticosteroid (ICS) treatment [Citation14–17]. The main objective of this study is to investigate the asthma endotype using a five-gene mast cell (MC) signature [Citation8,Citation11] in induced sputum by quantitative polymerase chain reaction (qPCR) and compare with the conventional microscopic assessment of IS from 30 patients with severe asthma.
Methods
The IS samples were collected at the Asthma and Allergy centre at Aarhus University Hospital in Denmark from patients (n = 30) with severe difficult-to-treat asthma defined as Global Initiative for Asthma (GINA) step 4 and 5 [Citation2]. GINA step 4 and 5 treatments are characterised by medium or high dose ICS and a secondary controller [Citation2]. Patient’s ICS doses were converted to beclomethasone (standard particle) equivalents [Citation18,Citation19]. Patients were eligible if they were not in current oral corticosteroid treatment nor having a respiratory infection within 3 weeks prior to sputum collection. Samples were collected according to international guidelines [Citation20]. Samples with total squamous cell count of 50% or more were excluded. Approximately half of each sample were stabilised with RNA-protect and they were stored at −80°C. The other half was used for routine May Grünwald Giemsa staining. An IS sample was considered eosinophilic if the eosinophil count was ≥3%. FeNO and blood eosinophil concentrations were collected as close as possible (<3 months before) to the time of IS sampling.
Samples containing RNA-protect were purified and transcribed to cDNA before qPCR analysis using the iScript cDNA synthesis kit according to the suppliers’ instructions (BioRad). In the qPCR analysis cDNA was mixed with forward and reverse primers as well as a fluorescently labeled probe (ThermoFischer Scientific). Annealing temperature for all specific targets (CPA3, GATA-2, HDC, TPSAB1/TPSB2, MS4A1) and the house keeping gene β-actin was 60°C. The qPCR reaction was conducted with the TaqMan UniversalMastermix II, no UNG kit (Roche). Reactions were performed using a Lightcycler 480 II PCR instrument (Roche). To normalize for different reaction efficiencies, a standard curve was produced for each target cDNA by serial dilutions of samples with high expression of the particular mRNA target. The samples with the highest concentration for each target (lowest Ct-value) were selected to generate the standard curve for each target.
Statistical analyses were performed in R studio software V4.0.3. The target/β-actin ratio was calculated for each sample by comparing target Ct with standard curve normalised to β-actin. Thus, these target/β-actin ratios are a measure of the MC target mRNA expression in relative amounts. The statistical test used was the Mann Whitney U Test. Spearman´s correlations were used to test for correlation between targets vs. FeNO and targets vs. blood eosinophil counts. As some samples contained quite large relative mRNA amounts, and some samples had no MC/basophil mRNA detected at all, a data conversion was used for a better graphical representation. Target/b-actin ratios were converted as follows: Log(value +1). This legitimate conversion ensured more readable graphs. Only the original non-converted values were used for statistical analyses. Graphical representations were performed in R studio and GraphPad prism.
Results
showing study population demographics. Fourteen patients were classified as EA patients and 16 patients were classified as NEA patients with conventional microscopy. For CPA3 (p=0.004), GATA2 (p=0.001), HDC (p=0.005) and MS4A2 (p=0.007) we found a statistical difference in the median relative of mRNA expression between EA vs. NEA. No statistical difference between the median ratio was found for TPSAB1/TPSB2 (p=0.13) ().
Figure 1. Plots showing the median target/β-actin-ratio visualised on a logarithmic conversion on the Y-axis in each group on the X-axis. Mann-Whitney U test performed for each target under the null hypothesis that the observations in each group come from the same population. CPA3: carboxypeptidase A3. EA: eosinophilic asthma. GATA2: GATA binding protein 2. HDC: histidine decarboxylase. MS4A2: membranes spanning 4A2. NEA: Non-eosinophilic asthma. TPSAB1/TPSB2: tryptase α/β-1/Tryptase β2.
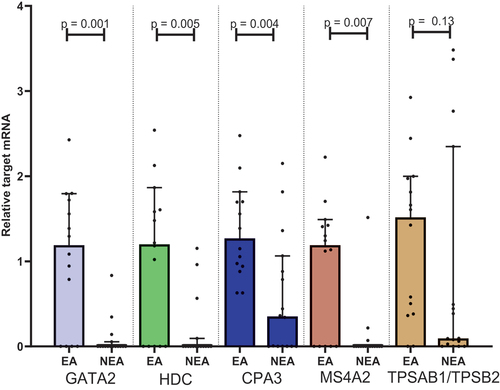
Table 1. Demographics from the EA and NEA patients. Values shown as mean ± Standard deviation. Sex and smoking are shown as proportions. BMI: Body mass index. EA: Eosinophilic asthma. NEA: Non-eosinophilic asthma. FEV1: Forced expiratory volume in 1 sec. FVC: Functional vital capacity. ICS: inhaled corticosteroid. Ppb: parts per billion. FENO: Fraction of Exhaled Nitric Oxide. *P<0.05. §ICS dose in beclomethasone (standard particle) equivalent. ΔData only available for 10 EA patients and 13 NEA patients. ◊Data only available for 11 EA patients and 11 NEA patients.
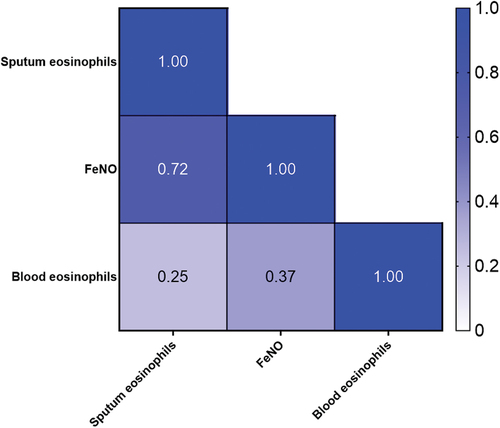
In , a heat map from Spearman correlations shows correlation between sputum, FeNO and blood eosinophils. In our population of 22 patients (11 EA patients and 11 NEA patients), a statistical significant positive correlation was found between sputum eosinophils and FeNO. Blood eosinophils did not correlate significantly with neither sputum eosinophils (r = 0.25. 95% CI (−0.21–0.61, p = 0.27)) nor FeNO (r = 0.37. 95% CI (−0.07–0.69, p = 0.09)).
Figure 2. Spearman correlation heat map with correlation coefficients. FENO: fraction of Exhaled Nitric Oxide.
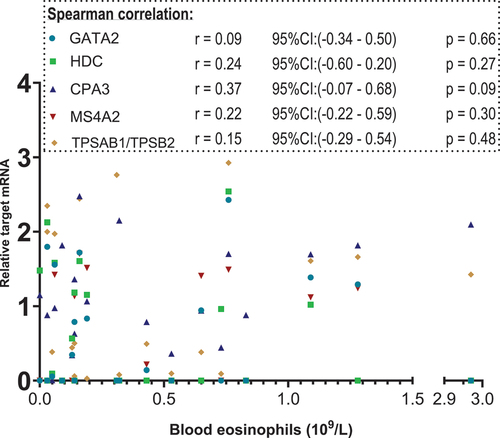
are scatterplot that visualise relative target mRNA agreement against FeNO and blood eosinophils, respectively. Spearman’s test with r-values for correlation between the XY-variables shows moderate, yet statistically significant positive correlations (p < 0.05) of GATA2, CPA3, MS4A2 and TPSAB1/TPSB2 with FENO. The blood eosinophil count did not correlate with these targets ()
Figure 3. Scatterplot. X-axis: FeNO values in parts per billion(ppb), segmented axis. Y-axis: relative target mRNA on a logarithmic conversion. Spearman’s rank correlation coefficient (r) with 95% confidence intervals and p values. Only data from 22 patients. *p < 0.05. CPA3: carboxypeptidase A3. GATA2: GATA binding protein 2. HDC: histidine decarboxylase. MS4A2: membrane spanning 4A2. TPSAB1/TPSB2: tryptase α/β-1/Tryptase β2. FENO: fraction of Exhaled Nitric Oxide. mRNA: messenger ribonucleic acid.
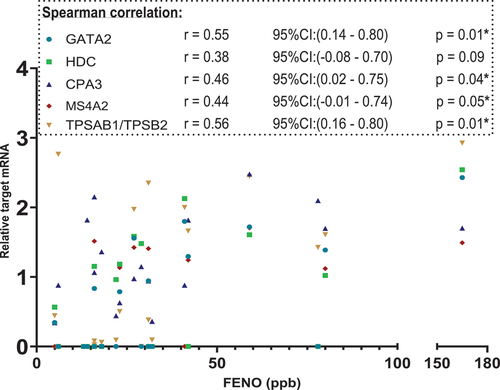
Figure 4. Scatterplot. X-axis: blood eosinophil values in 109/L, segmented axis. Y-axis: relative target mRNA on a logarithmic conversion. Spearman’s rank correlation coefficient (r) with 95% confidence intervals and p values. Only data from 23 patients. *p < 0.05. CPA3: carboxypeptidase A3. GATA2: GATA binding protein 2. HDC: histidine decarboxylase. MS4A2: membrane spanning 4A2. TPSAB1/TPSB2: tryptase α/β-1/Tryptase β2. mRNA: messenger ribonucleic acid.
Next, cut-off ratios for each target were calculated as the ratio of the target to β-actin. The individual diagnostic performance for each target was evaluated with receiver operating characteristic (ROC) curves and compared with area under the curve (AUC). From the ROC curves, the best cut-off value for each target could be determined, thereby increasing the diagnostic performance for each target. ROC-curves are shown in . From ROC-curves, the cut-off value for each of the target yielding the greatest diagnostic ability could be determined. Cut-off values were different from target to target which are shown in .
Figure 5. ROC curves for each target along with AUC displaying diagnostic ability. Y-axis: sensitivity X-axis: 1 – specificity. CPA3: carboxypeptidase A3. GATA2: GATA binding protein 2. HDC: histidine decarboxylase. MS4A2: membranes spanning 4A2. TPSAB1/TPSB2: tryptase α/β-1/Tryptase β2. mRNA: messenger ribonucleic acid.
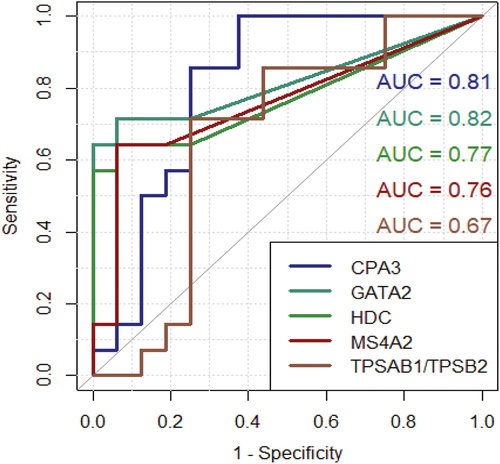
Table 2. Best cut-off value represented for each target. CPA3: Carboxypeptidase A3. GATA2: GATA binding protein 2. HDC: Histidine decarboxylase. MS4A2: Membranes spanning 4A2. TPSAB1/TPSB2: Tryptase α/β-1/Tryptase β2. mRNA: messenger ribonucleic acid.
Moving forward with the best performing ratio (target/β-actin ratio) for each target, additional ROC curves were made which combines four and five of the targets, respectively.
shows that the diagnostic performance is slightly increased by including TPSAB1/TPSB2. A final 2 × 2 contingency table was created, where patients were classified with qPCR using a cut-off of ≥2 out of five targets positive, meaning that the target exceeded the individual target cut-off value listed in . From this, 2 × 2 contingency table sensitivity, specificity, positive predictive value (PPV) and negative predictive value (NPV) were calculated. As seen in , only one NEA patient was incorrectly classified as an EA patient and only two EA patients were incorrectly classified as NEA patients. Using this five-gene MC/basophil signature with the mentioned cut-off, this qPCR method could classify 87% of EA patients and 94% of NEA patients correctly. More important in clinical practice are the PPV and NPV values. Ninety-two per cent patients with a positive test had EA, and 88% of patients with a negative test had NEA.
Figure 6. Green curve: ROC curve using CPA3, GATA2, MS4A2 and HDC. Red curve: ROC curve using CPA3, GATA2, MS4A2, HDC and TPSAB1/TPSB2. Y-axis: sensitivity. X-axis: 1 – specificity.
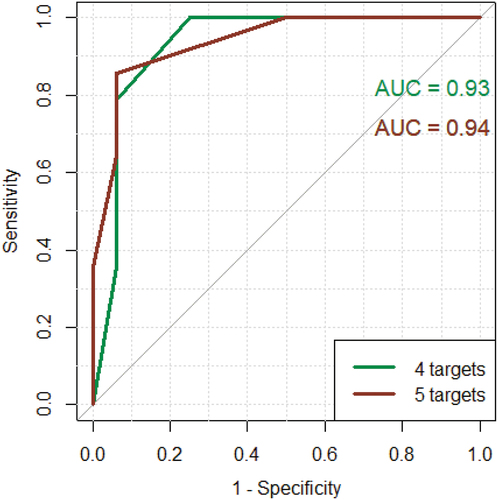
Table 3. qPCR’s ability to classify patients with EA and NEA by using ≥2 out of 5 targets Sensitivity, specificity, PPV and NPV were calculated. EA: Eosinophilic asthma. NEA: Non-eosinophilic asthma. NPV: Negative predictive value. qPCR: Quantitative polymerase chain reaction.
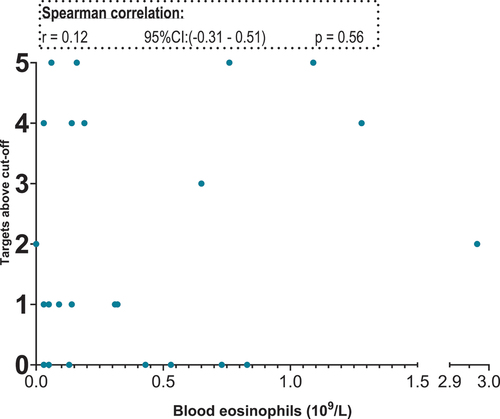
Next correlation between the five targets and sputum eosinophils, FeNO and blood eosinophils were carried out. The target ratio from the genes cannot be compared to one another due to the difference sample strength. Therefore, we used the cut-off ratios listed in and assigned each patient with a number. The number corresponds to the number of targets exceeding the individual cut-off value for that target. For sputum eosinophils both four (excluding TPSAB1/TPSB2) and all five targets were investigated. We found a positive correlation between the number of targets positive and the sputum eosinophil percentage. Using both four and five targets a statistically significant positive correlation was found: four targets r = 0,73 and five targets r = 0,72. Only data from using four targets (GATA2, CPA3, HDC and MS4A2) are shown in . In the FENO analysis, a positive correlation was found for both four targets (excluding HDC) and five targets (four targets r = 0,70 and five targets r = 0,66). Data from the four targets (GATA2, CPA3, MS4A2 TPSAB1/TPSB2) and correlation analysis with FeNO are shown in . No correlation between the five-gene signature and blood eosinophils were found ().
Figure 7. Scatter plot. X-axis: sputum eosinophils in percentage. Y-axis: targets above cut-off. Targets included: GATA2, HDC, MS4A2 and CPA3.
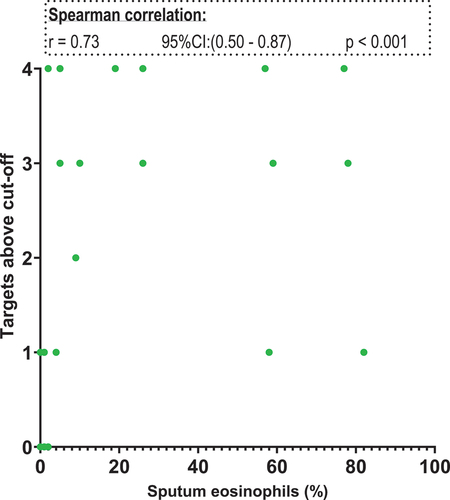
Figure 8. Scatter plot. X-axis: fraction of Exhaled Nitric Oxide in parts per billion, segmented axis. Y-axis: targets above cut-off. Targets included: GATA2, CPA3, MS4A2 and TPSAB1/TPSB2.
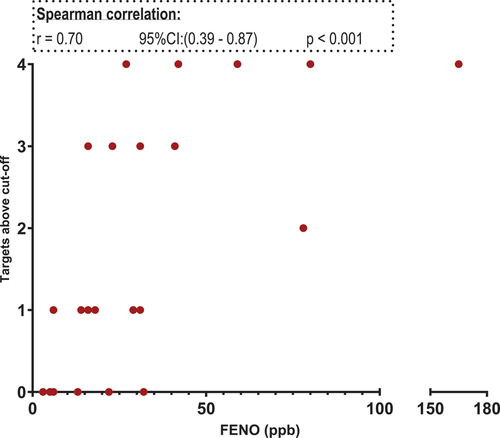
Figure 9. : scatter plot. X-axis: blood eosinophils in 109/L, segmented axis. Y-axis: targets above cut-off. Targets included: GATA2, CPA3, HDC MS4A2 and TPSAB1/TPSB2.
Discussion
This study found statistically significant differences in relative mRNA of four target genes: CPA3, GATA2, MS4A2 and HDC in type 2 EA patients vs. NEA patients. TPSAB1/TPSB2 did not reach a statistical difference between EA and NEA. Setting an individual cut-off ratio value markedly increased the target’s ability to classify EA and NEA patients correctly. The genes have been verified in other studies as MC/basophils genes that correlate with eosinophilic airway inflammation [Citation8–12]. This study demonstrates how an MC/basophil gene panel could be designed with cut-off values to distinguish EA from NEA. Furthermore, the study finds a positive correlation between FeNO and GATA2, CPA3, MS4A2 and TPSAB1/TPSB2, but no correlation with HDC. No correlations were found between the MC/basophil genes and blood eosinophil concentrations. Similar correlations have been found in other qPCR studies, whereas our study was not able to reproduce some correlations found in other studies [Citation8], e.g., blood eosinophils correlation with GATA2, CPA3, HDC and TPSAB1/TPSB2. The present data suggest that MCs are contributors to the pathogenesis of eosinophilic inflammation of asthma.
GATA 2 is a zinc finger transcription factor expressed in early progenitors and directing differentiation of megakaryocytes and mast cells [Citation21]. Tryptase A and B and Carboxypeptidase 3 are proteases successively transcribed as mast cells mature in vitro [Citation22]. They are uniquely associated with mast cells and basophil granulocytes. CPA3 is more closely associated with severe asthma. Their role in asthma is not known. Histidine decarboxylase is the enzyme that converts histidine into the second messenger histamine and is the only source of histamine in eucaryotes [Citation23]. MS4A2 is a component of the high-affinity IgE receptor that is highly expressed on mast cells and basophil granulocytes [Citation24] and is required for degranulation through FceRI. CPA3, TPSAB1, TPSAB2, MS4A2 and HDC expression are regulated by GATA2 [Citation13].
The limitations of this study are the small sample size (N = 30) and the lack of a healthy control group. The chosen biomarkers were all MC/basophil bispecific [Citation8]; whereas other studies have included biomarkers of neutrophilic inflammation and eosinophilic inflammation as well [Citation9,Citation25].
In our study, the microscopic squamous cell count of IS samples determined sample quality. Only samples meeting the internationally recognised quality standards were used in the study. If a qPCR method was to replace microscopy entirely, such quality measures must be in place to ensure sample reliability. Thus, if a verified qPCR gene panel is developed, containing transcripts from several immune cells of the airways, i.e. eosinophils, MCs, neutrophils, etc.; a quality control panel must be developed as well to ensure samples originating from lower airways and to detect samples contaminated with cell containing secretions from the upper airways. Supposedly a verified squamous cell gene panel could be developed to solve this issue. It is, however, possible that given a strong and validated qPCR gene panel, that is highly sensitive in determining airway inflammatory phenotype regardless of sample contamination. In this case, it would revolutionise asthma endotyping. To validate our MC and future potential promising mRNA transcripts of bronchial biopsies should be used as a reference.
Great potential could be found in mRNA expression analysis as opposed to microscopy since individual biomarkers are linked to certain clinical characteristics (asthma phenotypes) and are predictors of severe asthma disease [Citation8,Citation10,Citation11,Citation15]. Other studies have found similar associations using other gene panels from MCs and neutrophils [Citation26]. IS sampling, handling and analyses remain time-consuming procedures for patients and hospital personnel. Therefore, the outcome must be of great value for both patients and physicians. When focussing on mRNA transcript analysis, the IS sample handling and analysis become less work intensive. Research involving mRNA transcripts suggests that MC/basophil transcripts can be one among many other markers such as markers of eosinophils and neutrophils that could decrease the diagnostic gap between asthma phenotype and endotype. Sputum qPCR analysis could serve as next IS sample analysis method since additional information about clinical features, treatment response and exacerbation risks can be obtained. It is feasible that this approach will transform asthma endotyping from being dichotomous to multifaceted, where asthma endotypes are more directly linked to the asthma phenotypes and potential specific targeted asthma treatment options of individual patients. Future research should address this and create the optimal gene panel for qPCR from which a correct diagnosis and valuable clinical information can be obtained.
Abbreviations
| AUC | = | Area under the curve |
| CPA3 | = | Carboxypeptidase 3 |
| Ct | = | Cycle Threshold |
| EA | = | Eosinophilic Asthma |
| FeNO | = | Fraction of Exhaled Nitric Oxide |
| FEV1 | = | Forced Expiratory Volume in 1 s |
| FVC | = | Forced Vital Capacity |
| GATA2 | = | GATA Binding Protein 2 |
| GINA | = | Global Initiative for Asthma |
| HDC | = | Histidine Decarboxylase |
| ICS | = | Inhaled Corticosteroid |
| IS | = | Induced Sputum |
| MC | = | Mast cell |
| mRNA | = | Messenger Ribonucleic Acid |
| MS4A2 | = | Membrane-spanning 4A2 |
| NEA | = | Non-Eosinophilic Asthma |
| NPV | = | Negative Predictive Value |
| Ppb | = | Parts per billion |
| PPV | = | Positive Predictive Value |
| qPCR | = | Quantitative Polymerase Chain Reaction |
| ROC | = | Receiver operating characteristic |
| TPSAB1/TPSB2 | = | Tryptase α/β-1/Tryptase β2 |
Acknowledgments
Special thanks to nurses at Asthma and allergy centre at Aarhus University Hospital in sputum collection. Special thanks to the department of clinical biochemistry at Aarhus University Hospital for their expertise in sample purification, qPCR analysis and data extraction.
Disclosure statement
No potential conflict of interest was reported by the author(s).
Additional information
Funding
References
- Soriano JB. Prevalence and attributable health burden of chronic respiratory diseases, 1990–2017: a systematic analysis for the Global Burden of Disease Study 2017. The Lan Respi Med. 2020;8(6):585–8.
- Asthma GIF. Global Initiative for asthma. Global Strategy Asthma Management Prevention. 2022;2022.
- Williams SA, Wagner S, Kannan H, et al. The association between asthma control and health care utilization, work productivity loss and Health-related quality of life. J Occup Environ Med. 2009;51(7):780–785. doi: 10.1097/JOM.0b013e3181abb019
- Barnes PJ. Cellular and molecular mechanisms of asthma and COPD. Clin Sci. 2017;131(13):1541–1558. doi: 10.1042/CS20160487
- Green RH, Brightling CE, McKenna S, et al. Asthma exacerbations and sputum eosinophil counts: a randomised controlled trial. Lancet. 2002;360(9347):1715–1721. doi: 10.1016/S0140-6736(02)11679-5
- Haldar P, Brightling CE, Hargadon B, et al. Mepolizumab and exacerbations of refractory eosinophilic asthma. N Engl J Med. 2009;360(10):973–984. doi: 10.1056/NEJMoa0808991
- Wenzel S, Ford L, Pearlman D, et al. Dupilumab in persistent asthma with elevated eosinophil levels. N Engl J Med. 2013;368(26):2455–2466. doi: 10.1056/NEJMoa1304048
- Winter NA, Qin L, Gibson PG, et al. Sputum mast cell/basophil gene expression relates to inflammatory and clinical features of severe asthma. J Allergy Clin Immunol. 2021;148(2):428–438. doi: 10.1016/j.jaci.2021.01.033
- Baines KJ, Simpson JL, Wood LG, et al. Sputum gene expression signature of 6 biomarkers discriminates asthma inflammatory phenotypes. J Allergy Clin Immunol. 2014;133(4):997–1007. doi: 10.1016/j.jaci.2013.12.1091
- Fricker M, Gibson PG, Powell H, et al. A sputum 6-gene signature predicts future exacerbations of poorly controlled asthma. J Allergy Clin Immunol. 2019;144(1):51–60.e11. doi: 10.1016/j.jaci.2018.12.1020
- Fricker M, Qin L, Niessen N, et al. Relationship of sputum mast cells with clinical and inflammatory characteristics of asthma. Clin Exp Allergy. 2020;50(6):696–707. doi: 10.1111/cea.13609
- Jiang J, Faiz A, Berg M, et al. Gene signatures from scRNA-seq accurately quantify mast cells in biopsies in asthma. Clin Exp Allergy. 2020;50(12):1428–1431. doi: 10.1111/cea.13732
- Li Y, Gao J, Kamran M, et al. GATA2 regulates mast cell identity and responsiveness to antigenic stimulation by promoting chromatin remodeling at super-enhancers. Nat Commun. 2021;12(1):494. doi: 10.1038/s41467-020-20766-0
- Dougherty RH, Sidhu SS, Raman K, et al. Accumulation of intraepithelial mast cells with a unique protease phenotype in T(H)2-high asthma. J Allergy Clin Immunol. 2010;125(5):1046–1053.e8. doi: 10.1016/j.jaci.2010.03.003
- Wang G, Baines KJ, Fu JJ, et al. Sputum mast cell subtypes relate to eosinophilia and corticosteroid response in asthma. Eur Respir J. 2016;47(4):1123–1133. doi: 10.1183/13993003.01098-2015
- Woodruff PG, Boushey HA, Dolganov GM, et al. Genome-wide profiling identifies epithelial cell genes associated with asthma and with treatment response to corticosteroids. Proc Natl Acad Sci U S A. 2007;104(40):15858–15863. doi: 10.1073/pnas.0707413104
- Kuo C-HS, Pavlidis S, Loza M, et al. T-helper cell type 2 (Th2) and non-Th2 molecular phenotypes of asthma using sputum transcriptomics in U-BIOPRED. Eur Respir J. 2017;49(2):1602135. doi: 10.1183/13993003.02135-2016
- Daley-Yates PT. Inhaled corticosteroids: potency, dose equivalence and therapeutic index. Br J Clin Pharmacol. 2015;80(3):372–380. doi: 10.1111/bcp.12637
- Raissy HH, Kelly HW, Harkins M, et al. Inhaled corticosteroids in lung diseases. Am J Respir Crit Care Med. 2013;187(8):798–803. doi: 10.1164/rccm.201210-1853PP
- Paggiaro PL, Holz O, Ind PW, et al. Sputum induction. Eur Respir J Suppl. 2002;37:3s–8s. doi: 10.1183/09031936.02.00000302
- Tsai FY, Orkin SH. Transcription factor GATA-2 is required for proliferation/survival of early hematopoietic cells and mast cell formation, but not for erythroid and myeloid terminal differentiation. Blood. 1997;89(10):3636–43. doi: 10.1182/blood.V89.10.3636
- Maaninka K, Lappalainen J, Kovanen PT. Human mast cells arise from a common circulating progenitor. J Allergy Clin Immunol. 2013;132(2):463–9.e3. doi: 10.1016/j.jaci.2013.02.011
- Hirasawa N. Expression of Histidine decarboxylase and its roles in inflammation. Int J Mol Sci. 2019;20(2):20. doi: 10.3390/ijms20020376
- Kraft S, Rana S, Jouvin M-H, et al. The Role of the FcεRI β-chain in allergic diseases. Int Arch Allergy Immunol. 2004;135(1):62–72. doi: 10.1159/000080231
- Rijavec M, Krumpestar T, Škrgat S, et al. T2-high asthma, classified by sputum mRNA expression of IL4, IL5, and IL13, is characterized by Eosinophilia and severe phenotype. Life (Basel). 2021;11(2):92. doi: 10.3390/life11020092
- Berthon BS, Gibson PG, Wood LG, et al. A sputum gene expression signature predicts oral corticosteroid response in asthma. Eur Respir J. 2017;49(6):1700180. doi: 10.1183/13993003.00180-2017