
 ?Mathematical formulae have been encoded as MathML and are displayed in this HTML version using MathJax in order to improve their display. Uncheck the box to turn MathJax off. This feature requires Javascript. Click on a formula to zoom.
Abstract
Research and experimental development (R&D) is an important driver of economic growth and productivity. Gross expenditure on domestic R&D (GERD) is a country’s total expenditure on R&D performed by all sectors of the economy. South Africa’s GERD as a percentage of its GDP (GERD/GDP) remains below government targets and has stagnated over the past decade, largely due to declining business sector R&D. This paper aims to identify the drivers of firm-level R&D intensity, defined as the firm’s R&D expenditure as a percentage of turnover. It is the first South African study to examine both micro- and macro-economic drivers of firm R&D, with a paucity of literature on this topic for middle-income countries. Using the South African National R&D Survey data, the study utilized the Generalized Method of Moments (GMM) model and found that public financial support for firms, smaller firm-size, firm-level collaboration, political stability, foreign direct investment, and public R&D investment are positively associated with firm R&D intensity. The results highlight the importance of public financial support for smaller firms and investments in higher education and research institutions in promoting firm-level R&D, thereby providing useful policy insights for boosting business sector and economy-wide R&D expenditure and reaching national GERD/GDP targets.
Introduction
The positive impact of research and experimental development (R&D) activities on economic growth and productivity has been postulated by many theoretical studies (Arrow Citation1962; Grossman and Helpman Citation1991; Howitt and Aghion Citation1998; Redding and Proudman Citation1998; Romer Citation1986) and supported by a wide range of empirical studies (Bravo-Ortega and Marin Citation2011; Cameron, Proudman, and Redding Citation2005; Chawla Citation2019; Coe, Helpmann, and Hoffmaister Citation2009; Kafouros Citation2005; O’Mahony and Vecchi Citation2009) at the firm, sectoral, and national levels. To help stimulate economic growth and improve firm productivity, it is imperative that policy-makers and the business community gain a thorough understanding of what drives R&D investment.
Over the past decade, South Africa has experienced weak productivity growth. For the most part, the country fell behind its BRICS partners – Brazil, Russia, India, and China – in terms of total factor productivity growth over the period 2001 to 2015 (Hess, Campos, and Moloi Citation2019). While South Africa is not like most member countries of the Organisation for Economic Co-operation and Development (OECD), the country has considerable scope for rapid growth through its own R&D and the absorption of external technology (World Bank Citation2017). Greater levels of business sector R&D are required to capture these opportunities.
Countries with a high R&D intensity (usually defined as the ratio of a firm’s R&D investment to its revenue) are generally found to have advanced technological innovation capabilities (Hsu, Lien, and Chen Citation2015; Savrul and Incekara Citation2015). Firms can benefit directly from their new or improved products and processes, enabling the expansion of their market share and profitability. Moreover, the development of technologies to revive low and medium technology sectors within developing countries is heavily dependent on, though not limited to, scientific knowledge. Firms can also learn and imitate external technological knowledge developed by other firms. This way, laggard firms, regions and countries can catch up, as they can use new technologies produced by technological leaders, without bearing the full costs and risks associated with developing this themselves. Samsung, LG and Huawei are examples of East Asian companies that have in the past benefited by following this path and from government policy that supports it (Miao et al. Citation2018).
A country’s R&D intensity, measured as its gross expenditure on R&D (GERD) expressed as a percentage of GDP, is a vital indicator of the level of investment in R&D activities across the economy. It is used with other indicators to evaluate the economy’s innovation capacity and performance, and to benchmark knowledge-based economies globally.
South Africa’s Ten-Year Innovation Plan of 2008 set a GERD/GDP target of 1.5% by 2030, later reinforced in the 2019 White Paper on Science, Technology and Innovation (DST Citation2019). However, GERD/GDP has remained below the desired national targets over the last decade and has recently begun to decline, falling from 0.76% in 2017/18 to 0.62% in 2019/20 (CeSTII Citation2021). This lack of growth has been driven primarily by a decline in business sector R&D (BERD)Footnote1 which, unlike other middle-income countries, is the largest contributor to overall GERD in South Africa. These trends have occurred alongside a stagnation in overall investment growth in South Africa over the last decade, including in the private sector (OECD Citation2020).
In most countries, government investment and its stimulation of investments into science, technology and innovation (STI) would be the primary focus of attempts to grow GERD/GDP. However, given that the largest contributor to GERD in South Africa has historically been the business sector, and because of the recent decline in BERD, it is imperative to understand what determines R&D performance at the firm level. This may help direct government interventions to stimulate R&D investments in the business sector and, in turn, help to raise overall GERD. Local government support for R&D is particularly important as foreign funding of R&D to the business sector has declined rapidly in recent years (CeSTII Citation2021).
Thus, it is important to understand the determinants of business R&D investment, for government, in its pursuit of growing overall GERD, as well as the business community, as firms strive to increase their productivity levels by increasing their technological capabilities through R&D.
To address this policy challenge, research needs to be conducted to address the question: What are the key determinants of business R&D expenditure? A search of the literature reveals that while firm determinants of R&D have been extensively studied in high-income economies, there is very limited literature for middle-income countries, particularly in Africa, such as South Africa. Therefore, it is important to investigate firm determinants of R&D in South Africa to obtain contextualized evidence to inform policy.
The study reported in this paper, assessed the micro- and macro-determinants of firm-level R&D intensity (defined as R&D expenditure as a share of turnover) in the South African business sector during 2008/09-2017/18, based on panel data from the South African National Research and Experimental Development Survey (R&D Survey). The Generalized Method of Moments (GMM) model is utilized to deal with the dynamic nature of the panel data, whereby cause and effect relationships between variables are generally dynamic over time.
The paper is organized as follows. We first explore the theoretical and empirical literature on determinants of R&D intensity, to inform the empirical model. Second, we explain the theoretical and conceptual underpinnings of the model. Third, we describe the empirical model adopted, which estimates the effects of several economic variables on firm-level R&D intensity, using the GMM model. Fourth, we describe the data, which cover the period 2008/09 to 2017/18. We combine firm level data from the R&D Survey with macro data from the World Bank, South African Reserve Bank and World Governance Index. Fifth, descriptive statistics and correlations of the variables used in the analysis are presented to situate the results of the modelling analysis. The results in the sixth section indicate that government financial support, smaller firms, collaboration, political stability, foreign direct investment (FDI), and public R&D investment all have a positive impact on firm R&D intensity. We then present the model diagnostics, which confirm the reliability of our results. Finally, we conclude and provide policy recommendations.
Determinants of R&D intensity
The objective of this study is to identify the key determinants of firm-level R&D investment, to help understand why there has been a slowdown in the business sector of the economy. The following two sub-sections provide a theoretical and empirical review of the factors that are expected to impact on firm R&D intensity. These include firm-level (micro) characteristics as well as country-level (macro) factors, respectively. This review is important to inform the empirical model that follows.
Micro-economic determinants of firm R&D intensity
There is a wealth of international literature that investigates the determinants of R&D intensity at the firm level. This type of analysis relies on suitable survey data at the firm level. While this type of data is plentiful in developed countries, it is scarcer in developing countries. In this section we review the determinants of firm level R&D intensity emphasized by theoretical and empirical literature primarily from developed countries. Later we focus on the emerging markets literature.
Firm R&D intensity is usually defined as the ratio between R&D expenditure and turnover (total sales). A wide range of determinants of R&D intensity are found in the literature. However, there is not always consistency in results across studies, which may in part be due to non-linearities. Becker (Citation2013) identifies five main categories of the determinants of firm R&D, which we discuss along with the related literature.
The first category is individual firm or industry characteristics such as a firm’s cash flow and sales. Most studies have found that a firm’s cash flow and sales tend to have positive effects on firm-level R&D intensity, for example Bloch (Citation2005) in Denmark and Bond, Harhoff, and Van Reenen (Citation2005) in Germany and Britain. However, the effects can vary according to firm characteristics and the external environment. For example, Brown, Fazzari, and Peterson (Citation2009) find that the effect of cash flow is only significant for young firms and not for more mature firms. Using a panel of Spanish manufacturing firms, Laborda, Salas-Fumás, and Suárez (Citation2020) show that the effect of cash flow on R&D investing has different signs depending on the phase of the business cycle. Specifically, cash flow is positively related to R&D expenditure when GDP growth is above a certain level, but there is a negative association when GDP growth is low or negative. The authors argue that, in periods of low economic growth, firms with low levels of cash flow may view R&D expenditure as a way of increasing future profits.
The relationship between firm size and R&D investment is somewhat ambiguous. Schumpeter (Citation1939; Citation1942) hypothesized that R&D and firm size (as measured by sales or market power) are positively related. The positive association is due to the correlation between size and access to finance (enabling financing of risky projects), economies of scale in the technology of R&D, higher returns to R&D due to higher volume of sales to cover fixed costs, and complementarities between R&D and other non-manufacturing activities (which may be more developed in larger firms). Counter to this, there may be a negative association between firm size and R&D intensity in that larger firms may lose managerial control (thereby reducing efficiency In R&D) and the incentives to scientists and entrepreneurs may diminish as their ability to capture the benefits of their R&D efforts declines (due to bureaucratization of inventive activity) (Cohen and Levin Citation1989). Indeed, the literature has been inconclusive overall regarding the relationship between firm size and R&D intensity, with some studies finding a positive relationship (Becker and Pain Citation2008; Cohen and Klepper Citation1996; Lee Citation2003; Lee, Yoo, and Kwak Citation2011), some finding a negative relationship (Hall, Lotti, and Mairesse Citation2009), and others finding statistically insignificant results (Cohen, Levin, and Mowery Citation1987). Lee and Sung (Citation2005) hypothesize a more complex relationship and find that firm size can affect firm R&D intensity not directly but indirectly through its influence on the elasticity of technological output with respect to R&D expenditure (or productivity of R&D).
The second category is competition in product markets. Theory postulates two opposing effects of competition on R&D expenditures. On the one hand, more competition may reduce the incentive to invest in R&D as the firm is less likely to extract the rents from innovation. More competitive firms are also less likely to have the resources (profits) to fund large scale R&D. On the other hand, more competition may increase R&D as the firm attempts to defend their market share (Becker Citation2013). Indeed, there is little consensus in the literature on how competition affects R&D effort. Some studies suggest that there is in fact a linear inverted U-curve effect in that there may be a positive effect of competition on R&D for technologically advanced firms but a negative effect for laggard firms (Aghion et al. Citation2009; Tingvall and Poldahl Citation2006).
The third category is policy instruments. R&D exhibits a classical public good problem as it is non-rivalrous and not completely excludable. As the private rate of return of R&D investment is below the social rate of return, R&D investment tends to be below the socially optimal level. Thus, governments adopt policy instruments such as subsidies and tax incentives to stimulate R&D activity. Many studies have investigated the relationship between tax allowances and R&D intensities at the firm level and most of them have found that the receipt of tax incentives is associated with higher R&D intensities, particularly in the short-run (Agrawal, Rosell, and Simcoe Citation2019; Boeing, Eberle, and Howell Citation2022; Rao Citation2016; Yang, Huang, and Hou Citation2012; Ziesemer Citation2021). However, studies such as Rao (Citation2016) show that this relationship holds in both the short and long run.
Subsidies may be less attractive compared to internal financing as they require long-term repayments of debt, and with the high risk of R&D investment comes high interest rates (Cuervo-Cazurra, Nieto, and Rodríguez Citation2018). In addition, public subsidies can have a negative effect and crowd out a firm’s private funding (Busom Citation2000). For example, Marino et al. (Citation2016) find evidence of crowding out in a sample of French firms and that it occurs particularly for medium to high levels of public subsidies. Yet, Boeing, Eberle, and Howell (Citation2022) estimate that R&D subsidies have a positive net impact on R&D inputs (proxied by R&D personnel) in large and medium-sized enterprises in China, despite a simultaneous reduction in privately financed R&D inputs, implying only a partial crowding out of private R&D investments. In a literature review of the effects of R&D subsidies on private R&D expenditure, Ziesemer (Citation2021) reports that the consensus among studies is that there is no complete crowding out of private R&D through subsidies. Rather, crowding out is either partial or the subsidies encourage additional private R&D expenditures.
The fourth category includes location and resource-related factors. The literature generally finds that there are benefits from knowledge spillovers from universities as well as proximity of similar firms (particularly for high-tech sectors) (Hájek and Stejskal Citation2018; Monjon and Waelbroeck Citation2003). The channels of these positive effects include: a large supply of highly trained graduates, informational spillovers between firms, university spin-off firms, personal interactions, formal collaboration and consultancy. Collaboration with other firms has been shown to have positive effects on R&D. For example, Parker (Citation2000) finds that South African clothing and textile manufacturers experience benefits from collaboration with other firms on new product development processes. Collaboration allows a reduction and sharing of product development risks and costs. It is usually motivated by technological gain, particularly when technological leadership is needed for technological advancement. However, there are also risks associated with collaboration in that partners may acquire the firm’s skills, experience and knowledge, there may be financial and time costs associated with managing the relationship, and there may be a loss of control over the product development process.
It is assumed that highly qualified human capital has important effects on R&D intensity (Lee, Wong, and Chong Citation2005). Human capital theory postulates that individuals possess skills, experience, and knowledge that impact on their work productivity and which help individuals acquire more skills and knowledge necessary to be productive. Education provides individuals with explicit knowledge necessary for work performance. It is particularly relevant for individuals working in R&D and in high-technology industries as they must deal with continuous technological advancements. Lee, Wong, and Chong (Citation2005) find that education has a positive impact on patents and copyrights obtained, articles published and presented, and product and process improvements. Based on this, one can hypothesize that education levels also impact positively on R&D intensity.
The fifth category described by Becker (Citation2013) refers to spillovers from foreign R&D. Foreign ownership may be positively related to R&D intensity as it is associated with greater access to foreign markets, greater competition, and technology transfers. Firms that have access to international markets are more likely to experience economies of scale, which makes it possible to pay off investments in R&D (Fonkam Citation2023). Foreign subsidiaries may transfer technology to domestic firms directly through licensing out of R&D contracting or indirectly through spillovers of knowledge. However, there is limited evidence of positive spillovers in the literature (Becker Citation2013). Some authors have highlighted that multinational firms tend to undertake most of their R&D in their home country, which is a reason for a negative relationship between foreign ownership and domestic R&D (Fabling Citation2008; Falk Citation2008).
Macro-economic determinants of firm R&D intensity
In addition to the firm-level factors discussed above, models of firm R&D intensity may also include macro or countrywide factors as determinants. These factors include for example, public sector R&D, market size, trade openness, FDI, private investment rate, and political stability.
The impact of public R&D on private sector R&D can be illustrated through two channels. On the one hand, public sector R&D can crowd out private sector R&D, as it not only uses resources for R&D but also earns exclusive property rights to the research results. On the other hand, public R&D can complement private R&D through collaborations with universities and government research. Deleidi and Mazzucato (Citation2021), for example, find that public R&D expenditure has a crowding-in effect in the US economy. Specifically, mission-oriented innovation policies generate a larger and more positive effect on private R&D investment, as compared to generic public expenditures.
Most of the underlying theories of R&D determinants focus on the supply side. However, demand-side factors are equally important. Real GDP growth and per capita income are significant factors as the two variables determine market size, which is important for the profitability of future inventions. Thus, real GDP growth is expected to have a positive association with R&D investment.
In terms of openness to trade, Grossman and Helpman (Citation1991) postulate that trade in final technology-intensive goods prevents the copying of external R&D. While this improves worldwide allocation of resources, it can in turn limit domestic R&D investment in some countries. Conversely, knowledge spillovers from international trade may have a favourable impact on domestic R&D. An indicator of openness to trade is therefore included in models of R&D intensity to capture the effects of both R&D appropriability and knowledge spillovers.
FDI can either have a positive or negative link to R&D investment. Capital inflows through FDI may create positive externalities by transferring new technologies, techniques and capital goods, thereby increasing firm-level R&D investment. However, new external advanced technologies may compete with the less-developed domestic technologies, which may drive firms out of business or be a disincentive for them to invest in R&D. Kosova (Citation2006) finds evidence of both technology spillovers and crowding out effects when foreign firms enter the country. Initially, foreign entry leads to an exit of domestic firms; however, over time, foreign presence leads to an increase in the emergence and survival of domestic firms.
The overall firm-level investment rate in an economy is expected to have a positive association with R&D investment. Technology in a firm is embedded in physical capital such as machinery and computers. Thus, the more physical capital a firm has the more R&D is to be expected, creating an incentive for technological advancement. In addition, progress in technology is likely to generate increases in productivity which in turn increases the profitability of investment in physical capital.
Finally, political instability is expected to have a negative relationship with R&D intensity. A firm’s management will delay spending during times of political instability as future returns to investment are uncertain. In turn, the reduction in spending will lead to a reduction in R&D intensity.
Emerging markets literature
The literature on firm-level R&D intensity in emerging market economies is sparser, but it is has been growing in recent years, and several studies have supported what has been found in the developed world. For example, the results of Özçelik and Taymaz (Citation2008) (Turkey), Crespi et al. (Citation2016) (Argentina), Jose, Sharma, and Dhanora (Citation2020) (India) and Ravšelj and Aristovnik (Citation2020) (Slovenia) support the findings that public R&D support, in the form of direct subsidies or tax incentives, has a positive impact on a firm’s R&D expenditure.
There have been several studies investigating the determinants of R&D in China, which is the world’s largest emerging economy and has recently made significant advances in R&D to expand its global influence (Jianga and Liua Citation2020). For example, Hu and Yongxu (Citation2019) and Boeing, Eberle, and Howell (Citation2022) show evidence of increases in R&D inputs as a result of public R&D subsidies; Jianga and Liua (Citation2020) explore how different characteristics of Chief Executive Officers influence Chinese firms’ R&D expenditure under conditions of economic policy uncertainty; and Wena and Zhao (Citation2021) find that manufacturing firms that are target beneficiaries of industrial policies aiming to promote innovation and technological upgrading invest more in R&D compared to those that are not. Xu and Sim (Citation2018) studied the determinants of R&D investment in Chinese and South Korean manufacturing firms. Their results indicate a negative relationship between R&D investment and firm size in China, suggesting the existence of economies of scale in the management of R&D projects, and in both countries, high debt has a negative impact on firm R&D intensity.
Using a panel of firms across 20 emerging markets (including two countries from Africa – Egypt and South Africa), Alam, Uddin, and Yazdifar (Citation2019) find that a country’s institutional environment is a significant determinant of R&D investment at the firm level. Their results show that government effectiveness, rule of law, and regularity have a positive impact, while corruption and political instability have a negative impact on firm R&D intensity. The authors highlight several reasons why institutional environments are important. For example, improved institutions make long-term R&D investments less risky and reduce transaction costs; a more conducive business environment attracts more foreign investors, thereby increasing access to external finance; and good governance is associated with strong intellectual property rights (IPRs) thereby providing protection to investors. The authors argue that institutional environment is especially important for emerging economies as these countries are attractive to foreign investors due to their higher rate of return to investment than in developed economies. In a similar study using a panel of firms across 28 transition economies in Europe and Central Asia, the results of Gogokhia and Berulava (Citation2021) indicate that better business environments, which impose the least constraints on a firm’s ability and incentive to innovate, impact positively on R&D intensity at firm level.
Despite the growing number of empirical studies on R&D intensity in emerging markets, there are still very few in Africa. In South Africa, two studies have supported the result that tax incentives have a positive impact on firm R&D spending – The World Bank (Citation2019) and James (Citation2009) – which use data collected by the DSI and the National Treasury, respectively. The World Bank study suggests that the tax incentive likely increases spending on R&D in South African firms by more than double, which is a significant finding. Other than these studies, there is little evidence of research into the determinants of R&D investment in South African firms. This type of research is vital to help explain why overall BERD has been declining in the country in recent years. A deeper understanding of the drivers of BERD is necessary to inform the development of effective policies that will help boost R&D investment in this sector and, in turn, improve the overall GERD/GDP ratio in the country. The business sector will also benefit from understanding the drivers of R&D, to boost productivity in firms and industries.
Theoretical and conceptual frameworks
A simple theory of the determinants of R&D intensity was pioneered by Lee (Citation2003). The reader should refer to this paper for a more detailed explanation of the model. In its simplest form, the theory asserts that given consumer preferences, each firm’s profit-maximizing R&D expenditure and price (and thus market share) are ultimately determined by its technological competence as well as its competitors’ technological competence. Thus, firm i’s sales revenue (S) and profit-maximizing R&D expenditure (r) can be written as:
(1)
(1) where,
is a function of the firm’s technological competence (
) and the levels of its competitors’ technological competence collectively denoted by
The parameter
can be regarded as representing the appropriability of technological competence. Thus, the firm’s profit-maximizing R&D expenditure is determined jointly by R&D cost structure (
), consumer preference (
), its technological competence (
), R&D appropriability (
), and the size of the market (Q).
Moncada-Paternò-Castello (Citation2016) proposed a more general theoretical framework of the determinants of corporate R&D intensity. According to their framework, a country’s total corporate R&D intensity is dependent on both structural and intrinsic effects. The structural factors can be endogenous (sectoral characteristics) or exogenous (macro-economic factors or those external to the sector(s)). Intrinsic factors are identified as those that determine firm-level characteristics and behaviour, such as the firm’s knowledge, financial capacity and R&D investment.
The conceptual framework in this study draws on these theoretical frameworks and postulates that the amount of R&D spent by a firm as a proportion of their total turnover is influenced by both firm-level (micro) factors (including internal characteristics such as firm size) and external factors (such as government support, as well as economy-wide (macro) factors, such as FDI). Thus, to gain a proper understanding of the key drivers of firm-level investment in R&D, it is important to incorporate both micro- and macro-economic factors into the empirical model.
The empirical model that follows uses a variation of EquationEquation 1(1)
(1) , augmented to account for other firm specific and macro-economic variables that are significant in explaining R&D intensity. This is done in accordance with the empirical literature.
Empirical model
The empirical model in our analysis estimates the impact of a range of firm-level as well as macro-economic variables on R&D intensity. The model is specified as follows:
where RDIN is firm R&D intensity, defined as the firm’s R&D expenditure as a percentage of turnover, FSIZE is firm size, HCAP is human capital, TAXIN is tax incentive, PUBINV is public R&D investment, DINV is domestic investment, FDI is foreign direct investment, TRDOP is trade openness, RGDP is real GDP growth, POLS is political stability, COLB is collaboration inside South Africa, SOF_GOV is funding from government, and PIV is the private investment rate. The prefix LN indicates that the variable is in logarithmic form. Further details regarding the variables are provided in .
Table 1: Data description.
Following studies such as Yang, Huang, and Hou (Citation2012), Becker (Citation2013) and Rao (Citation2016), the dynamic generalized methods of moments (GMM) estimation technique is used. The GMM model was developed by Arellano and Bond (Citation1991) and Blundell and Bond (Citation1998) and can be used to analyze dynamic panel data, where cause and effect relationships are dynamic over time. It provides consistent results in the presence of three sources of endogeneity: unobserved heterogeneity, simultaneity and dynamic endogeneity (Ullah, Akhtar, and Zaefarian Citation2018).
The GMM approach is appropriate for this study for several reasons. First, it is consistent with the panel data structure with few time (t) periods and many cross-sectional (N) observations. Second, there are individual (firm-level) fixed effects. Third, the GMM approach can deal with endogeneity in the form of simultaneity bias whereby there may be reciprocal causation between the dependent variable (R&D intensity) and some of the independent variables, causing these dependent variables to be correlated with the error term. The estimation technique deals with this by using lagged levels of the independent variables as instruments. Fourth, strategic investments such as R&D follow the path-dependent hypothesis in that cumulativeness of information and knowledge implies that the current year’s R&D investment follows that of the previous year. The GMM estimation procedure deals with this ‘dynamic endogeneity’ by controlling for lagged values of the dependent variable, which are considered internal instruments. Finally, both heteroscedasticity and auto-correlation within firms can be addressed by GMM estimations (Roodman Citation2009).
We follow the approach of numerous studies using the GMM model whereby both micro- (firm-level) and macro-variables are included on the right-hand-side to explain a firm-level dependent variable (e.g., Lalon and Mili (Citation2023), Farooq, Ahmed, and Khan (Citation2021), Petkovski, Kjosevski, and Jovanovski (Citation2021) and Ogundipe, Salawu, and Ogundipe (Citation2012)). The inclusion of both micro and macro variables is also consistent with our theoretical and conceptual framework. The underlying assumption is that there are unobservable firm-specific variables that are different across firms but are fixed for a given firm through time, and there are observable firm-specific variables that vary across both firms and time. In addition, there are economy-wide factors that are exogenous to the firm, which vary through time but are the same for all firms each year.
There are two commonly used GMM estimation techniques: system GMM and difference GMM. The system GMM is chosen over the difference GMM because of the nature of the data. Specifically, our panel is unbalanced and covers a relatively short time period (Teixeira and Queirós Citation2016). The system GMM has been used widely in the literature (e.g., Bond, Harhoff, and Van Reenen Citation2005; Brown and Petersen Citation2011; Brown, Martinsson, and Petersen Citation2012; Griffith, Harrison, and Van Reenen Citation2006).
Data
The analysis uses an unbalanced panel of 603 R&D performing firms spanning from the 2008/09 financial year to 2017/18. The data come from the South African National Survey of Research and Experimental Development (R&D Survey), which is conducted annually by the Centre for Science, Technology and Innovation Indicators (CeSTII) on behalf of the Department of Science and Innovation (DSI). The survey questionnaires collect information on R&D expenditure, funding for R&D, R&D personnel, and areas of research. Organizations from the following sectors participate in the survey: the business enterprise sector, the government sector, the higher education sector, the not-for-profit sector and the science council sector. However, we include only the business sector in our analysis.
The sampling frame for a given R&D Survey reference period, e.g., 2008/09, includes all firms that performed in-house R&D (engaged in and spent on R&D) during that reference period. In other words, the frame comprises all R&D performers for that period. It is not fixed, as it is subject to change from one reference period to the next, with some firms performing R&D in a given period and not doing so in the next period, and vice versa. In addition, some firms may die (become inactive, merge with other firms, relocate from South Africa or close) or be born (become active for the first time).
The survey follows a census approach whereby all R&D performing firms in the frame are approached to take part in the survey. To establish the frame, ongoing survey intelligence applies a concerted effort to identify a given survey period’s new births and deaths as well as new R&D performers and non-R&D performers. Such survey intelligence involves tracking firms in lists, such as the one for the Support Programme for Industrial Innovation (SPII), reviewing business newspapers such as the Business Day, and contacting likely R&D performers to confirm.
As a result of the nature of the frame, a firm may perform R&D and hence be included in the frame in a given reference period, and not perform R&D and be excluded from the frame in the next reference period or beyond and perform R&D and re-enter the frame at a later reference period. This leads to an unbalanced panel of firms in the study conducted for this paper.
The macro-economic variables used in the model are sourced from the South African Reserve Bank (SARB) database, the World Bank indicators and World Governance Index. A description, the source, and the expected sign of each variable in the model are provided in .
Descriptive statistics
provides summary statistics over the ten-year period for all variables in the model. On average, the firms in the sample spend about 10.6% of turnover on R&D. The average number of employees who hold a university degree is just over ten employees. Government R&D spending as a percentage of GDP is an average of 0.16% and the political environment has been relatively unstable with an average score of −0.09.
Table 2: Descriptive statistics.
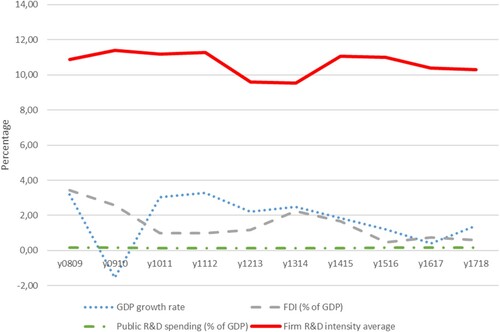
displays the trends in the GDP growth rate, FDI (as a percentage of GDP), public R&D spending (as a percentage of GDP) and the average R&D intensity across all firms in each year. We see that the average amount of firm-level spending on R&D as a percentage of turnover fluctuates around 10% over the period such that the net decline over the ten-year period is small, dropping from 10.9% in 2008/09 to 10.3% in 2017/18. The GDP growth rate experiences a significant drop into negative territory following the start of the 2008 financial crisis, recovers in 2010/11, and then decreases quite steadily till 2016–2017, with an overall decline from 3.2% in 2008/09 to 1.4% in 2017/18. FDI as a percentage of GDP gradually declines over the ten-year period, from 3.5% in 2008/09 to 0.6% in 2017/18. Finally, public spending on R&D as a percentage of GDP remains low over the ten years, beginning and ending at 0.17%.
Figure 1: Trends in average firm R&D intensity, public R&D spending, FDI and GDP growth rate.
presents the co-movement between the key variables. The correlation between most of the explanatory variables is less than 0.50 implying that multicollinearity is not a significant concern. The highest correlations are between private investment (PI) and trade openess (TO), and political stability (PS) and real GDP growth (RG), both with correlation coefficients of 56%. It should be noted that the correlation matrix only shows associations and does not imply causation.
Table 3: Correlation matrix
Results
presents system GMM estimates for the determinants of R&D intensity in South African R&D performing firms, for the short- and long-run, respectively. The short-run coefficient of the lagged dependent variable (R&D intensity) is positive and statistically significant. It implies that higher R&D intensity from the previous year has a positive impact on current R&D intensity. This result is consistent with theoretical expectations and the findings of Alam, Uddin, and Yazdifar (Citation2019) for R&D intensity in emerging markets. The adjustment coefficient is about 0.86 (1–0.14), which shows that the dynamic model is reasonable and that firms cannot instantly adjust towards the target R&D intensity following changes in firm-specific characteristics or random shocks.
Table 4: Results of the two-step system GMM.
Firm size (log of turnover) is negative and significant. The results indicate that, in the short run, a 1% increase in firm size will lead to a 0.71% decrease in R&D intensity. In the long run, R&D intensity becomes more elastic with a coefficient of −0.82. These results are contrary to Schumpeterian theory. However, as mentioned earlier, larger firms may struggle to implement R&D activities due to their more complex management structures, thereby resulting in a negative relationship between firm size and R&D intensity (Lee, Yoo, and Kwak Citation2011). The result could also reflect the type of work that smaller firms are typically involved in (e.g., software development).
A firm’s collaboration within South Africa has a positive impact on its R&D intensity. External collaborations with universities and other research institutions lead to knowledge spillovers and encourage firms to conduct more R&D. A firm that is engaged in a collaboration will have an R&D intensity that is 12.7% higher than a firm that is not engaged in a collaboration in the short run and 15% higher in the long run (Note that for any dummy variable coefficient, the percentage change is calculated using the following formula: ). As expected, the coefficient of human capital measured by the number of employees with a university degree has a positive effect on a firm’s R&D intensity. The higher the number of employees with a degree the more R&D intensive a firm will be.
When a firm receives government funding, R&D investment is 75.1% higher compared to when there is no receipt in the short run and 100% higher in the long run. Government funding to a firm will encourage R&D intensity because of the reduced cost to a firm’s balance sheet.
Firms that reported using the tax incentive have higher R&D investment. Use of the R&D tax incentive is associated with a 56.8% higher R&D intensity in the short run and 68.2% higher R&D intensity in the long run. Similar to government funding, a tax incentive provides firms with a reduction in the cost of conducting R&D. This is akin to the effect of public R&D investment at the economy-wide level, to which a firms’ R&D intensity is highly responsive. A 1% increase in public R&D expenditure is associated with a 2.2% increase in firm R&D intensity in the short run. Public R&D investment is thus highly beneficial to firms through funding, collaborations and other forms of R&D-related support. Falk (Citation2004) has made a similar finding for a panel of OECD countries.
FDI complements R&D-intensive firms through the transfer of positive externalities and knowledge spillovers, especially in the long run. A 1% increase in FDI leads to 0.37% increase in R&D intensity in the short run and a higher 0.43% increase in the long run. Lee, Yoo, and Kwak (Citation2011) also find a positive impact of FDI on R&D intensity for Korean firms.
Interestingly, the coefficient of private investment is not consistent with theoretical expectations as we see negative coefficients in both the short and long run. One could argue that an increase in investment in fixed capital at the country level erodes funds available for individual firm R&D investment, thus the negative relationship.
Lastly, political stability appears to be negatively related to R&D intensity.
Model diagnostics
We apply three tests for the validity of our instruments. The results are presented in . First, the Hansen statistic of over-identifying restrictions fails to reject the null hypothesis. In other words, the over-identifying restrictions are valid. The test is also not weakened by the number of instruments as the number of groups (603) is greater than the number of instruments (61). Second, the difference-in-Hansen test for exogeneity (Hansen Citation1982) indicates that the instrumental variables are exogenous. Third, we test for serial autocorrelation. The test for AR(1) process in first differences rejects the null hypothesis of no autocorrelation. However, the test for second-order autocorrelation (AR(2) process), which tests the first difference residuals, indicates no serial autocorrelation in the model. Thus, the results from the Hansen and autocorrelation tests confirm that the model is robust and correctly specified.
Table 5: Diagnostic tests.
Conclusion
This study aimed to investigate the determinants of firm-level R&D intensity in South Africa. It contributes to what is currently a paucity of literature on the determinants of firm-level R&D in middle-income countries, particularly those in Africa. Utilizing the GMM model, it is the first known study in South Africa to measure both the micro and macro effects on firm R&D intensity. The significance of this investigation is based on the observed trend of a decline in BERD over the past decade while other sectors, most notably government, have increased their shares.
A major policy finding is that government financial support is a significant factor encouraging firm R&D activities. The results indicate that receipt of government subsidies and tax incentives both have positive impacts on R&D intensity. This provides confirmation that public support is effective overall and also helps to inform more specific policy targeting and implementation of such public support.
First, smaller firms have higher R&D intensities compared to larger firms. Thus, designing instruments that are tailored for larger firms (that are relatively less R&D intensive) may be necessary. Second, collaboration within South Africa as well as highly qualified personnel both have positive effects on R&D intensity. Thus, government investment in higher education and other research institutions (which offer collaborative potential) may serve to aid firms in their R&D efforts. These results imply that R&D performing firms in particular areas, for example in close proximity to universities or other similar firms, may benefit from resource and knowledge spillovers. Policy-makers should therefore assist and promote networking and collaborations in these areas to help stimulate firm R&D activity.
The modelling analysis also highlighted the significance of the macro environment on efforts to foster firm R&D activity. Attracting FDI is key to stimulate firm-level investment. However, there is evidence that public R&D investment at the economy-wide level stimulates R&D activity within individual firms, which may be the result of knowledge spillovers or other forms of government R&D support. Thus, policy-makers should continue to advocate and promote the value of public R&D investment programmes, particularly in periods of economic decline or stagnation. Networking and collaboration between businesses and entities that benefit from public R&D investments (such as higher education institutions) should also be supported by government, to facilitate knowledge spillovers.
From government’s perspective, there is a need to grow overall GERD to reach the national targets it has set. At the same time, individual firms aim to increase their productivity by strengthening their technological capabilities through innovation activities, including R&D. Aggregated across multiple firms, this effort contributes to BERD and hence, overall growth in GERD. Understanding the drivers of business R&D investment in a country like South Africa, as identified in this paper, can help both government and the business sector to achieve their shared goal of increasing firm-level R&D intensity.
Acknowledgements
We would like to thank Dr Glenda Kruss for her advice and guidance during the writing process. We also thank the Department of Science and Innovation of the Republic of South Africa for their financial support. A previous, unpublished, version of this paper was cited in “South African National Survey of Research and Experimental Development. Statistical Report: 2018/19” (CeSTII Citation2021).
Disclosure statement
No potential conflict of interest was reported by the authors.
Additional information
Funding
Notes
1 BERD as a share of GERD fell from 41 percent in 2017/18 to 31 percent in 2019/20 (CeSTII Citation2021).
2 The WGI compiles data for five categories, namely: voice and accountability, political stability and absence of violence/terrorism, government effectiveness, regulatory quality, rule of law and control of corruption. The political stability and violence index measures the perception of the likelihood of political instability and/or politically motivated violence including terrorism. The index ranges between −2.5 and +2.5. When the score of a country on the related index is close to −2.5 it shows that it has high levels of political instability whereas a more politically stable country will score close to + 2.5.
3 Means calculated over the 10-year period for each variable.
4 The GMM long-run estimates were calculated using the formula: where
is the significant coefficient from the short-run system GMM and
the coefficient of the lagged dependent variable.
References
- Aghion, P., R. Blundell, R. Griffith, P. Howitt, and S. Prantl. 2009. “The Effects of Entry on Incumbent Innovation and Productivity.” The Review of Economics and Statistics 91 (1): 20–32. doi:10.1162/rest.91.1.20.
- Agrawal, A., C. Rosell, and T. Simcoe. 2019. “Tax Credits and Small Firm R&D Spending.” NBER Working Paper No. 20615, 1987. http://www.nber.org/papers/w20615.
- Alam, A., M. Uddin, and H. Yazdifar. 2019. “Institutional Determinants of R&D Investment: Evidence from Emerging Markets.” Technological Forecasting and Social Change 138: 34–44. doi:10.1016/j.techfore.2018.08.007.
- Arellano, M., and S. Bond. 1991. “Some Tests of Specification for Panel Data: Monte Carlo Evidence and an Application to Employment Equations.” The Review of Economic Studies 58 (2): 277–297. doi:10.2307/2297968
- Arrow, K. 1962. “Economic Welfare and the Allocation of Resources to Invention.” In The Rate and Direction of Inventive Activity: Economic and Social Factors, edited by Universities-National Bureau Committee for Economic Research and the Committee on Economic Growth of the Social Science Research Councils, 609–626. Princeton, NJ: Princeton University Press. doi:10.1515/9781400879762-024
- Becker, B. 2013. The Determinants of R&D Investment: A Survey of the Empirical Research. Loughborough University Discussion Papers.
- Becker, B., and N. Pain. 2008. “What Determines Industrial R&D Expenditure in the UK?” The Manchester School 76 (1): 66–87. doi:10.1111/j.1467-9957.2007.01050.x.
- Bloch, C. 2005. “R&D Investment and Internal Finance: The Cash Flow Effect.” Economics of Innovation and New Technology 14 (3): 213–223. doi:10.1080/1043859042000312710.
- Blundell, R., and S. Bond. 1998. “Initial Conditions and Moment Restrictions in Dynamic Panel Data Models.” Journal of Econometrics 87 (1): 115–143. doi:10.1016/S0304-4076(98)00009-8
- Boeing, P., J. Eberle, and A. Howell. 2022. “The Impact of China’s R&D Subsidies on R&D Investment, Technological Upgrading and Economic Growth.” Technological Forecasting & Social Change 174: 121212. doi:10.1016/j.techfore.2021.121212.
- Bond, S., D. Harhoff, and J. Van Reenen. 2005. “Investment, R&D and Financial Constraints in Britain and Germany.” Annales d’Économie et de Statistique 79 (80): 435–463.
- Bravo-Ortega, C., and A. Marin. 2011. “R&D and Productivity: A Two Way Avenue?” World Development 39 (7): 1090–1107. doi:10.1016/j.worlddev.2010.11.006.
- Brown, J., S. Fazzari, and B. Peterson. 2009. “Financing Innovation and Growth: Cash Flow, External Equity, and the 1990s R&D Boom.” Journal of Finance 64 (1): 151–185. doi:10.1111/j.1540-6261.2008.01431.x.
- Brown, J., G. Martinsson, and B. Petersen. 2012. “Do Financing Constraints Matter for R&D?” European Economic Review 56 (8): 1512–1529. doi:10.1016/j.euroecorev.2012.07.007.
- Brown, J., and B. Petersen. 2011. “Cash Holdings and R&D Smoothing.” Journal of Corporate Finance 17 (3): 694–709. doi:10.1016/j.jcorpfin.2010.01.003.
- Busom, I. 2000. “An Empirical Evaluation of the Effects of R&D Subsidies.” Economics of Innovation and New Technology 9 (2): 111–148. doi:10.1080/10438590000000006.
- Cameron, G., J. Proudman, and S. Redding. 2005. “Technological Convergence, R&D, Trade and Productivity Growth.” European Economic Review 49 (3): 775–807. doi:10.1016/S0014-2921(03)00070-9.
- CeSTII. 2021. “South African National Survey of Research and Experimental Development. Statistical Report: 2018/19”.
- Chawla, D. 2019. “Economic Growth and R&D Expenditures in Selected OECD Countries: Is There any Convergence?” African Journal of Science, Technology, Innovation and Development, doi:10.1080/20421338.2019.1608694.
- Coe, D., E. Helpmann, and A. Hoffmaister. 2009. “International R&D Spillovers and Institutions.” European Economic Review 53 (7): 723–741. doi:10.1016/j.euroecorev.2009.02.005.
- Cohen, W., and S. Klepper. 1996. “A Reprise of Size and R&D.” The Economic Journal 106 (437): 925–951. doi:10.2307/2235365.
- Cohen, W., and R. Levin. 1989. “Empirical Studies of Innovation and Market Structure.” Handbook of Industrial Organization 2: 1059–1107. doi:10.1016/S1573-448X(89)02006-6.
- Cohen, W., R. Levin, and D. Mowery. 1987. “Firm Size and R&D Intensity: A Re-examination.” NBER Working Paper No. 2205, 1987.
- Crespi, G., D. Giuliodorib, R. Giuliodori, and A. Rodriguez. 2016. “The Effectiveness of tax Incentives for R&D in Developing Countries: The Case of Argentina.” Research Policy 45 (10): 2023–2035. doi:10.1016/j.respol.2016.07.006.
- Cuervo-Cazurra, A., M. J. Nieto, and A. Rodríguez. 2018. “The Impact of R&D Sources on new Product Development: Sources of Funds and the Diversity Versus Control of Knowledge Debate.” Long Range Planning 51 (5): 649–665. doi:10.1016/j.lrp.2017.06.004.
- Deleidi, M., and M. Mazzucato. 2021. “Directed Innovation Policies and the Supermultiplier: An Empirical Assessment of Mission-Oriented Policies in the US Economy.” Research Policy 50 (2): 1–13. doi:10.1016/j.respol.2020.104151.
- Department of Science and Technology (DST). 2019. White Paper on Science, Technology and Innovation.
- Fabling, R. 2008. “Will a BERD Model Fly? Estimating Aggregate R&D Expenditure Using a Micro Model.” Draft Paper Prepared for ESAM, 8.
- Falk, M. 2004. “What Drives Business R&D Intensity Across OECD Countries?” In WIFO Working Papers, No. 236. Vienna: Austrian Institute of Economic Research (WIFO).
- Falk, M. 2008. “Effects of Foreign Ownership on Innovation Activities: Empirical Evidence for Twelve European Countries.” National Institute Economic Review 204 (1): 85–97. doi:10.1177/00279501082040011001.
- Farooq, U., J. Ahmed, and S. Khan. 2021. “Do the Macroeconomic Factors Influence the Firm's Investment Decisions? A Generalized Method of Moments (GMM) Approach.” International Journal of Finance & Economics 26 (1): 790–801. doi:10.1002/ijfe.1820.
- Fonkam, A. 2023. “Determinants of Technology-Intensive Exports: The Case of African Countries, 1995–2017.” African Journal of Science, Technology, Innovation and Development, doi:10.1080/20421338.2022.2156026.
- Gogokhia, T., and G. Berulava. 2021. “Business Environment Reforms, Innovation and Firm Productivity in Transition Economies.” Eurasian Business Review 11 (2): 221–245. doi:10.1007/s40821-020-00167-5.
- Griffith, R., R. Harrison, and J. van Reenen. 2006. “How Special Is the Special Relationship? Using the Impact of U.S. R&D Spillovers on U.K. Firms as a Test of Technology Sourcing.” American Economic Review 96 (5): 1859–1875. doi:10.1257/aer.96.5.1859.
- Grossman, G., and E. Helpman. 1991. Innovation and Growth in the Global Economy. Cambridge, MA: The MIT Press.
- Hall, B., F. Lotti, and J. Mairesse. 2009. “Innovation and Productivity in SMEs: Empirical Evidence for Italy.” Small Business Economics 33 (1): 13–33. doi:10.2139/ssrn.1523220.
- Hansen, L. 1982. “Large Sample Properties of Generalized Method of Moments Estimators.” Econometrica 50 (4): 1029–1054. doi:10.2307/1912775.
- Hájek, P., and J. Stejskal. 2018. “R&D Cooperation and Knowledge Spillover Effects for Sustainable Business Innovation in the Chemical Industry.” Sustainability 10 (4): 1–20. doi:10.3390/su10041064.
- Hess, A., C. Campos, and T. Moloi. 2019. “Assessing the Resilience of Brazil, Russia, India, China and South Africa Economies Following the Global Financial Crisis.” Acta Commercii 19 (1): a659. doi:10.4102/ac.v19i1.659.
- Howitt, P., and P. Aghion. 1998. “Capital Accumulation and Innovation as Complementary Factors in Long-Run Growth.” Journal of Economic Growth 3 (2): 111–130. doi:10.1023/A:1009769717601
- Hsu, C., Y. Lien, and H. Chen. 2015. “R&D Internationalization and Innovation Performance.” International Business Review 24 (2): 187–195. doi:10.1016/j.ibusrev.2014.07.007.
- Hu, A., and D. Yongxu. 2019. “Does Government R&D Stimulate or Crowd out Firm R&D Spending? Evidence from Chinese Manufacturing Industries.” Economics of Transition and Institutional Change 27 (2): 497–518. doi:10.1111/ecot.12188.
- James, S. 2009. Tax and Non-tax Incentives and Investments: Evidence and Policy Implications. Washington DC: The World Bank Group. Accessed at https://documents1.worldbank.org/curated/en/945061468326374478/pdf/588160WP0Incen10BOX353820B01PUBLIC1.pdf.
- Jianga, H., and C. Liua. 2020. “Economic Policy Uncertainty, CEO Characteristics and Firm R&D Expenditure: A Bayesian Analysis.” Applied Economics 52 (34): 3709–3731. doi:10.1080/00036846.2020.1721422.
- Jose, M., R. Sharma, and M. Dhanora. 2020. “R&D Tax Incentive Scheme and in-House R&D Expenditure: Evidences from Indian Firms.” Journal of Advances in Management Research 17 (3): 333–349. doi:10.1108/JAMR-05-2019-0080.
- Kafouros, M. 2005. “R&D and Productivity Growth: Evidence from the UK.” Economics of Innovation and New Technology 14 (6): 479–497. doi:10.1080/1043859042000269098.
- Kosova, R. 2006. “Do Foreign Firms Crowd out Domestic Firms? Evidence from the Czech Republic.” The Review of Economics and Statistics 92 (4): 861–881. doi:10.2139/ssrn.891776.
- Laborda, J., V. Salas-Fumás, and C. Suárez. 2020. “An Endogenous Approach to the Cyclicality of R&D Investment Under Credit Constraints: Firms’ Cash Flow Matters!” Journal of Open Innovation: Technology, Market, and Complexity 6 (2): 33. doi:10.3390/joitmc6020033.
- Lalon, R., and A. Mili. 2023. “Investigating the Impact of Firm-Specific and Macroeconomic Determinants of Operating Efficiency of Commercial Banks: Panel Evidence from Bangladesh.” International Journal of Economics and Financial Issues 13 (2): 61–71. doi:10.32479/ijefi.14161.
- Lee, C. Y. 2003. “A Simple Theory and Evidence on the Determinants of Firm R&D.” Economics of Innovation and New Technology 12 (5): 385–395. doi:10.1080/1043859022000003418.
- Lee, C., and T. Sung. 2005. “Schumpeter’s Legacy: A New Perspective on the Relationship Between Firm Size and R&D.” Research Policy 34 (6): 914–931. doi:10.1016/j.respol.2005.04.006.
- Lee, S., P. Wong, and C. Chong. 2005. “Human and Social Capital Explanations for R&D Outcome.” IEEE Transactions on Engineering Management 52 (1): 59–68. doi:10.1109/TEM.2004.839955.
- Lee, J., S. Yoo, and S. Kwak. 2011. “Modelling R&D Expenditure Data with Zero Observations: Two-Equation Model.” Applied Economics 43 (6): 717–727. doi:10.1080/00036840802599792.
- Marino, M., S. Lhuillery, P. Parrotta, and D. Sala. 2016. “Additionality or Crowding-Out? An Overall Evaluation of Public R&D Subsidy on Private R&D Expenditure.” Research Policy 45 (9): 1715–1730. doi:10.1016/j.respol.2016.04.009.
- Miao, Y., J. Song, K. Lee, and C. Jin. 2018. “Technological Catch-up by East Asian Firms: Trends, Issues, and Future Research Agenda.” Asia Pacific Journal of Management 35 (3): 639–699. doi:10.1007/s10490-018-9566-z.
- Moncada-Paternò-Castello, P. 2016. “Corporate R&D Intensity Decomposition: Theoretical, Empirical and Policy Issues.” In JRC Working Papers on Corporate R&D and Innovation 2016-02, Joint Research Centre (Seville site).
- Monjon, S., and P. Waelbroeck. 2003. “Assessing Spillovers from Universities to Firms: Evidence from French Firm-Level Data.” International Journal of Industrial Organization 21 (9): 1255–1270. doi:10.1016/S0167-7187(03)00082-1.
- OECD. 2020. OECD Economic Surveys: South Africa 2020. Paris: OECD Publishing. doi:10.1787/530e7ce0-en.
- Ogundipe, S., R. Salawu, and L. Ogundipe. 2012. “The Determinants of Corporate Cash Holdings in Nigeria: Evidence from General Method of Moments (GMM).” World Academy of Science, Engineering and Technology 61.
- O’Mahony, M., and M. Vecchi. 2009. “R&D, Knowledge Spillovers and Company Productivity Performance.” Research Policy 38 (1): 35–44. doi:10.1016/j.respol.2008.09.003.
- Özçelik, E., and E. Taymaz. 2008. “R&D Support Programs in Developing Countries: The Turkish Experience.” Research Policy 37 (2): 258–275. doi:10.1016/j.respol.2007.11.001.
- Parker, H. 2000. “Interfirm Collaboration and the New Product Development Process.” Industrial Management and Data Systems 100 (6): 255–261. doi:10.1108/02635570010301179.
- Petkovski, M., J. Kjosevski, and K. Jovanovski. 2021. “Macro and Bank Specific Determinants of non-Performing Loans in Polish Commercial Banks.” Argumenta Oeconomica 2 (47): 107–126. doi:10.15611/aoe.2021.2.06
- Rao, N. 2016. “Do tax Credits Stimulate R&D Spending? The Effect of the R&D tax Credit in its First Decade.” Journal of Public Economics 140: 1–12. doi:10.1016/j.jpubeco.2016.05.003.
- Ravšelj, D., and A. Aristovnik. 2020. “The Impact of Public R&D Subsidies and Tax Incentives on Business R&D Expenditures.” International Journal of Economics and Business Administration 8 (1), doi:10.35808/ijeba/416.
- Redding, S., and J. Proudman. 1998. “Productivity Convergence and International Openness.” Bank of England Working Papers 77. London: Bank of England.
- Romer, P. 1986. “Increasing Returns and Long-run Growth.” Journal of Political Economy 94 (5): 1002–1037. doi:10.1086/261420.
- Roodman, D. 2009. “How to do Xtabond2: An Introduction to Difference and System GMM in Stata.” The Stata Journal: Promoting communications on statistics and Stata 9 (1): 86–136. doi:10.1177/1536867X0900900106
- Savrul, M., and A. Incekara. 2015. “The Effect of R&D Intensity on Innovation Performance: A Country Level Evaluation.” Procedia Social and Behavioral Sciences 210: 388–396. doi:10.1016/j.sbspro.2015.11.386.
- Schumpeter, J. 1939. Business Cycles: A Theoretical, Historical, and Statistical Analysis of the Capitalist Process. New York: McGraw-Hill Book Company, Inc.
- Schumpeter, J. 1942. Capitalism, Socialism, and Democracy. New York: Harper & Brothers.
- Teixeira, A., and A. Queirós. 2016. “Economic Growth, Human Capital and Structural Change: A Dynamic Panel Data Analysis.” Research Policy 45 (8): 1636–1648. doi:10.1016/j.respol.2016.04.006
- Tingvall, P., and A. Poldahl. 2006. “Is There Really an Inverted U-Shaped Relation Between Competition and R&D?” Economics of Innovation and New Technology 15 (2): 101–118. doi:10.1080/10438590500129755.
- Ullah, S., P. Akhtar, and G. Zaefarian. 2018. “Dealing with Endogeneity Bias: The Generalized Method of Moments (GMM) for Panel Data.” Industrial Marketing Management 71: 69–78. doi:10.1016/j.indmarman.2017.11.010.
- Wena, H., and Z. Zhao. 2021. “How Does China’s Industrial Policy Affect Firms’ R&D Investment? Evidence from ‘Made in China 2025’.” Applied Economics 53 (55): 6333–6347. doi:10.1080/00036846.2020.1717429.
- World Bank. 2017. South African Economic Update 10: Innovation for Productivity and Inclusiveness. Washington, DC: World Bank.
- World Bank Group. 2019. Impact Evaluation of the R&D Tax Incentive in South Africa. Unpublished manuscript Report. Accessed at https://www.treasury.gov.za/comm_media/press/2021/TaxPolicyDiscussion/.
- Xu, J., and J. Sim. 2018. “Characteristics of Corporate R&D Investment in Emerging Markets: Evidence from Manufacturing Industry in China and South Korea.” Sustainability 10 (9): 1–18. doi:10.3390/su10093002.
- Yang, C. H., C. H. Huang, and T. C. T. Hou. 2012. “Tax Incentives and R&D Activity: Firm-Level Evidence from Taiwan.” Research Policy 41 (9): 1578–1588. doi:10.1016/j.respol.2012.04.006.
- Ziesemer, T. 2021. “The Effects of R&D Subsidies and Publicly Performed R&D on Business R&D: A Survey.” Review of Public Economics 236 (1): 171–205.