
Abstract
Surfaces are the most vulnerable part of structures due to continuous exposure to variable climatic conditions. Even if weathering mainly affects the aestethic appearance of wooden facades it may lead to more advanced degradation such as wood cracking, checks and consequently penetration of the wood-decaying agents into the material. The goal of this research was to investigate the kinetics of the degradation rate of wooden samples. The experimental specimens were weathered at 15 locations in Europe for a period of 1 month. Hyperspectal imaging was used for evaluation of earlywood and latewood degradation. Two approaches for image analysis were presented highlighting their advantages and constraints regarding the evaluation of weathered samples. The proposed technique was able to scrutinise differences in degradation of earlywood and latewood, therefore provided new understanding for the kinetic of the weathering process.
Introduction
Wood is frequently used for various types of load-bearing structures and complementary construction components, such as cladding and decking. The surfaces of the wooden elements exposed to weathering are usually considered as the most vulnerable parts of the structure. During service life, the surface changes properties because of exposure to mechanical, environmental or biological agents in various altering processes: aging, weathering and decay. The term weathering is used to define the slow degradation of materials exposed to climatic conditions. The rate of weathering varies between and within timber species, function of product, technical/design solution, finishing technology and specific local conditions. The process leads to a slow degradation of surface fibres (erosion), and consequently to a roughening of the surface. The process is relatively slow; on average 5–6 mm per hundred of years (Williams Citation2005). However, weathering can stimulate the formation of discontinuities on the wooden surface. Moisture and sunlight cause stresses in wood surface due to shrinkage–swelling resulting in micro cracks and checks (Mohebby and Saei Citation2016). That might lead to easier penetration and retention of water within material and in consequence penetration of wood-decaying and wood deteriorating biological agents into the bulk. Weathering also affects the aesthetics of facades. The colour of exposed wooden members changes rapidly when not protected. The characteristic grey patina, which is visible after only few months of exposure, is mostly caused by photodegradation of lignin in the middle lamella due to UV radiation (Williams Citation2005).
The erosion rate has been previously investigated by several authors (Williams, Knaebe, Sotos and Feist Citation2001a, Citation2001b, Citation2001c; Sandberg Citation2005) however regarding a longer exposure period. According to the previous investigation of Sandberg and Söderström (Citation2006), cracks on radial sections will first occur at the annual ring border due to the large and abrupt change in density in the transition from latewood to earlywood. Williams et al. (Citation2001b) showed that earlywood erodes more quickly than latewood during the first several years of natural weathering until the latewood zones become isolated and the rate of erosion increases. Similar conclusions were presented by Yata and Tamura (Citation1995) by means of histo-chemical techniques. Furthermore, it was proved that earlywood is more susceptible to erosion than latewood during weathering by examining the depth of photodegradation. The trace of lignin degradation was detected at the depth of five cells in earlywood and two cells in latewood (Kataoka, Kiguchi, Fujiwara and Evans Citation2005). It was concluded by Mohebby and Saei (Citation2016) that the photodegradation and surface erosion of earlywood is due to its low density and high porosity.
Facades made of wooden material often present a non-uniform degradation patterns. Frequently, discolorations disqualify facades from an aesthetic point of view even if it still maintains its physical functionality. Various architectural solutions, uneven climatic exposure and different kinetics of the degradation of early and late wood are the main reasons for a heterogeneous appearance.
Several techniques have been used for assessment of wooden members exposed to degradation processes. The effect of weathering was previously investigated by means of spectroscopic techniques (Tolvay and Faix Citation1995; Tsuchikawa, Inoue and Mitsui Citation2003; Pandey Citation2005; Wang and Wacker Citation2006; Jelle, Ruther and Hovde Citation2012; Sandak et al. Citation2013, Citation2015, Citation2016a), however only few studies used hyperspectral imaging (HI) technique (Agresti et al. Citation2013; Burud et al. Citation2014, Citation2015). An important advantage of HI over traditional spectroscopy is that spectra are spatially resolved. As a consequence, it becomes possible to analyse earlywood and latewood separately.
The goal of this research was to investigate the kinetic of the degradation rate of wooden samples exposed to natural weathering for a short term. A special focus was directed to further understand differences in degradation mechanisms between early and latewood.
Experimental methods
Samples
Experimental samples were prepared from one piece of Norway spruce wood (Picea abies L. Karst.) on the slicing planner (Marunaka, Super MECA-S, Marunaka Tekkonsho Inc., Shizuoka, Japan). The spruce wood was selected due to its relatively low resistance to degradation. Such choice allowed observation of changes in chemical and physical properties of wood exposed for relatively short time. The thickness of samples was ∼100 μm, which is corresponding to 3–4 layers of cells (Havimo, Rikala, Sirviö and Sipi Citation2008). The efficient surface exposed to weathering was 30 × 35 mm2 (width × length, respectively). Such sample configuration assures simple handling during exposure and laboratory characterisation. Samples before the weathering test as well as after collection were conditioned in the climatic chamber (20°C, 60%RH) to the equilibrium moisture content of ∼12%.
Weathering process
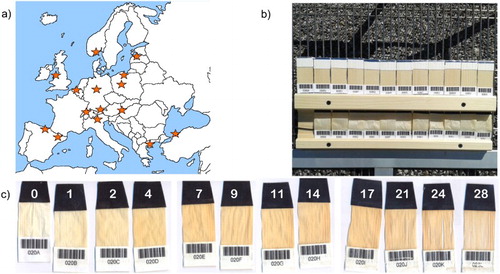
Twenty-five sets of samples were exposed at 15 locations in Europe following the Round Robin test organised by the COST Action FP1006 (a). The geographical locations covered six different climatic zones as classified according to Köppen-Geiger approach (Rubel and Kottek Citation2010). Samples were collected after 0, 1, 2, 4, 7, 9, 11, 14, 17, 21, 24 and 28 days of weathering (samples ‘A’ to ‘L’, respectively). The meteorological data in some locations were collected by the local meteo stations located at the exposure site. Alternatively, historical weather data were downloaded from the web service by selecting the meteorological station closest to the site. Samples were exposed toward south direction; however, in some locations more than one sample set was tested (against other cardinal directions). One sample set was stored in a dark climatic chamber during the whole duration of the test and served as reference. b presents the image of the complete sample set after installation on day 0 of weathering.
1 Locations of sites where the Round Robin tests were performed a, test set-up for samples during weathering b and change in appearance of the wood samples from day 1 to day 28 in San Michele (Italy) c
Hyperspectral imaging
Hyperspectral imaging of the wood samples was conducted using a Mercury Cadmium Telluride (MCT) detector camera, covering the near infrared (NIR) wavelength region 1000–2500 nm distributed on 256 channels (Specim, Oulu, Finland). One dimension of the detector is used for the spectral decomposition of a corresponding pixel, while the other for spatial imaging. As a consequence, only one line over the sample surface is recorded at each frame. The second spatial dimension is obtained by moving the camera over the sample using a translation stage. It was possible to scan the whole surface in less than 5 s, assuming that 100 frames were scrutinised. The spatial resolution of the set-up was 150 µm. The small thickness of the samples (100 µm) allowed HI acquisition in transmission mode, by using halogen lamps as light source placed below a white semi-transparent glass plate. A transparent glass plate which is also transparent for NIR wavelengths was placed above the samples in order to obtain a flat surface for the imaging.
Hyperspectral image files are composed of several spectrally resolved 2D-images of the sample, called a hypercube. The structure of the hypercube X is (M × N × λ) where the M and N axes represent spatial information and the λ axis correspond to the spectral pattern. The quality of the raw data was affected by instrumental variations and varying light conditions, thus pre-processing of the spectra was required. Subtraction of dark frames was performed to correct for pixel to pixel variations in the detector, and a flat field division was conducted using an image of the white semi-transparent glass plate without samples on. Matlab (Mathworks) and PLS Toolbox (Eigenvector) were used for data processing and evaluation. Interpretation of the spectra and band assignments were performed according to the literature (Schwanninger, Rodrigues and Fackler Citation2011).
Results and discussion
The visual appearance of the samples changed within a relatively short period of natural weathering. c presents an image of samples exposed to the north in San Michele (Italy). It was noticed that the colour of the wood samples become yellowish and fibres were removed from the surface with the progress of degradation.
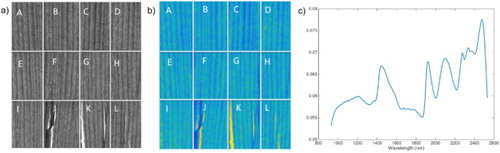
The understanding of latewood–earlywood degradation kinetics and mechanisms of chemical changes was the primary motivation for scanning samples with hyperspectral imaging camera. Although this technology has demonstrated its great potential for characterisation of biological materials, its application is often limited due to high quantity and complexity of the generated data. Several image classification techniques might be used in order to extract information from hypercubes. presents a mosaic of images representing 12 weathered wood samples as seen at the NIR band of λ = 980 nm. The samples are ordered according to the exposure time; the control sample not exposed to weathering (A) is at the top left corner, and the last one being exposed for 28 days (L) in the lower right corner (a and b). Note that more cracks appear in the samples with the progress of weathering. The earlywood and latewoods can be distinguished on the images as vertical stripes of varying lightness (light grey/dark grey, light blue/dark blue). Principal component analysis on this mosaic image clearly corresponds to the signatures for earlywood and latewood in its first component, hence the most significant signal in the hyperspectral cube. The outline of the first principal component PC1 scores (explaining 94.2% of variance) is presented in b together with the corresponding loading plot (c). The second principal component PC2 explains 4.3% of the variance. It was found, however, that the information is related mostly to the colour variations due to inhomogeneities of illumination and measurement noise. All the following principal components were considered as negligible.
2 Mosaic of wood sample images after natural weathering between 0 and 28 days; grayscale of light transmission at 970 nm a, scores on PC1 b and PC1 loadings c
Two diverse classification algorithms were applied in order to visualise the separation between earlywood and latewoods; Partial Least Square Discriminant Analysis (PLS-DA) and K-means classification.
The algorithm of PLS-DA uses the manually selected classes of spectra and predicts corresponding classes to the remaining spectra in the dataset. Two classes (earlywood and latewood) were defined on no-weathered sample A when setting-up PLS-DA model. An additional class was selected for pixels corresponding to the material deficiency due to cracks. It should be noted that the earlywood/latewoods are also clearly discriminated on the samples exposed to weathering for very short time periods. On the other hand, most latewood zones on samples exposed to longer-time weathering were clearly misclassified by PLS-DA and were considered as similar to earlywood. This indicates that chemical changes to wood due to weathering (as recorded in NIR spectra) homogenise the surface along woody polymers degradation. Therefore even if PLS-DA does not seem as a perfectly suitable method to classify the overall mosaic of samples with different weather exposure, it can be used as a method to demonstrate the spectral differences along the degradation progress.
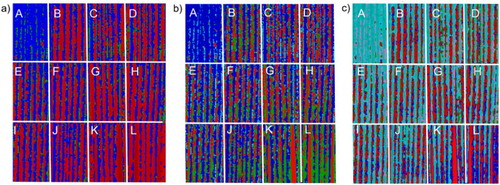
The K-means classification is a non-supervised algorithm, meaning that differently from the PLS-DA, the user does not specify any reference spectra defining classes. The only input of the user is to set a number of classes to be derived from the dataset. The algorithm separates spectra corresponding to each pixel on the image into a number of classes, without any pre-definition, and based on the statistical information inherent in the image. The advantage of K-means classification method is that the algorithm includes analysis of all pixels on the image. Therefore, the method is not sensitive to the number of labelled samples, but only to the relationship between clusters and classes (Ablin and Sulochana Citation2013). The result of K-means classification of the mosaic image is presented in assuming pre-selection of 3, 4 and 5 classes. It was evidenced that the spectral signature of both earlywood and latewood changed over time. The spectral pattern of earlywood as recorded in HI data changed already after one day of exposure. The differentiation was progressing to the end of test period, when ultimately latewood become similar to the class of weathered earlywood.
3. K-means clustering on the mosaic of weathered wood after pre-selecting 3 a, 4 b and 5 classes c
The apparent differences between averaged spectra corresponding to pixels representing earlywood and latewood before weathering and at the final stage are noticed in the range between 1830 and 1907 nm; related to –OH groups of cellulose and in –C=O of hemicelluloses, respectively. Other bands assigned to carbohydrates, such as 2291 and 2328 nm (related to C–O, –OH and C–H stretching) were also clearly identified. Surprisingly, spectra variations in the lignin peaks (1685, 1672 and 2267 nm) were not as apparent as for other woody polymers, even if a track of such lignin modification is visible especially in case of earlywood. The intensity of changes related to specific functional group of wood polymers by means of NIR spectra was also recently investigated (Sandak et al. Citation2016b). However due to limits of FT-NIR spectrometer (equipped with fibre optic), it was not possible to differentiate between early and late wood degradation kinetic. In the following work of authors (Burud et al. Citation2016) additionally to HI analysis, lignin and holocellulose content were estimated on weathered samples separately for early and latewood using a thermogravimetric analysis (TGA). It was proved that the thermogravimetric curves showed a clear trend with the progress of weathering of the samples, for both earlywood and latewood. This indicates that NIR spectroscopy can also be used to model lignin content in the wood and additional experiments are currently carried out in order to understand detailed mechanisms of the weathering process.
Conclusions
Satisfactory performance of timber members can be achieved by combining proper design, careful assembly and maintenance, and, if applicable, chemical treatment and appropriate coating. Understanding the mechanisms of weathering and the role of the altering factors is fundamental to assess the actual conditions of timber structures. It is also essential to predict the future performance, and, possibly, to ensure a long-term preservation and maintenance. New developments in the field of optics and electronics allow detailed and precise characterisation of the materials.
Hyperspectral imaging was successfully used here to evaluate thin wooden samples exposed to weathering for relatively short time. The approach for measurement of NIR absorbance spectra in transmission mode was, according to author’s knowledge, a pioneer work as applied to wood. The HI system can be easily reconfigured and adapted to specific needs. It is foreseen that the hyperspectral imaging techniques will be implemented for in-field evaluation of structures in service.
The current results of the weathering monitoring confirm the state-of-the-art knowledge but provides more details as regarding kinetics of the woody polymers degradation at the early and latewood levels.
PLS-DA was used to demonstrate the spectral differences along the degradation progress. K-means classification evidenced that the spectral signature of both earlywood and latewoods changed over time. Chemical pattern recorded in hyperspectral data changed already after one day of exposure as noticed in the earlywood zone. The differences between averaged spectra corresponding to pixels representing earlywood and latewood before weathering and at the final stage showed that chemistry of all wood polymers changed over a relatively short time of exposure. In the case of lignin changes were more apparent in the earlywood zones. The detailed chemical composition is now under investigations by means of TGA.
Future work
The Round Robin test initiative of the COST action FP1006 is recently concluded. Authors are currently developing dose–response model based on combination of meteorological data acquired in selected locations and specific characteristics of evaluated samples. The follow-up of this test is continued in collaboration with COST Actions FP1303 and FP1407 as well as BIO4ever project (www.bio4everproject.com). The know-how derived from the presented research is directly implemented in to studies on other bio-based materials. On this base, dedicated numerical models for simulation of the functional and aesthetical performance are generated. The software tools allow computation of the bio-materials’ service life period, including maintenance/renovation scheduling.
Acknowledgement
This work has been conducted within Round Robin test initiative of the COST FP1006 ‘Bringing new functions to wood through surface modification’, STSM funded by COST FP1101 ‘Assessment, Reinforcement and Monitoring of Timber Structures’ and the project BIO4ever RBSI14Y7Y4 funded within a call SIR financed by MIUR.
References
- Agresti, G., Bonifazi, G., Calienno, L., Capobianco, G., Lo Monaco, A., Pelosi, C., Picchio, R. and Serranti, S. 2013. Surface investigation of photo-degraded wood by colour monitoring, infrared spectroscopy, and hyperspectral imaging. Journal of Spectroscopy. 2013, Article ID: 380536, 13. doi:10.1155/2013/380536.
- Ablin, R. and Sulochana, C. H. 2013. A survey of hyperspectral image classification in remote sensing. International Journal of Advanced Research in Computer and Communication Engineering. 2(8): 2986–3000.
- Burud, I., Gobakken, L. R., Flø, A., Kvaal, K. and Thiis, T. 2014. Hyperspectral imaging of blue stain fungi on coated and uncoated wooden surfaces. International Biodeterioration & Biodegradation. 88: 37–43. doi: 10.1016/j.ibiod.2013.12.002
- Burud, I., Gobakken, L. R., Flø, A., Kvaal, K. and Thiis, T. 2015. Hyperspectral near infrared of wooden surfaces performed outdoors and indoors. NIR News. 26(1): 4–7. doi: 10.1255/nirn.1500
- Burud, I., Smeland, K. A., Liland, K. H., Thiis, T. K., Sandak, J., Sandak, A. and Gobakken, L. R. 2016. Weather degradation of thin wood samples. IRG Annual Meeting, IRG/WP 16-20578, ISSN 2000-8953.
- Havimo, M., Rikala, J., Sirviö, J. and Sipi, M. 2008. Distributions of tracheid cross-sectional dimensions in different parts of Norway spruce stems. Silva Fennica. 42(1): 89–99. doi: 10.14214/sf.266
- Jelle, B. P., Ruther, P. and Hovde, P. J. 2012. Investigations of accelerated climate aged wood substrates by Fourier transform infrared material characterization. Advances in Materials Science and Engineering Impact Factor. 2012, Article ID: 827471, 6. doi:10.1155/2012/827471.
- Kataoka, Y., Kiguchi, M., Fujiwara, T. and Evans, P. D. 2005. The effects of within-species and between-species variation in wood density on the photodegradation depth profiles of sugi (Cryptomeria japonica) and hinoki (Chamaecyparis obtusa). Journal of Wood Science. 51: 531–536. doi: 10.1007/s10086-004-0685-4
- Mohebby, B. and Saei, A. M. 2016. Effects of geographical directions and climatological parameters on natural weathering of FIR wood. Construction and Building Materials. 94: 684–690. doi: 10.1016/j.conbuildmat.2015.07.049
- Pandey, K. K. 2005. Study of the effect of photo-irradiation on the surface chemistry of wood. Polymer Degradation and Stability. 90(1): 9–20. doi: 10.1016/j.polymdegradstab.2005.02.009
- Rubel, F. and Kottek, M. 2010. Observed and projected climate shifts 1901–2100 depicted by world maps of the Köppen-Geiger climate classification. Meteorologische Zeitschrift. 19: 135–141. doi: 10.1127/0941-2948/2010/0430
- Sandak, J., Sandak, A., Pauliny, D., Riggio, M., Bonfà, S. and Meglioli, S. 2013. A multi sensor approach for prediction of weathering effects on exposed timber structures. Advanced Materials Research. 778: 794–801. doi: 10.4028/www.scientific.net/AMR.778.794
- Sandak, J., Sandak, A. and Riggio, M. 2015. Characterization and monitoring of surface weathering on exposed timber structures with multi-sensor approach. International Journal of Architectural Heritage. 9(6): 674–688. doi: 10.1080/15583058.2015.1041190
- Sandak, A., Sandak, J. and Riggio, M. 2016a. Assessment of wood structural members degradation by means of infrared spectroscopy: an overview. Structural Control and Health Monitoring. 13(3): 396–408. doi: 10.1002/stc.1777
- Sandak, A., Sandak, J., Burud, I. and Gobakken, L. R. 2016b. Weathering kinetics of thin wood veneers assessed with NIR. Journal of Near Infrared Spectroscopy. doi:10.1255/jnirs.1230.
- Sandberg, D. 2005. Weathering of radial and tangential wood surfaces of pine and spruce. Holzforschung. 53(4): 355–364.
- Sandberg, D. and Söderström, O. 2006. Crack formation due to weathering of radial and tangential sections of pine and spruce. Wood Material Science and Engineering. 1(1): 12–20. doi: 10.1080/17480270600644407
- Schwanninger, M., Rodrigues, J. and Fackler, K. 2011. A review of band assignment in near infrared spectra of wood and wood components. Journal of Near Infrared Spectroscopy. 19: 287–308. doi: 10.1255/jnirs.955
- Tsuchikawa, S., Inoue, K. and Mitsui, K. 2003. Spectroscopic monitoring of wood characteristics variation by light-irradiation. Forest Products Journal. 54(11): 71–76.
- Tolvay, L. and Faix, O. 1995. Artificial ageing of wood monitored by FTIR spectroscopy and CIE colour measurements. Holzforschung. 49: 397–404. doi: 10.1515/hfsg.1995.49.5.397
- Wang, X. and Wacker, J. P. 2006. Using NIR spectroscopy to predict weathered wood exposure times, in Proceedings of 9th World Conference on Timber Engineering, 3, 2636–2639, Portland, OR, USA, Curran Associates, Inc.
- Williams, R. S., Knaebe, M. T., Sotos, P. G. and Feist, W. C. 2001a. Erosion rates of wood during natural weathering. Part I: effects of grain angle and surface texture. Wood and Fiber Science. 33(1): 31–42.
- Williams, R. S., Knaebe, M. T. and Feist, W. C. 2001b. Erosion rates of wood during natural weathering. Part II: earlywood and latewood erosion rates. Wood and Fiber Science. 33(1): 43–49.
- Williams, R. S., Knaebe, M. T., Evans, J. W. and Feist, W. C. 2001c. Erosion rates of wood during natural weathering. Part III: effect of exposure angle on erosion rate. Wood and Fiber Science. 33(1): 50–57.
- Williams, R. S. 2005. Weathering of wood. In: Rowell, R. M. (ed). Handbook of Wood Chemistry and Wood Composites. Boca Raton: CRC Press.
- Yata, S. and Tamura, T. 1995. Histological changes of softwood surface during outdoor weathering (in Japanese). Mokuzai Gakkaishi. 41: 1035–1042.