
 ?Mathematical formulae have been encoded as MathML and are displayed in this HTML version using MathJax in order to improve their display. Uncheck the box to turn MathJax off. This feature requires Javascript. Click on a formula to zoom.
ABSTRACT
Carpentry joints are very common in existing timber structures and they may gain attention for contemporary structures, due to their high degree of reversibility. Therefore, reliable Finite Element (FE) models for carpentry joints can contribute to assessing their capacity and provide a better insight into the parameters influencing their mechanical properties. This paper presents a FE study (using Abaqus) of timber halved-and-tabled scarf joints, together with experimental results. The FE-model considers fracture due to combined shear and tension perpendicular-to-grain by using cohesive zone modelling. Experimental tests on spruce solid timber specimens were performed to validate the model. The specimens were constructed by the use of a CNC-machine. For comparative purposes, two handmade specimens were tested, resulting in a lower load capacity. The FE results showed that initial gaps have a considerable effect on capacity. For certain assumed initial gaps, the FE-model could predict the capacity, however, it underestimated the deformation.
Introduction
Background
The preservation of existing timber structures has become increasingly popular in recent years, not only because of their often historical or cultural value but also due to the need for greater sustainability. Instead of only constructing structures and replacing them with new ones once their design lifespans have been reached, more measures are being taken to ensure that they last longer. These measures involve assessment, rehabilitation, and reinforcement techniques. One of the main challenges with respect to existing structures is the connections.
Carpentry connections are a very common jointing technique in existing structures. Some examples are step joints (see e.g. Verbist et al. Citation2017; Siem Citation2017), mortice and tenon connections (see e.g. Shanks et al. Citation2008), dovetail connections (see e.g. Tannert et al. Citation2011) or scarf joints (see e.g. Karolak et al. Citation2020), to name just a few (see ; Ehlbeck et al. Citation1995, Blaß and Sandhaas Citation2017).
Figure 1. Example of carpentry connections: (a) step joint (Ehlbeck et al. Citation1995); (b) mortise and tenon connection (Ehlbeck et al. Citation1995); (c) dovetail connection (Blaß and Sandhaas Citation2017).
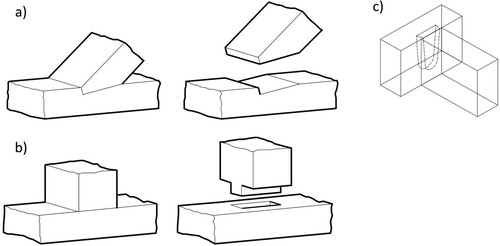
Although there is a great variety of such connections, they share something in common: they transfer stresses by contact. Moreover, most of them share some failure modes: fracture along the grain of notched details due to a combination of shear and tension perpendicular to grain or compressive failure in the contact areas due to compressive stresses acting parallel, perpendicular or at an angle to the grain direction. Design rules for such connections are not available in the present version of EN1995-1-1 (CEN Citation2004), but some rules are expected to be included in its revised version (CEN Citation2021). These rules take into account the geometry and the strength of the material, however, the influence of constructional imperfections, for example, gaps, is not accounted for. Therefore, in order to study such effects, Finite Element (abbr. FE) models may be used. Of particular interest are models that can take into account fracture due to a combination of shear and tensile stresses perpendicular to grain. Such FE models can also be particularly useful, when considering the assessment of carpentry connections in existing structures. This is because imperfections are inherent in existing structures due to e.g. fabrication by hand, imperfections that emerged during the construction, or imperfections due to the actual climatic conditions on-site such as dimensional changes, moisture-induced cracks, creep deformations, or decay.
In addition, a revival of carpentry connections as a mainstream construction technique may occur for two reasons. The first one is the emergence of modern, automated fabrication techniques such as Computer Numerical Control (abbr. CNC) machines which can produce parts with precise dimensions. The second reason is the fact that carpentry connections are, by nature, reversible to a great extent since they do not rely on glue or mechanical fasteners. The reversibility of connections is expected to gain increased focus since concepts such as Design for Disassembly (abbr. DfD) and re-usability of structural components have emerged to reach the goal of increased sustainability and resource efficiency in the construction sector.
This paper presents a pilot FE study of halved and tabled scarf joints (also referred as ‘tenoned scarf joints’) together with experimental results, which are used as a benchmark to FE simulations. Halved and tabled scarf joints can carry tensile loads and, as such, they differ from many other typical carpentry connections, which can carry mainly compressive loads. Load-carrying in tension is far more challenging for carpentry connections, and therefore they are much less common in practice compared to connections that can carry compressive loads. On the other hand, halved and tabled scarf joints are suitable to verify FE models that simulate the fracture due to shear and tension perpendicular to the grain (i.e. cohesive zone models), as these are the stresses acting in the heel of this joint type. The scope of this study is limited to this type of scarf joints and the interested reader is kindly referred to (Karolak et al. Citation2020) for a detailed state of the art on scarf joints.
A series of FE modelling approaches for carpentry joints have been proposed in the literature. A simple approach is to assume linear elastic material models and contact between the parts; see for example (Villar-García et al. Citation2019) for step joints and (Tannert et al. Citation2011) for dovetail connections. Such models are typically used to predict elastic stress distributions and concentrations, or they may be coupled with phenomenological failure criteria, e.g. (Hankinson Citation1921; Norris Citation1962; Tsai and Wu Citation1971). Moreover, inelastic material models have been used to capture plastification of wood in compression, see e.g. (Sha et al. Citation2019; Feio et al. Citation2014) for mortice and tenon joints. Additionally, FE modelling of mortice and tenon joints has shown that a gap between parts has some effect on the load-carrying capacity (Sha et al. Citation2019).
When it comes to halved and tabled scarf joints, some experimental studies exist, see e.g. (Aira et al. Citation2015; Sangree and Schafer Citation2009), or (Jeong Citation2021) for a variation from Korea. Moreover, FE model results have been presented for such joints; see for example (Sangree and Schafer Citation2009; Aira et al. Citation2012). However, these models are based on linear-elastic material modelling and they are not able to capture fracture of wood due to shear and tensile stresses perpendicular to grain.
Outline
This paper presents an experimental and numerical investigation of timber halved and tabled scarf joints. Five different geometries, with varying heel length, tenon and notch size, were tested. These joints did not have a peg (‘key’ or ‘lock’) in the centre. The specimens were fabricated by CNC-machine, except for two, which were hand-made for comparative purposes. The results were used to validate a Finite Element approach by the use of cohesive elements following a bilinear traction-separation law. A quadratic damage initiation criterion was selected for the FE-model in order to take into account the possible interaction between shear and tension perpendicular to grain. Five different gaps were simulated for each geometry of the specimens and their effect on the capacity of the connection was quantified.
Materials and methods
Experimental tests
illustrates a layout of the dimensions of a half of a specimen together with the notation of the various dimensions. All specimens consisted of two symmetric parts.
Figure 2. Specimen dimensions’ notation.
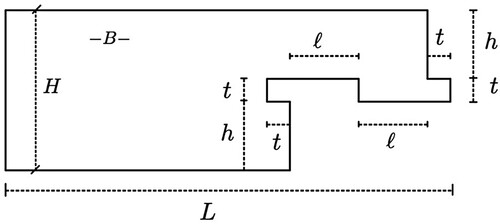
Five series of specimens with different dimensions were tested (series 1–5). summarizes the details for each test series. All specimens were CNC-made (-specimens), except for two specimens in series 4 and 5, which were hand-made (
-specimens) and used for benchmarking. Hand-made specimens were constructed by the use of regular workshop saws. Errors in the dimensions of hand-made specimens were of the order 1–5 mm compared to the given geometries, while the same comparison for the CNC-milled specimens gave errors of the order of 1 mm or less in the vast majority of cases. Indeed, for the CNC-milled specimens, the measured dimensions corresponded very well to the target dimensions.
Table 1. Details of test series.
Norway spruce (Picea Abies) solid timber of strength class C24 according to EN338 (CEN Citation2016) was used in all specimens. The thickness of the specimens was 72 mm. Moisture measurements were taken for all the specimens and the moisture content was 10% on average. Moreover, the specimens were weighted and the average density was determined. The mean density values are given in .
All specimens were tested in axial tension by the use of the experimental set-up shown in . A floor universal testing system with a capacity of 100kN, developed by INSTRON, was used in the tests. In their two ends, the specimens were fastened to the experimental apparatus by the use of steel plates and self-tapping screws, in order to prevent rotation which would introduce eccentric loading in the specimens. All tests were carried out in displacement control. A monotonic constant rate of displacement of 0.5–1.0 mm min−1 until failure was applied to all specimens.
Figure 3. Experimental set-up.
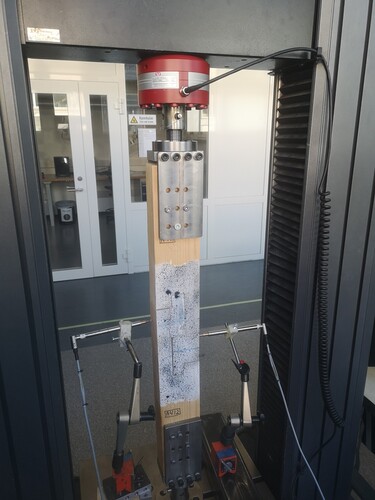
Displacements in the splicing zone were measured by use of Digital Image Correlation (abbr. DIC) and post-processed by use of DIC software, developed by NTNU. To allow for camera measurements, specimens were painted with a special pattern; see also . As a secondary measurement, the horizontal displacements on both edges of the specimen in the middle of the height were measured by using two Linear Variable Displacement Transducers (abbr. LVDTs).
Finite element modelling
Numerical simulations of five specimen types were conducted in the FE software program Abaqus (Dassault Systemes Citation2014). The timber material was described as orthotropic. Thus, nine non-zero independent properties have been used to describe its elastic behaviour. Additionally, the material properties referring to the two directions perpendicular to grain are assumed to be the same. Elastic moduli have been chosen according to EN338, for the class C24 (CEN Citation2016). The Poisson’s ratios have been assumed based on the work of Dahl (Citation2009). The full set of elastic properties employed as input for the numerical simulations are given in , where the grain direction is indicated by the subscript ‘x’, and the transverse directions as ‘y’ and ‘z’.
Table 2. Material properties of wood used as input for numerical simulations.
Five different geometries have been simulated corresponding to the five configurations tested and described in Section “Experimental tests”.
In the model, the leftmost surface in the yz-plane is fixed, to resemble the experimental setup. Additionally, the model is loaded by uniformly applying a displacement along the x-direction on the rightmost surface in the yz-plane (see ), while the displacements in the transverse directions are restrained. The normal behaviour of the interactions has been defined as ‘hard’ contact. Furthermore, a penalty formulation has been employed to describe the tangential behaviour of the interaction contacts between the two timber parts. The friction coefficient has been assumed equal to 0.33 (Massaro and Malo Citation2020). All the matching surfaces between the two parts start in contact at the beginning of the analyses, except in the tenon (see ). Here, a gap is introduced to resemble the imperfections that may occur during the preparation of such type of connections or due to construction and effects of the on-site conditions. For each specimen type, different dimensions of the gap were simulated. Indeed, the simulated gaps range between 0 and 2 mm, with intervals of 0.5 mm.
Figure 4. Location of the cohesive elements and gap (a), mesh and boundary conditions (b) in the numerical model.
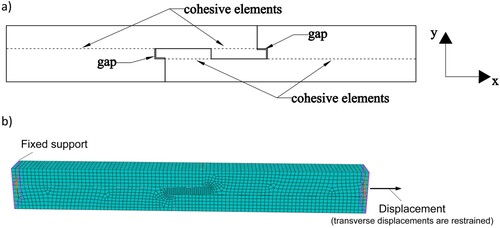
The cohesive zones have been located in the planes where the cracks are expected (see ). The behaviour of the cohesive elements is defined by a traction-separation law, chosen as bilinear. Indeed, the linearity of the softening phase is assumed to improve convergence of the model (Schoenmakers Citation2010). The elastic phase of the traction-separation law is defined by the same stiffness values of the timber parts. Furthermore, a quadratic damage initiation criterion was employed, thus taking into account the interaction between shear and tension perpendicular to grain stresses (Norris Citation1962). The damage initiation criterion is illustrated in Equation (1). Here, each term represents the ratio between the traction and the limit stress, indicated by the subscript ‘max’, in each of the cohesive element directions, respectively. The normal direction to the cohesive element is denoted by the subscript ‘n’, while the subscripts ‘s’ and ‘t’ identify the two tangential directions. Also, the term is enclosed by angle brackets to specify that it can only indicate a tensile traction.
(1)
(1)
The elastic limit stress values of the cohesive elements represent the elastic strengths of the timber material. presents the assumed values for the analysis. The shear strength value has been selected according to Dahl and Malo (Citation2009), while the tension perpendicular to grain strength value
has been based on Dahl (Citation2009). In total, 25 simulations (5 geometries × 5 gaps) are performed, varying the gap dimension.
Table 3. Material properties of the cohesive elements.
After the condition given by the damage initiation criteria is met in the cohesive elements, the damage evolution phase defined by linear softening starts. The critical fracture energy values are based on Ostapska & Malo for Mode I (Ostapska and Malo Citation2020) and Ostapska for Mode II (Ostapska Citation2020), respectively. Furthermore, the mixed mode behaviour is regulated by Wu’s criterion (Wu Citation1967), which has been proved accurate for wooden elements (Jernkvist Citation2001). Wu’s criterion is given in Equation (2), where the fracture energies for mode I and II are denoted by and
, respectively, while the subscript ‘c’ refers to their critical values. The damage initiation and evolution properties of the cohesive elements are summarized in .
(2)
(2) The model consists of three-dimensional, linear, brick elements with full integration (C3D8), for the timber parts, and cohesive elements (COH3D8), both with eight nodes. The softening of the cohesive elements is controlled by a viscosity parameter set, after a sensitivity study, equal to 10−3. The use of the viscosity parameter is recommended by the FE software program Abaqus to help the convergence of the model, even if the parameter has no physical meaning (Ardalany et al. Citation2016).
A sensitivity study on the mesh size was performed and, on its basis, a mesh size of approximately 10 mm was selected for the C3D8 elements (see mesh in ). A minimum of five elements per side was also guaranteed in all the areas of the model. Moreover, the mesh size for the cohesive elements was chosen as 2 mm, in accordance with the Abaqus guidelines.
Results and discussion
Failure modes
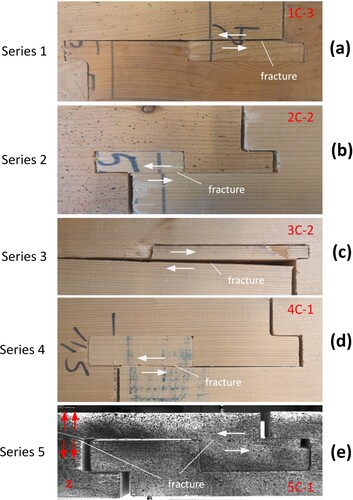
illustrates representative failure modes for each experimental series. As shown in , fracture along the heel length was the most typical failure mode. In most specimens, the crack was straight. However, in a few specimens, the crack was inclined; see for example (e). In some specimens in series 4 and 5, fracture also occurred in the notch; see for example (e).
Figure 5. Representative failure modes for each series.
Force/displacement
presents the force–displacement curves for each experimental series, depicted with dashed lines. Moreover, the capacity, i.e. the maximum force reached during the experiment, is given in for each specimen. In , the reported mean values, with the respective coefficient of variation, refer only to the C-specimens. The hand-made specimens (H-specimens) seem to have a lower capacity, more profoundly in Series 4. Although only two hand-made specimens were tested, and thus a definite conclusion cannot be drawn from the results, this finding may indicate that larger gaps affect the capacity of the connection (see Section “Effect of the gap according to FE model”).
Figure 6. Experimental force–displacement curves and FE predictions.
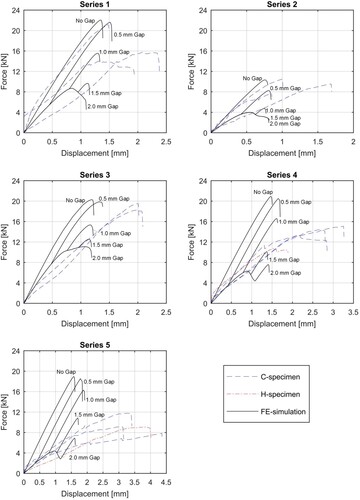
Table 4. Experimental results: maximum load .
The numerical predictions from the finite element simulations are also provided in (continuous lines). The FE model under certain assumptions of the gap can predict with adequate accuracy the capacity of the timber joints. Indeed, shows that the numerical simulations give an interval of capacity values that can predict the experimental mean capacity within the selected gaps. A gap of approximately 0.5–1.5 mm gives the best FE predictions. However, as depicts, the FE-model underestimates the deformation, except for in a few cases.
Moreover, illustrates that several numerical curves show a very localized stiffening effect (increasing slope of the force–displacement curves) due to the effect of the gap closing, while the experimental results depict a more gradual change of the slope.
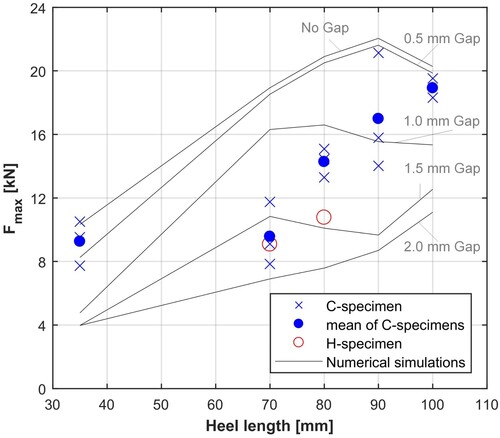
presents the capacity of the specimens as a function of their heel length, both in terms of test results and FE simulations. As shown in , the experimentally measured capacity increases for increasing heel length, and from 70 to 100 mm this takes place in a fairly linear trend. Finally, in , the numerical predictions for all assumed gaps are plotted over the experimental capacities. It can be noted that the FE-predictions for no gap and for 2 mm gap appear as an upper and lower limit, respectively, of the capacity compared to the test results. As also shown in , the FE model predicts the increased capacity for increased heel length in general. However, some variations are observed. This is presumably due to the decreased tenon size for increasing heel length in the different series.
Figure 7. Experimental capacity vs heel length and FE predictions.
Effect of the gap according to FE model
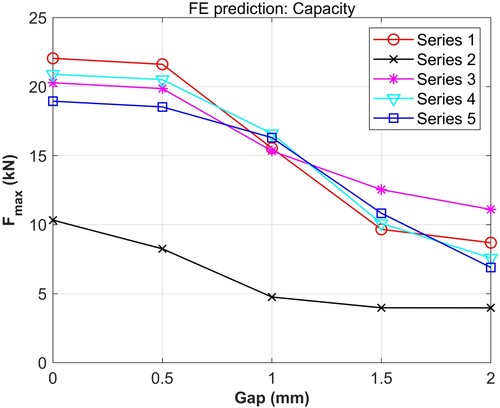
shows the effect of the initial gap on the capacity for each one of the five specimen geometries of the experimental series. As shown in the , an initial gap of the order of 0–0.5 mm has a very small influence on the capacity, except for series 2 which had the smallest heel length. In particular, the capacity reduction due to 0.5 mm initial gap compared to no gap is 2.0% for series 1, 3, 4 and 5 and 20% for series 2. Comparing the capacity for 1.5 mm gap to no gap the reduction in capacity is of the order of 40-60% for all series (57%, 39%, 42%, 52% and 57% for series 1, 2, 3, 4 and 5, respectively). A further increasing initial gap (>1.5 mm) results in a further loss of capacity, especially for series 4 and 5. For series 1, 2 and 3, the capacity tends to converge for increasing values of the gap (more profoundly for series 2), see also . This strong effect of the gap on the capacity highlights the challenge of getting reliable FE predictions, since the gap is a parameter that is difficult to control/measure in practice.
Figure 8. Capacity vs initial gap according to FE results.
Conclusion
A numerical and experimental study on timber halved and tabled scarf joints was presented in this paper. A Finite Element (FE) model that takes into account fracture due to combined shear and tension perpendicular to grain by using a cohesive zone modelling was compared to experimental results on timber halved and tabled scarf joints subjected to tension. All specimens were fabricated by a CNC machine, except for two specimens that were hand-made and were used as benchmarks. The FE model was used to predict the force–displacement curves of the specimens and to investigate the effect of the initial gap on the properties of the joints. The conclusions of the present paper may be summarized as follows:
According to the FE study, the initial gap has a strong influence on the capacity of halved and tabled scarf joints.
The FE model can predict the capacity of the joints for certain assumed values of the initial gap; however, the FE model significantly underestimates the deformation in most cases.
The experimental results show that the capacity increase with increasing heel length, and the corresponding FE predictions show the same trend, although with some variations.
Although the number of hand-made specimens is very small to draw safe conclusions, the experimental results indicate that CNC-produced joints may have higher capacity. This finding is in line with the FE-finding of decreasing capacity for increasing initial gaps since imperfections are presumably more severe for hand-made specimens.
Future work on the topic could be the evaluation of the FE model on halved and tabled scarf joints with inclined bearing surfaces. Furthermore, numerical and experimental evaluation of such joints could be extended to bending loading. The influence of using a peg in the joint may also be evaluated. Finally, the applicability of the FE model in other types of traditional connections which are prone to fracture due to tension and shear (e.g. step joints) should be evaluated.
Acknowledgements
FMM and HS have taken the initiative for the paper. HS has written the introduction and experimental methods with contributions from FMM, JA and EBR. FMM has written numerical methods and results with contributions from HS. FMM has performed and post-processed all numerical simulations and contributed to post-processing of data. HS has supervised the experimental work. JA and EBR have prepared and performed all experiments and contributed to writing the aforementioned parts of the manuscript and to post-processing of data.
Disclosure statement
No potential conflict of interest was reported by the author(s).
References
- Aira JR, Arriaga F, Íñiguez-González G, Guaita M. 2015. Failure modes in halved and tabled tenoned timber scarf joint by tension test. Constr Build Mater. 96:360–367.
- Aira JR, Arriaga F, Íñiguez-González G, Guaita M, Esteban M. 2012. Analysis of the stress state of a halved and tabled traditional timber scarf joint with the finite element method. WCTE 2012 – World Conference on Timber Engineering; Auckland, New Zealand.
- Ardalany M, Fragiacomo M, Moss P. 2016. Modeling of laminated veneer lumber beams with holes using cohesive elements. J Struct Eng. 142(1):04015102.
- Blaß HJ, Sandhaas C. 2017. Timber engineering - principles for design. Karlsruhe: KIT Scientific Publishing.
- CEN. 2004. Eurocode 5: design of timber structures – part 1-1: general rules and rules for buildings, in EN 1995-1-1:2004. Brussels: Comité Européen de Normalisation.
- CEN. 2016. Structural timber - strength classes, in EN 338:2016. Brussels: Comité Européen de Normalisation.
- CEN. 2021. Eurocode 5: design of timber structures – part 1-1: general rules and rules for buildings, in prEN 1995-1-1:20XX. Brussels: Comité Européen de Normalisation.
- Dahl KB. 2009. Mechanical properties of clear wood from Norway spruce. Trondheim: Faculty of Engineering Science and Technology, Department of Structural Engineering, Norwegian University of Science and Technology.
- Dahl KB, Malo KA. 2009. Nonlinear shear properties of spruce softwood: experimental results. Wood Sci Technol. 43(7):539–558.
- Dassault Systemes. 2014. Abaqus/CAE, in Abaqus.
- Ehlbeck J, Kromer M. 1995. Carpentry joints. In: Blaß HJ, Aune P, Choo BS, Görlacher R, Griffiths DR, Hilson BO, Racher P, Steck G, editors. Timber engineering – STEP 1. Almere (NL): STEP/Eurofortech.
- Feio AO, Lourenço PB, Machado JS. 2014. Testing and modeling of a traditional timber mortise and tenon joint. Mater Struct. 47(1):213–225.
- Hankinson RL. 1921. Investigation of crushing strength of spruce at varying angles of grain, in US Air Service information circular, vol. III, no. 259.
- Jeong GY. 2021. Tensile properties of utgulisanji connection. Int J Architect Heritage. 15(2):313–320.
- Jernkvist LO. 2001. Fracture of wood under mixed mode loading: I. Derivation of fracture criteria. Eng Fract Mech. 68(5):549–563.
- Karolak A, Jasieńko J, Raszczuk K. 2020. Historical scarf and splice carpentry joints: state of the art. Heritage Sci. 8(1):105.
- Massaro FM, Malo KA. 2020. Stress-laminated timber decks in bridges: friction between lamellas, butt joints and pre-stressing system. Eng Struct. 213:110592.
- Norris CB. 1962. Strength of orthotropic materials subjected to combined stresses. Madison (WI): Forest Product Laboratory.
- Ostapska K. 2020. Fracture in wood of Norway spruce. Trondheim: Faculty of Engineering Science and Technology, Department of Structural Engineering, Norwegian University of Science and Technology.
- Ostapska K, Malo KA. 2020. Wedge splitting test of wood for fracture parameters estimation of Norway spruce. Eng Fract Mech. 232:107024.
- Sangree RH, Schafer BW. 2009. Experimental and numerical analysis of a halved and tabled traditional timber scarf joint. Constr Build Mater. 23(2):615–624.
- Schoenmakers JCM. 2010. Fracture and failure mechanisms in timber loaded perpendicular to the grain by mechanical connections. Eindhoven: Eindhoven University of Technology.
- Sha B, Wang H, Li A. 2019. The influence of the damage of mortise-tenon joint on the cyclic performance of the traditional Chinese timber frame. Appl Sci. 9(16):3429.
- Shanks JD, Chang W-S, Komatsu K. 2008. Experimental study on mechanical performance of all-softwood pegged mortice and tenon connections. Biosyst Eng. 100(4):562–570.
- Siem J. 2017. The single-step joint – a traditional carpentry joint with new possibilities. Int Wood Products J. 8(sup1):45–49.
- Tannert T, Lam F, Vallée T. 2011. Structural performance of rounded dovetail connections: experimental and numerical investigations. Eur J Wood Wood Prod. 69(3):471–482.
- Tsai SW, Wu EM. 1971. A general theory of strength for anisotropic materials. J Compos Mater. 5(1):58–80.
- Verbist M, Branco JM, Poletti E, Descamps T, Lourenço PB. 2017. Single step joint: overview of European standardized approaches and experimentations. Mater Struct. 50(2):161.
- Villar-García JR, Vidal-López P, Crespo J, Guaita M. 2019. Analysis of the stress state at the double-step joint in heavy timber structures. Mater Construcción. 69(335):e196.
- Wu EM. 1967. Application of fracture mechanics to anisotropic plates. J Appl Mech. 34(4):967–974.