
Abstract
Land application of sewage sludge improves soil physical, chemical and biological properties, minimizes the mineral fertilizer application and reduces maintenance of soil. In this work, various methods to estimate greenhouse gas (GHG) emissions due to land application of sewage sludge described in the literature were summarized and their limitations were presented. Moreover, an improved methodology to evaluate GHG emissions due to the land application of sewage sludge was proposed. Further, based on the proposed methodology, GHG emissions due to land application of sewage sludge at lower, higher and average concentrations of nutrients (carbon, nitrogen and phosphorus) were assessed. The results revealed that GHG emissions substantially decreased when higher nutrients containing sewage sludge were applied to land. For methodologies presented in the literature, GHG emissions or reductions due to land application did not change with nutrients concentrations of sewage sludge. However, based on the proposed methodology GHG emissions or reductions varied according to sludge nutrients concentrations.
1. Introduction
The reduction in greenhouse gas (GHG) emissions is the prime focus and goal of several researchers, scientists, industrialists and municipalities. The radiatively active trace gases in the Earth's atmosphere are called GHGs, which principally include water vapour, carbon dioxide (CO2), methane (CH4), nitrous oxide (N2O) and ozone (O3) (Gohar & Shine, Citation2007). CO2 is used as the basis to calculate the level of relative contribution to global warming potential of each gas. Per molecule, the global warming potential of CH4 and N2O for 100 years is about 28 and 265 times, respectively, more powerful than CO2 (Stocker et al., Citation2013). According to the Intergovernmental Panel on Climate Change (IPCC), population growth, deforestation, factory farming, biomass degradation (from the wastewater treatment plants (WWTPs) and during sludge management) and the widespread use of fossil fuels create excess GHG emissions. These GHGs while in the atmosphere absorb radiation emitted to ground and thus contribute to the global warming and climate change. Alarming levels of global warming and climate change arising from unprecedented release of GHGs have made it essential to quantify GHG emissions from every source.
Sewage sludge is an unavoidable by-product collected from different stages of the wastewater treatment process. In general, specific sludge production varies widely from 35 to 85 g dry solids per population equivalent per day during the wastewater treatment (Ginestet & Camacho, Citation2007). From the existing WWTPs the annual sludge production in USA and Canada is 6 515 × 103 and 550 × 103 Mg dry solids per year, respectively (LeBlanc, Matthews, & Richard, Citation2009). In Europe, during the last decade sewage sludge production has increased significantly (Fytili & Zabaniotou, Citation2008; Heras, Mañas, & Labrador, Citation2005). In China from 2005 to 2010 sludge production steadily rose from 11 × 106 to 21 × 106 Mg per year (sludge with 80.0% water content) (Liu, Wei, Zhang, & Bi, Citation2013). In Taiwan, the prevalence of the public sewage system could reach to 36.0% of the population by 2014, and sewage sludge production could reach up to 1040 Mg/day (Wang, Shih, Chiueh, & Huang, Citation2013). Sewage sludge production has increased by 45.0% in France (i.e. 58 × 104 Mg dry solids per year in 2001 to 13 × 105 Mg dry solids per year in 2005) (Pradel & Reverdy, Citation2012). Moreover, sewage sludge production is expected to increase in the future due to industrialization, population increase, greater volume of water used, higher levels of wastewater treatment and increased stringency of laws for wastewater treatment and disposal.
In general, the common sludge treatment methods are aerobic digestion, anaerobic digestion followed by dewatering and composting, and the common disposal methods are incineration, landfill or land application (). Sludge disposed by different methods in different countries is given in . Sludge treatment and disposal contribute to GHG emissions (Pradel & Reverdy, Citation2012). During sludge treatment, disposal and/or reuse (as fertilizer, biotransformation), sewage sludge is metabolized to soluble or gaseous end-products mainly consisting of CO2, CH4 and N2O (depending upon the environmental conditions). These three gases are considered as the principal GHGs emitted during sludge treatment and disposal routes. Sludge management (treatment, disposal and/or reuse) may account for approximately 40.0% of the total GHG emissions from a WWTP (Brown, Beecher, & Carpenter, Citation2010). GHG emissions from sludge treatment in wetlands are 17×10−3 Mg CO2 equivalent/population equivalent and for the untreated sludge are 0.162 Mg CO2 equivalent/population equivalent (Uggetti, Garcia, Lind, Martikainen, & Ferrer, Citation2012). Landfilling of sewage sludge will contribute GHG emissions of 0.297 Mg CO2 equivalent/Mg of sludge in Taiwan (Wang et al., Citation2013). Among the various disposal methods land application of sludge is the most common method in practice around the world ().
Figure 1. Sludge management with the most common treatment process ‘E’ is the energy required for the process (generated from fossil fuels).
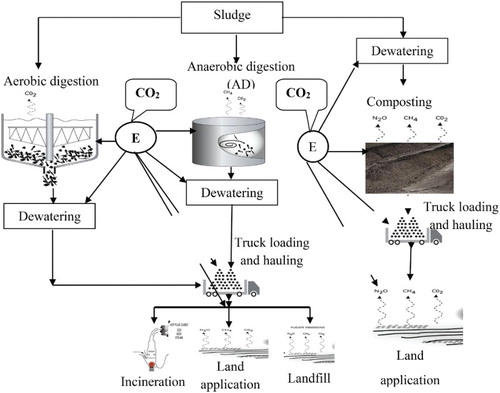
Table 1. Percentage of wastewater sludge by various disposal methods.
1.1. Land application of sewage sludge
Sewage sludge contains a substantial amount of organic matter rich in nutrients such as carbon (C), nitrogen (N) and phosphorous (P), and also provides macronutrients such as potassium and sulphur, and micronutrients such as copper and zinc (Bettiol & Ghini, Citation2011; Singh & Agrawal, Citation2008; Wang, Shammas, & Hung, Citation2008a). The N and P contents in sewage sludge reported by various researchers are summarized in . The concentrations of N and P present in sewage sludge vary depending upon the original effluent composition and the treatment method (Quilbe et al., Citation2005). An extensive study on sewage sludge composition (nutrients composition) was conducted by Basta (Citation1995). It was reported that sewage sludge consists mainly of partially decomposed organic matter (30.0–60.0%) and other significant amount of nutrients required by plants that include N (0.5–10.0%), P (1.0–6.0%), sulphur (0.5–1.5%), calcium (1.0–20.0%), magnesium (0.3–2.0%) and micronutrients such as iron (0.1–5.0%), copper, manganese, and zinc (<0.2%), nickel, boron, cobalt and molybdenum (<0.05%) (Basta, Citation1995). The cost-effectiveness of the land application is evaluated based on the fertilizing value (nutrient content) of sludge. Therefore, land application of sewage sludge is considered to be the most economical (Champagne, Citation2007; Laboy-Nieves, Schaffner, Abdelhadi, & Goosen, Citation2008; Lu, He, & Stoffella, Citation2012; Singh & Agrawal, Citation2008).
Table 2. Nitrogen and phosphorus contents of sewage sludge.
The organic carbon content has been reported in the range of 17.5–25.3% w/w (average 21.4% w/w) of the dry mass for the aerobically digested sludge and in the range of 6.8– 28.5% w/w (average of 17.6%) of dry mass for anaerobically digested sludge (Parker & Sommers, Citation1983). Depending on the sludge solids content, the organic form of the N available is around 50.0–90.0% of the total N of sludge (average total nitrogen is 3.9% on a dry basis) (Sommers, Citation1977). The N components of sludge (identified as proteinaceous, amino acids and hexosamines) are predominantly organic in nature (Epstein, Citation2002). The P content of sludge has often been closer to half of the N content (Johannesson, Citation1999). Moreover, the crop's requirement of P is just 1/10–1/5 of the N requirement (Johannesson, Citation1999).
The land application of sewage sludge refers to spreading sludge on or just below the soil surface with a tilling depth of 15–30 cm (Delgado Arroyo, Miralles de Imperial Hornedo, & Martín Sánchez, Citation2011; Epstein, Citation2002; Lu et al., Citation2012; Wang et al., Citation2008b). Moreover, the land application of sewage sludge has been practised in many countries for centuries (Jiménez et al., Citation2010; Singh & Agrawal, Citation2008). In general, research on land application of sewage sludge has focused on its effects on plant development (Singh & Agrawal, Citation2008; Wang et al., Citation2008b) and also on soil contamination due to heavy metals (Bettiol & Ghini, Citation2011; Haynes, Murtaza, & Naidu, Citation2009; Wang et al., Citation2008b). However, very few studies pertaining to GHG emissions due to land application of sewage sludge are available.
2. Advantages and disadvantages of land application of sewage sludge
2.1. Advantages
The land application of sewage sludge reduces the need for chemical fertilizers and pesticides, increases the crop production and improves soil structure (i.e. enhancement of workability and lower resistance to ploughing and tilling) (Aggelides & Londra, Citation2000; Haynes et al., Citation2009; Singh & Agrawal, Citation2008; Torri & Lavado, Citation2008; Wang et al., Citation2008b). Therefore, fossil fuel (energy) usage in the production of chemical fertilizers and pesticides will be reduced along with corresponding GHG emissions. The fossil fuel (energy) required by the tractors for ploughing, tilling and other activities during irrigation will also be reduced as well as the corresponding GHG emissions. The physical properties of soil such as soil aggregate stability, water holding capacity, porosity and humus content are increased with sewage sludge amendment (Singh & Agrawal, Citation2008). On the other hand, land application of sewage sludge decreases bulk density and erosion of the soil. With sewage sludge amendments the soil organic carbon, electrical conductance, cation exchange capacity and N and P are increased (Singh & Agrawal, Citation2008). The land application of sewage sludge has the potential to increase soil carbon stores and gain credits for carbon sequestration (Singh & Agrawal, Citation2008; Sylvis, Citation2009). The use of compost on soils results in 8.0% of the compost carbon (this equates to 0.13 Mg CO2eq/dry Mg wastewater solids) being sequestered for 100 years (Recycled Organics Unit, Citation2006). A larger mass of carbon sequestration (0.25 Mg CO2eq/dry Mg wastewater solids) was estimated at biosolids land reclamation sites in British Columbia (Sylvis, Citation2009). Sewage sludge also modifies the soil's biological properties (Singh &Agrawal, Citation2008; Torri & Lavado, Citation2008; Wang et al., Citation2008b). Biological properties of soil basically govern the dynamics of the microbiotia, which control the soil ecosystem and its functioning, that is, humus formation, organic matter decomposition, nutrient cycling, physical and other functions.
2.2. Disadvantages
The land application of sewage sludge requires relatively less capital, which is generally lower than other sludge management technologies, however, the process can be labour intensive (Shammas & Wang, Citation2009). The land application of sewage sludge is limited during rainy and snowing weather conditions. Public opposition and odour problems also limit the land application of sewage sludge. The presence of contaminants (metals, etc.) in sludge may also limit the land application. Moreover, the land application of sewage sludge should not affect the groundwater, surface watercourses, wells and other environmentally sensitive features. Contrary to the positive effect of land application of sewage sludge on the microbial activity, there are reports that find a reduction in microbial activity (Baggs, Watson, & Rees, Citation2000; Fernandes et al., Citation2005a; Fernandes, Bettiol, Cerri, & Camargo, Citation2005b; Lu et al., Citation2012). The land application of sewage sludge and its effect on the microbial activity were investigated by researchers by measuring the flux of gases (CO2, CH4 and N2O) at the soil–atmosphere interface (Baggs et al., Citation2000; De Urzedo et al., Citation2013; Fernandes et al., Citation2005a, Citation2005b; Lu et al., Citation2012; Ruíz-Valdiviezo et al., Citation2013). The land application of sewage sludge will provide organic matter and nutrients to the soil, but on the other side the biological processes undergo altercations, and as a consequence, the flux of the gases at the soil–atmosphere interface is also changed.
Sludge land applications increase GHG emissions with increased flux of gases at the soil–atmosphere interface (Baggs et al., Citation2000; Fernandes et al., Citation2005a, Citation2005b; Lu et al., Citation2012). Emerging contaminants (endocrine-disrupting compounds), antibiotics and heavy metals present in sewage sludge will affect the soil microbial flora, and as a consequence will affect the flux of gases at the soil–atmosphere interface.
3. Methods in literature to quantify GHG emissions due to land application of sewage sludge
The estimation methods used by government bodies and researchers to evaluate GHG emissions during the land application of sewage sludge are summarized in . The methane or nitrous oxide emissions will vary vastly depending upon the types of sludge, prevailing moisture content, the ambient environmental conditions and also on the diurnal temperature variations. These factors are not considered in the IPCC estimation methodology. CO2 emissions due to land application are considered as biogenic emissions (IPCC, Citation2007), (since they are generated from biological pathways) and they were not taken into account, due to the fact that they are considered (by convention) ‘carbon neutral’ (global warming potential equal to zero). Indirect CO2 emissions due to fossil fuel utilization during land application are considered. RTI International has estimated the CO2 emissions from the land application of sewage sludge by assuming a constant biomass population (dying and decaying biomass equalling new biomass growth). The CO2 generation rate for the land application will be directly proportional to the carbon application rate to the land treatment unit. This methodology gives an overestimation of CO2 emission, as it presumes the complete conversion of carbon content of sewage sludge to CO2.
Table 3. Description of methods used to estimate GHG emissions due to sludge land application.
The biosolids emissions assessment model (BEAM) was developed by SYLVIS environmental for the Canadian Council of Ministers of the Environment to allow municipalities to estimate GHG emissions from biosolids management. Anthropogenic CO2 emissions are considered for the land application of biosolids, that is, fuel burned for hauling and transporting biosolids to farm fields and during the land application process (e.g. using tractors and spreaders). The fuel used during the land application of biosolids as 3.2 l/Mg dry biosolids applied. CO2 emissions from land due to biosolids are considered as biogenic sources and they are not included in GHG estimation. In BEAM, CH4 emissions from land application of biosolids are considered negligible based on the studies by Ball, Ball, McTaggart, and Scott (Citation2004) and Jones, Rees, Kosmas, Ball, and Skiba (Citation2006). Methane emissions from storage of biosolids before land application are considered in this methodology. The N2O emissions from the land application of the biosolids are evaluated as given in . Reducing the soil maintenance and increasing the water holding capacity will minimize machinery usage and fossil fuels and corresponding GHG emissions. These factors are not considered in estimating CO2 emissions. Increased microbial activity in air pockets formed in the soil will increase the CH4 emissions. N to N2O conversion factors are used in estimating N2O, which will not present the exact emissions due to the land application of sewage sludge. There will be increased N2O flux between atmosphere and soil interface due to the land application of sewage sludge, which need to be considered in estimating N2O emissions.
Several other researchers have evaluated GHG emissions during the life cycle analysis of sewage sludge management (considering land application or agriculture application as sludge disposal option) (). Lundin, Olofsson, Pettersson, and Zetterlund (Citation2004) have considered P and N presented in sludge replaces mineral fertilizer. Energy savings due to the replacement of mineral N (by sewage sludge) was less than the energy required for the pasteurization, transportation and spreading of sewage sludge. These resulted in higher CO2 and N2O emissions due to the land application of sewage sludge. However, it was assumed that CH4 emissions due to the land application were −0.012 kg/Mg of dry solids without explaining the details. Fernandes et al. (Citation2005a) concluded that there will be increased flux of CO2 and N2O gases from the land applied of sewage sludge. On the other hand, some of the N and P present in sewage sludge will be utilized by plants as a source for their development. It is unclear if the land application of sewage sludge corresponds to either GHG emissions or GHG reductions. Moreover, the sewage sludge application will change the physical properties of the soil, which will affect GHG emissions. Therefore, in this study a methodology was developed (by considering possible factors responsible for GHG reductions and GHG emissions) to evaluate precise net GHG emissions due to the land application of sewage sludge.
4. Proposed methodology for the quantification of GHG emissions due to land application of sewage sludge
There are many limitations in GHG estimation methods (). In this proposed methodology, net GHG emissions (GHG reductions-GHG emissions) due to the land application are considered. The land application of sewage sludge reduces GHG emissions due to the following reasons: (i) replacing the synthetic fertilizers, (ii) carbon sequestration in soil, (iii) additional water holding capacity of soil, (iv) improved tillage and workability of soils and (v) photosynthetic absorption of CO2 by crops. On the other hand, the land application of sewage sludge increases the flux of gases at the soil–atmosphere interface. Further, the energy required during the land application of sewage sludge will contribute to GHG emissions. Therefore, the net GHG emissions due to the land application of sewage sludge are evaluated using Equation (1).(1)
4.1. Reduction in GHG emissions due to replacement of synthetic fertilizers
The type of sludge and the N and P contents on the dry basis were presented in . The US Department of Agriculture and University of Minnesota have conducted extensive research on the use of sewage sludge from crop production and revealed that land-applied sewage sludge produces high crop yields and high-quality crops similar to commercial fertilizer. Fossil fuels are mainly used during chemical fertilizer production, which is accountable for GHG emissions. During fertilizer application to soil, various fossil fuel-consuming machinery is also used, further contributing to GHG emissions. The land application of sewage sludge will minimize the use of chemical fertilizers and machinery, thereby offseting fossil fuels and thus reducing GHG emissions. The production of 1 kg N synthetic fertilizers produce a total of 5645 g of CO2 equivalents (Flessa et al., Citation2002) and 1 kg of P synthetic fertilizer generates 165 g CO2 equivalents (Wood & Cowie, Citation2004). The N present in organic fertilizers normally exists in two forms: (i) ammonium-N, which is readily available for plant uptake and (ii) organic-N compounds, which are less available to plants. Therefore, the amount of ammonium-N relative to the total N content will determine the N availability in the organic fertilizer. The N availability also depends upon the moisture content of sludge. In general, the N-nutrient value of organic fertilizers varies in the range of 20.0–50.0% of the available total N content (http://www.northwaymushrooms.com/organic-fertilizers-a-valuable-commodity/). Therefore, N available for the plants was considered as a function of the N mineralization rate, which was 30.0% (Fernandes et al., Citation2005a). In the case of P, organic fertilizers can generally be considered as 100.0% available (i.e. each kg of P applied in organic fertilizer can replace 1 kg P from chemical fertilizer) (http://www.northwaymushrooms.com/organic-fertilizers-a-valuable-commodity/). The GHG reductions due to synthetic fertilizer replacement by sewage sludge are evaluated as per Equation (2).
GHG reductions due to N replacement + reductions due to P replacement(2)
where ‘’ Mg/yr of dry sewage sludge applied to the land, %N and %P represent the amount contained in sewage sludge on dry weight basis.
4.2. GHGs reduction due to carbon sequestration in soil
The average organic carbon content of aerobically digested sludge is 21.4% w/w and that for anaerobically digested is 17.6% w/w (Parker & Sommers, Citation1983). When sludge is applied to the land, the organic matter immediately begins to decompose by the soil microbes as well as by those in sludge, provided that the temperature is above freezing and there is sufficient moisture. Determination of carbon sequestration from sewage sludge to soil is difficult, because of the many factors that affect the longevity of the sequestration, that is, tilling, precipitation, air, runoff, soil temperature, pH, etc. Most of the carbon of sewage sludge applied to the soil will eventually be converted to CO2 and CH4 depending upon the aerobic and anaerobic pockets, but some carbon remains in the organic matter. To the best of our knowledge, there are no reports available to date on this value (i.e. carbon remained in the organic form in the soil). When sewage sludge compost is applied to soils, it is assumed that 8.2% carbon of the compost remains in the soil for 100 years or more (NEBRA, Citation2008). Even though sewage sludge and sewage sludge compost are entirely two different things, however, the application of sewage sludge in the soil will eventually undergo aerobic, facultative and anaerobic degradation process by the soil and sludge microbes, similar to a composting operation. Therefore, in the absence of the real data of carbon sequestration from sewage sludge, the same percentage (as that of compost) of carbon can be assumed as carbon sequestration credit for direct sewage sludge application to soil. This GHG reductions can be calculated as per Equation (3).
GHG reductions due to carbon sequestration(3)
where, ‘’ Mg/yr of dry sewage sludge applied on land and
organic carbon content in sewage sludge (g/g).
4.3. GHG reductions due to additional water holding capacity of the soils
Land application of sewage sludge improves the soil structure. The organic matter present in sewage sludge will improve water holding capacity of the soil. Depending upon the region, soil type, soil texture and compost application rate, the compost can save more than 30.0% of irrigation water and thereby reduces GHG emissions related to the electrical energy requirement for supplying that extra water through irrigation systems (Compost Australia). The application of compost can save between 0.13 and 0.95 mL of water per hectare per year, depending on crop and soil types (Compost Australia, http://www.wmaa.asn.au/lib/pdf/05_d/ca/dca_1212_capabilitystatement.pdf).
A mixture of sewage sludge and fly ash applied to the soil increased the water holding capacity from 53.0% to 58.5% (Veeresh et al., Citation2003). In the absence of practical study of the extra water holding capacity of the soil due to sewage sludge application to agricultural land, the same degree of water holding capacity as that of the compost can be assumed for the computation. Irrigation water requirements will significantly reduce due to the compost application. When sewage sludge compost with a thickness of 53.40 mm is applied over the soil, it will save 0.251 m3 of water/m3 of sludge compost (NEBRA, Citation2008). Moreover, it is reported that 9.25 kWh electricity is required per cubic metre of water for agricultural use (E2, Citation2007). If the water content of sludge before land application is X%, sludge bulk density is Y kg/m3, then GHGs reduction due to irrigation water saving due to application of Mg/yr of dry sewage sludge can be calculated as per Equation (4).
GHG reductions due to water holding capacity of soil.(4)
where ‘κ’ is the national emission intensity coefficient 0.53 × 10⁻³ Mg CO2/kWh (developed by an Environment Canada study based on a Resources for the Future (RFF) model).
4.4. GHGs reductions due to improved tillage and workability of soils
Due to the availability of nutrients, sewage sludge will restore the health of the soil by building organic matter and tilth, and it will also improve the soil's physical and chemical properties (Torri & Lavado, Citation2008). The change in physical and chemical properties will reduce the management and maintenance required due to the fact that the machinery will pass through the soil (after sewage sludge application) more easily. This will result in the reduction in the fossil fuel consumption from machinery and therefore will result in lower GHG emissions. There are no available quantitative data on this aspect, but it is assumed that the improvement of tillage and workability will reduce the tractor fuel consumption by 5.0%. This assumption of 5.0% reduction in fuel consumption is based upon the difference in fuel consumption between hard soil and soft soil (Moitzi, Weingartmann, & Boxberger, Citation2006). Due to the sewage sludge application the hard soil will behave like a soft soil. The average fuel consumption of hard soil is 12.80 L/ha (Moitzi et al., Citation2006) and emission factor for fuel is 2.73 kg CO2/L of diesel (Gassara et al., Citation2011). Therefore, GHG reductions when sludge is applied with an average thickness of 53.40 mm can be calculated as per Equation (5).
GHG reductions due to improved tillage and workability(5)
where ‘’ Mg/yr of dry sewage sludge applied to land, water content of sludge before land application is X% and Y is sewage sludge bulk density in kg/m3.
4.5. GHGs reductions due to photosynthetic absorption of CO2 by crops
It was concluded that the land application of sewage sludge produce high crop yields and high-quality crops similar to commercial fertilizers(based on three to seven years of field study by the US Department of Agriculture and University of Minnesota). Clapp, Stark, Clay, and Larson (Citation1986) reported increased yield for several crops with sewage sludge land application as fertilizer compared to commercial NPK (nitrogen, phosphorus and potassium) fertilizers, (38.0% increase for corn fodder, 51.0% for grain and 14.0% of reed canary grass). Similarly, Togun, Akanbi, and Dris (Citation2003) reported an increase of 28.0% yield of tomato due to sewage sludge land application (tomato yield increased from a typical average of 14.40 Mg/ha yield to 18.50 Mg/ha). The effect of sewage sludge amendment on growth, yield and heavy metal accumulation in plants is reported by various researchers and is summarized by Singh and Agrawal (Citation2008). An increase in crop yield signifies higher carbon sequestration (or GHG minimization) due to photosynthetic CO2 absorption by plants and crops. The land application of sewage sludge was studied by Kharub (Citation2012) and reported a positive effect on the emergence and growth of Abelmoschus esculentus. Thus, an increase in the yield of plants growth and crops due to sewage sludge application will reduce GHG emissions compared to the control (without sewage sludge application). The extra carbon sequestration will be due to additional growth of plants (leaves, stem, branches, etc.) and for additional yield of crops (fruits, grains, etc.). If sewage sludge is applied on dry basis ( in Mg/yr) with an average thickness of 53.40 mm, GHGs reduction due to additional photosynthetic absorption of CO2 can be calculated as given by Equation (6).
GHGs reduction due to additional photosynthetic absorption of CO2 by surplus growth of plants (leaves, stem, branches, etc.) and crops (i.e. fruits, grains, etc.)(6)
where ‘’ Mg/yr of dry sewage sludge applied on land, ‘¢1’ is the carbon content in the plant (kg/kg weight of plants without crops) and ‘¢2’ is the carbon content in the crops (kg/kg weight of crops), ‘a1’ is a yield of plant (kg/ha) and ‘a2’ is the yield of crops (kg/ha) after the land application of sewage, ‘b1’ is yield of plants without crops (kg/ha) and ‘b2’ is the yield of the crops (kg/ha) before (or without) the land application of sewage sludge.
4.6. Increased GHG emissions due to land application of sewage sludge
The function of soil ecosystems is governed by the dynamics of its microbiota. The land application of sewage sludge will change the dynamics of soil microbiota. The microbiota have a very essential role in organic matter degradation. Reduction or increase in microbiota due to sewage sludge land application will affect the nutrient cycling (Giller, Witter, & McGrath, Citation1998). Few studies are available on the flux of gases in sewage sludge applied to tropical soils (Alvarez, Alconada, & Lavado, Citation1999; Blechschmidt, Schaaf, & Hüttl, Citation1999; Flessa & Beese, Citation2000). Soil respiration, metabolic quotient and soil enzyme activity are the important parameters or indicators to evaluate the effect of sewage sludge application on soil microbial activity (Bettiol & Ghini, Citation2011). The application of sewage sludge has been reported to cause an increased flux of CO2, N2O and CH4 to the atmosphere (Bettiol & Ghini, Citation2011; Chiaradia et al., Citation2009; Fernandes et al., Citation2005a, Citation2005b). The flux of CO2, N2O and CH4 with sludge land application are increased by 224.0%, 316.0% and 162.0%, respectively, compared with the control soil without any fertilizers (Fernandes et al., Citation2005a, Citation2005b). Similarly, when soils are amended with chemical fertilizers the flux of CO2, N2O and CH4 to the atmosphere is increased by 85.0%, 45.0% and 106.0%, respectively, compared with the control soil without any fertilizers. Fernandes et al. (Citation2005a) observed the flux of CO2, N2O and CH4 to the atmosphere with sewage sludge application as 115.10 mg C.m−2 h−1, 8.60 mg N.m−2 h−1 and 0.05 μg C.m−2 h−1, respectively. Therefore, GHG emissions into the atmosphere due to land application of sewage sludge with an average thickness of 53.40 mm can be calculated as per Equation (7). Further, it was also considered the energy required during sewage sludge land application as 351.68 kWh/Mg of dry sludge solids (Wang et al., Citation2008a).
GHG emissions due to microbial mineralization(7)
where A is the net increase in the CO2 flux (mg C.m−2 h−1) with respect to control (i.e. without sewage sludge or without fertilizer application), B is the net increase in the N2O flux (mg N.m−2 h−1) with respect to the control (i.e. without sewage sludge or fertilizer application), C is the net increase in the methane flux (μg C.m−2 h−1) with respect to the control (i.e. without sewage sludge or fertilizer application) due to the application of fertilizers or sewage sludge; ‘’ is Mg of dry sewage sludge applied to land.
Therefore, the net GHG emissions due to the land application of sewage sludge are evaluated as per Equation (8).(8)
The negative value of Equation (8) will indicate a reduction in GHGs, whereas a positive value will indicate GHG emissions due to the land application of sewage sludge.
5. Hypothetical case study for estimating GHG emissions from land application of sewage sludge
In order to evaluate whether the land application of sewage sludge would result in either GHG emissions or reductions, a hypothetical case study has been presented based on the literature values. In this case, it was considered that the WWTP had a treatment capacity of 20 million gallons of wastewater per day (75708 m3/day). The sludge production rate is considered as 0.225×10⁻³ Mg of dry solids/m3 of treated wastewater (Ghazy, Dockhorn, & Dichtl, Citation2011). Considering 45.0% (w/v) total volatile solids degraded during anaerobic digestion (Metcalf, Eddy, & Tchobanoglous, Citation2004), the weight of the digestate required for land application was calculated. Chemical composition of anaerobic digested sludge (ranging from lower to higher concentration) was adopted from Sommers (Citation1977). Further, three possibilities were considered to evaluate the GHGs emissions for land application of the digested solids. Case 1: with lower percentage of carbon, N and P. Case 2: with higher concentration of organic carbon, N and P. Case 3: average concentration of organic carbon, N and P (). The nutrients concentrations in sewage sludge defined by various researchers () fall within the range of cases 1, 2 and 3. Further, it also evaluated GHG emissions based on the available methodologies in the literature and the results are compared with the present study ().
Table 4. Parameters considered for evaluation of GHGs during the land application of sludge digestate.
The carbon content in the plant and carbon content in the crops (as required in Equation 6) are not available for sewage sludge application. Therefore, for the evaluation of GHGs reduction due to the photosynthetic absorption of CO2 by crops, the data increase in the yield of tomato after compost application were considered from Togun et al. (Citation2003). The typical carbon content of tomato is 24.80 g C/kg of tomato or 90.90 kg CO2/Mg of tomato (Ministry of Agriculture and Forestry, http://www.mpi.govt.nz/mafnet/rural-nz). In case 2, due to non-availability of suitable data, a rational figure of 10.0% increase in the crop yield (compared to case 1) was assumed. An increase in the flux of gases in the soil–atmosphere interface at different nutrients concentrations is not available. Therefore, it was considered that there was a similar effect on gas fluxes at the soil–atmosphere interface by different nutrients concentrations.
5.1. GHG emissions and reductions at different nutrients concentrations
The computations of net GHG emissions (GHG reductions-GHG emissions) at different nutrients concentrations are summarized in . The GHG reduction, GHG emission and net GHG emissions for cases 1, 2 and 3 are presented in . In case 1 at lower nutrients concentrations, GHG reductions due to the replacement of fertilizers represent only −40.88 Mg CO2/yr, since the reductions are directly proportional to the nutrients concentrations (N and P) in the sludge. In cases 2 and 3, the GHG reductions corresponding to the fertilizer replacement were −1414.97 and −53.74 Mg CO2/yr, respectively, that is, the maximum GHG reduction was observed for sludge with high nutrients concentrations (case 2). GHG reductions due to the carbon sequestration were proportional to the amount of carbon content in sewage sludge, therefore at high nutrients concentrations (case 2) the carbon sequestration was high (−515.81 Mg CO2/yr). In cases 1 and 3, the carbon sequestration was relatively low compared with the case 2 (). Due to non-availability of the data at different nutrients concentrations and their effect on water holding capacity, improved tillage and photosynthetic absorption of CO2 by crops, similar factors were assumed (for cases 1, 2 and 3) which resulted in similar GHG savings. However, further studies are required to establish the data. GHG emissions corresponding to the energy utilization were directly proportional to the volume of the digestate applied to the soil. Therefore, GHG emissions corresponding to the energy utilization were similar to cases 1, 2 and 3 (). GHG emissions corresponding to the increase flux of gases were similar at different nutrients concentrations (since a similar flux factor was assumed).
Figure 2. Net GHG emissions due to the land application of sewage sludge with different nutrients concentrations.
Table 5. Net GHG emissions due to sewage sludge land application at different nutrient concentrations.
At lower nutrients concentrations (case 1) GHG emissions corresponding to the energy required during land application represent 62.0% of the net GHG emissions (). Moreover, GHG emissions corresponding to the increased flux of gases in the soil–atmosphere interface are 33.0% of the net GHG emissions. Thus GHG reductions due to digestate application represents only 5.0% of the net GHG emissions. In case 1, the GHG reductions due the replacement of fertilizers were only −40.88 Mg CO2/yr, because of the lower nutrients concentrations in the digestate, but increased flux has resulted in GHG emissions of 493.23 Mg CO2/yr. Thus, the overall balance represents increased GHG emissions for case 1. With increased nutrients concentrations (case 2), GHG emissions corresponding to the energy required during land application represent only 25.0% of the net GHG emissions, whereas GHG emissions corresponding to increased flux represent 14.0% of the net GHG emissions. At higher nutrients concentrations in sludge, the GHG reductions corresponding to the replacement of synthetic fertilizer are 44.0% of the net GHG emissions. GHG reductions corresponding to carbon sequestration represent 16.0% of the net GHG emissions. The sum of GHG emissions and reductions due to the land application of the digestate with higher nutrients concentrations was greater than the sum of GHG emissions. Therefore, the overall balance of higher nutrients concentrations result in GHG reductions. The land application of sewage sludge having average nutrients concentrations (case 3) will result in increased GHG emissions (). At average nutrients (case 3) concentrations the major factor for GHG reductions was due to carbon sequestration −259.10 Mg CO2/yr. The sum of GHG reductions and emissions are −340.63 Mg CO2/yr and 1259.14 Mg CO2/yr, respectively. The net GHG emissions for case 3 were 918.51 Mg CO2/yr. Therefore, the land application of digestate possessing lower nutrients concentrations results in net GHG emissions. The replacement of synthetic fertilizers and carbon sequestration represents the highest percentage of GHGs savings compared with other parameters (i.e. GHGs reduction due to additional water holding capacity, improved tillage and photosynthetic absorption of CO2 by crops) ().
5.2. Comparison of different methodologies to quantify GHG emissions due to the land application of sewage sludge
Computation of GHG emissions due to the land application of sewage sludge by employing different methodologies exhibited variable GHG emissions (). IPCC and RTI methodologies revealed that GHG emissions decreased with a decrease in the concentrations of nutrients in sewage sludge (). In IPCC methodology (Eggleston, Buendia, Miwa, Ngara, & Tanabe, Citation2006), estimation of GHG emissions is linked directly to nutrients (C, N) concentration with default factors (). RTI's methodology predicted the highest GHG emissions (); because it is assumed that CO2 emissions are directly related to the carbon content of sewage sludge (). Therefore, GHG emissions are lower at a lower carbon (nutrient) concentration and higher at a higher carbon concentration of sewage sludge. The IPCC and RTI methodologies do not take into account the replacement of the synthetic fertilizer, carbon sequestration and improved characteristic of soil (increased water holding capacity, improved tillage and movement of vehicles), which are the factors responsible for the reduction in GHG emissions.
Table 6. Comparison of GHG estimation methodologies due to land application of sewage sludge.
The BEAM methodology revealed higher GHG reductions (). The lowest GHG emissions are due to various assumptions, that is, (i) carbon sequestration is 25.0% of the dry sewage sludge applied, (ii) fertilizer credit for N is assumed as 4 and (iii) fertilizer credit for phosphorus as 2. Moreover, GHG emissions were also lower when the BEAM methodology was used by employing default values (i.e. 4.0% N and 1.5% P content present in sewage sludge) (). Moreover, the methodology developed by BEAM did not consider the increased water holding capacity of the soil, improved tillage and movement of vehicles and increased crop production due to the land application of sewage sludge. GHG emissions studies conducted by Hospido et al. (Citation2005) and Niu et al. (Citation2013) indicated an increase in GHG emissions due to sewage sludge land application, whereas GHG emissions studies conducted by Lundin et al. (Citation2004) and Hong et al. (Citation2009) revealed a decrease in GHG emissions due to sewage sludge land application. It was considered that CH4 and N2O emissions are reduced in these studies (Hong et al., Citation2009; Lundin et al., Citation2004). These authors have assumed a value of −0.012 kg CH4/Mg of dry solids and −0.190 kg N2O/Mg of dry solids () for estimating GHG emissions without explaining the details.
In the proposed methodology, the estimated GHG emissions decreased with increased nutrients concentrations. In the proposed methodology the factors responsible (defined in Section 4) for GHG emissions are considered. Therefore, GHG emissions are representative in accordance with nutrients concentrations of sewage sludge applied to the land. Computations of GHG emissions performed according to the proposed methodology revealed that the estimation of GHG emissions was more effective and representative.
6. Limitations and future perspective
It is imperative to note that the nutrient content of sewage sludge is unpredictable. The release of nutrients in available form that plants can use may not occur at the right plant growth stage. Moreover, sewage sludge nutrient content, their solubility and nutrient release rates, in general, are lower than inorganic fertilizers. On the whole, the nutrients in sewage sludge are both more diluted and much less readily available to plants. In case of a shorter time frame, nutrients of sewage sludge will not be available to the plants and therefore will not contribute to GHG savings. However, for a longer time frame, all the nutrient content of sewage sludge will eventually be available to plants and thus the calculation of GHGs saving would yield more or less realistic values.
Organic fertilizers from compost and other sources (such as sewage sludge) can be quite variable from one batch to the next. Therefore, without testing each batch, the amount of the applied nutrients cannot be accurately known. Therefore, the consideration of compost derived data for calculating additional water holding capacity of soils due to land application of sewage sludge may not give accurate results. The type of sludge (primary, secondary or mixed) applied to agriculture land will also affect GHG emissions. Moreover, the type of sludge treatment process (aerobic or anaerobic) and treatment duration (solids retention time) will also affect GHG emissions. The type of sludge and the type of treatment mainly influence the background microbial community of the soil, which affects the degradation of sludge solids or organic matter after sludge is land applied.
The availability of N and P of sewage sludge for plants needs to be established. The carbon percentage sequestrated in the soil, increased water holding capacity of soil and increase in the flux of gases due to land application of sewage sludge vary with type of soil, moisture content of the soil and atmospheric conditions. Therefore, further study of these components is required to estimate either GHG emissions or reductions. The carbon content of the plants and the crop, before and after sewage sludge application is required to estimate the GHG reductions. Further, the antibiotics and other emerging contaminants, which are present in sewage sludge at the nano-concentrations will impact the soil microbiota and also the flux of gases at the soil–atmosphere interface. Thus, data need to be generated on the impacts of emerging contaminants on the gas flux at the soil–atmosphere interface.
7. Conclusion
Different methodologies to evaluate GHG emissions due to the land application of sewage sludge presented in the literature are summarized. A progressed methodology to evaluate GHG emissions was proposed. Based upon the proposed methodology, it was clear that increased nutrients concentrations in sewage sludge substantially sequestrated GHG emissions. The land application of sewage sludge proved to be beneficial in reducing GHG emissions only at high nutrients concentrations (39.0% organic carbon, 17.6% N and 14.3% P) with sequestration in GHG emissions (−699 kg CO2/yr). A comparison of different methodologies for GHG emissions showed that the methodology proposed in this study was more effective and reliable, that is, GHG emissions or reductions vary according to the nutrients concentrations of the sludge.
References
- Aggelides, S. M., & Londra, P. A. (2000). Effects of compost produced from town wastes and sewage sludge on the physical properties of a loamy and a clay soil. Bioresource Technology, 71(3), 253–259. doi:10.1016/s0960-8524(99)00074-7
- Alvarez, R., Alconada, M., & Lavado, R. (1999). Sewage sludge effects on carbon dioxide-carbon production from a desurfaced soil. Communications in Soil Science and Plant Analysis, 30(13–14), 1861–1866. doi:10.1080/00103629909370337
- Baggs, E. M., Watson, C. A., & Rees, R. M. (2000). The fate of nitrogen from incorporated cover crop and green manure residues. Nutrient Cycling in Agroecosystems, 56(2), 153–163. doi:10.1023/a:1009825606341
- Ball, B. C., Ball, B. C., McTaggart, I. P., & Scott, A. (2004). Mitigation of greenhouse gas emissions from soil under silage production by use of organic manures or slow-release fertilizer. Soil Use and Management, 20(3), 287–295. doi:10.1079/sum2004257
- Basta, N. T. (1995). Land Application of Biosolids: A review of research concerning benefits, environmental impacts, and regulations of applying treated sewage sludge. Stillwater: Oklahoma Agricultural Experiment Station Technical Bulletin, B-808.
- Bettiol, W., & Ghini, R. (2011). Impacts of sewage sludge in tropical soil: A case study in Brazil. Applied and Environmental Soil Science, 2011(1–11). doi:10.1155/2011/212807
- Blechschmidt, R., Schaaf, W., & Hüttl, R. F. (1999). Soil microcosm experiments to study the effects of waste material application on nitrogen and carbon turnover of lignite mine spoils in Lusatia (Germany). Plant and Soil, 213(1/2), 23–30. doi:10.1023/a:1004650005531
- Brown, S., Beecher, N., & Carpenter, A. (2010). Calculator tool for determining greenhouse gas emissions for biosolids processing and end use. Environmental Science and Technology, 44(24), 9509–9515. doi:10.1021/es101210k doi: 10.1021/es101210k
- Champagne, P. (2007). Feasibility of producing bio-ethanol from waste residues: A Canadian perspective. Resources, Conservation and Recycling, 50(3), 211–230. doi:10.1016/j.resconrec.2006.09.003
- Chan, F. Y. (2009). The characterization of Hong Kong sewage sludge for its ash utilization in cement production (Degree of Master of Philosophy). The Hong Kong University of Science and Technology, Hong Kong.
- Chen, H., Yan, S. H., Ye, Z. L., Meng, H. J., & Zhu, Y. G. (2012). Utilization of urban sewage sludge: Chinese perspectives. Environmental Science and Pollution Research, 19(5), 1454–1463. doi:10.1007/s11356-012-0760-0
- Chiaradia, J. J., Chiba, M. K., Andrade, C. A. D., Carmo, J. B. D., Oliveira, C. D., & Lavorenti, A. (2009). CO2, CH4 and N2O fluxes in an ultisol treated with sewage sludge and cultivated with castor bean. Revista Brasileira de Ciência do Solo, 33(6), 1863–1870. doi: 10.1590/S0100-06832009000600035
- Clapp, C. E., Stark, S. A., Clay, D. E., & Larson, W. E. (1986). Sewage sludge organic matter and soil properties. In Y. Chen & Y. Avnimelech (Eds.), The role of organic matter in modern agriculture (Vol. 25, pp. 209–253). Dordrecht, The Netherlands: Springer.
- Delgado Arroyo, M. D. M., Miralles de Imperial Hornedo, R., & Martín Sánchez, J. V. (2011). Effects of sewage sludge and municipal solid waste application on a forest soil. Ingeniería de Recursos Naturales y del Ambiente, 5, 73–81.
- E2. (2007). Reducing greenhouse gas emissions through improved water policy (pp. 1–9). www.e2.org.
- Eggleston, S., Buendia, L., Miwa, K., Ngara, T., & Tanabe, K. (2006). IPCC guidelines for national greenhouse gas inventories. Hayama: Institute for Global Environmental Strategies.
- Epstein, E. (Ed.). (2002). Land application of sewage sludge and biosolids. Boca Raton, FL: CRC Press.
- Fernandes, S. A. P., Bettiol, W., & Cerri, C. C. (2005). Effect of sewage sludge on microbial biomass, basal respiration, metabolic quotient and soil enzymatic activity. Applied Soil Ecology, 30(1), 65–77. doi:10.1016/j.apsoil.2004.03.008
- Fernandes, S. A. P., Bettiol, W., Cerri, C. C., & Camargo, P. (2005). Sewage sludge effects on gas fluxes at the soil–atmosphere interface, on soil δ13C and on total soil carbon and nitrogen. Geoderma, 125(1–2), 49–57. doi:10.1016/j.geoderma.2004.06.008
- Flessa, H., & Beese, F. (2000). Laboratory estimates of trace gas emissions following surface application and injection of cattle slurry. Journal of Environment Quality, 29(1), 262. doi:10.2134/jeq2000.00472425002900010033x
- Flessa, H., Ruser, R., Dörsch, P., Kamp, T., Jimenez, M. A., Munch, J. C., & Beese, F. (2002). Integrated evaluation of greenhouse gas emissions (CO2, CH4, N2O) from two farming systems in southern Germany. Agriculture, Ecosystems and Environment, 91(1–3), 175–189. doi:10.1016/s0167-8809(01)00234-1
- Franco, A., Abreu Junior, C. H., Perecin, D., Oliveira, F. C., Granja, A. C. R., & Braga, V. S. (2010). Sewage sludge as nitrogen and phosphorus source for cane-plant and first ratoon crops. Revista Brasileira de Ciência do Solo, 34, 553–561. doi: 10.1590/S0100-06832010000200029
- Furrer, O. J., Gupta, S. K., & Stauffer, W. (1984). Sewage sludge as source of phosphorus and consequences of phosphorus accumulation in soils. In P.L. Hermitte and H. Ott (Eds.), Proceedings of third international symposium on “Processing and Use of Sewage Sludge” held at Brighton organised by commission of the European Communities, Brussels (pp. 279–294). Dordrecht, NL: D. Reidel.
- Fytili, D., & Zabaniotou, A. (2008). Utilization of sewage sludge in EU application of old and new methods-a review. Renewable and Sustainable Energy Reviews, 12(1), 116–140. doi:10.1016/j.rser.2006.05.014
- Gassara, F., Brar, S. K., Pelletier, F., Verma, M., Godbout, S., & Tyagi, R. D. (2011). Pomace waste management scenarios in Québec-impact on greenhouse gas emissions. Journal of Hazardous Materials, 192(3), 1178–1185. doi:10.1016/j.jhazmat.2011.06.026
- Ghazy, M., Dockhorn, T., & Dichtl, N. (2009). Sewage sludge management in Egypt: Current status and perspectives towards a sustainable agricultural use. World Academy of Science, Engineering and Technology, 57, 492–500.
- Ghazy, M., Dockhorn, T., & Dichtl, N. (2011). Economic and environmental assessment of sewage sludge treatment processes application in Egypt. International Water Technology Journal, 1(2), 1–17.
- Giller, K. E., Witter, E., & McGrath, S. P. (1998). Toxicity of heavy metals to microorganisms and microbial processes in agricultural soils: A review. Soil Biology and Biochemistry, 30(10–11), 1389–1414. doi:10.1016/s0038-0717(97)00270-8
- Ginestet, P., & Camacho, P. (2007). Technical evaluation of sludge production and reduction. In Comparative evaluation of sludge reduction routes (pp. 1–15). Londra: IWA.
- Gohar, L. K., & Shine, K. P. (2007). Equivalent CO2 and its use in understanding the climate effects of increased greenhouse gas concentrations. Weather, 62(11), 307–311. doi:10.1002/wea.103
- Haynes, R., Murtaza, G., & Naidu, R. (2009). Inorganic and organic constituents and contaminants of biosolids: Implications for land application. Advances in agronomy, 104, 165–267.
- Heras, J. D. L., Mañas, P., & Labrador, J. (2005). Effects of several applications of digested sewage sludge on soil and plants. Journal of Environmental Science and Health, Part A, 40(2), 437–451. doi:10.1081/ese-200045646
- Hong, J., Hong, J., Otaki, M., & Jolliet, O. (2009). Environmental and economic life cycle assessment for sewage sludge treatment processes in Japan. Waste Management, 29(2), 696–703. doi:10.1016/j.wasman.2008.03.026
- Hospido, A., Moreira, T., Martín, M., Rigola, M., & Feijoo, G. (2005). Environmental evaluation of different treatment processes for sludge from urban wastewater treatments: Anaerobic digestion versus thermal processes (10 pp). The International Journal of Life Cycle Assessment, 10(5), 336–345. doi:10.1065/lca2005.05.210
- IPCC. (2007). Climate change: Synthesis report. Contribution of Working Groups I, II and III to the Fourth Assessment Report of the Intergovernmental Panel on Climate Change. Geneva: IPCC.
- Jiménez, B., Drechsel, P., Koné, D., Bahri, A., Raschid-Sally, L., & Qadir, M. (2010). Wastewater, sludge and excreta use in developing countries: An overview. In C. A. S. Pay Drechsel, L. Raschid-Sally, M. Redwood, & A. Bahri (Eds.), Wastewater irrigation and health (pp. 3–27). London: Earthscan.
- Johannesson, G. H. (1999). Sewage sludge characterization and evaluation of P availability under green house conditions (Master of science). Ottawa: The University of Guelph.
- Jones, S., Rees, R., Kosmas, D., Ball, B., & Skiba, U. (2006). Carbon sequestration in a temperate grassland; management and climatic controls. Soil Use and Management, 22(2), 132–142. doi: 10.1111/j.1475-2743.2006.00036.x
- Kabir, M., Kamal, A., Jahan, S., Faizullah, A., & Ullah, S. (2012). Yield of rice and its mineral contents as influenced by sewage sludge and nitrogen. Bangladesh Journal of Scientific Research, 24(2), 161–168. doi: 10.3329/bjsr.v24i2.10774
- Kelessidis, A., & Stasinakis, A. S. (2012). Comparative study of the methods used for treatment and final disposal of sewage sludge in European countries. Waste management, 32(6), 1186–1195. doi: 10.1016/j.wasman.2012.01.012
- Keskin, B., Bozkurt, M. A., & Akdeniz, H. (2010). The effects of sewage sludge and nitrogen fertilizer application on nutrient and (Bromus inermis Leyss.). Journal of Animal and Veterinary Advances, 9(5), 896–902. doi:10.3923/javaa.2010.896.902
- Kharub, M. (2012). Effect of sewage sludge application on growth of Abelmoschus esculentus (Lady finger). International Journal of Research in Environmental Science and Technology, 2(3), 61–64.
- Laboy-Nieves, E. N., Schaffner, F. C., Abdelhadi, A., & Goosen, M. F. (2008). Environmental management, sustainable development and human health. London: CRC Press.
- Lakhdar, A., Scelza, R., Scotti, R., Rao, M. A., Jedidi, N., Gianfreda, L., & Abdelly, C. (2010). The effect of compost and sewage sludge on soil biologic activities in salt affected soil. Revista de la ciencia del suelo y nutrición vegetal, 10(1), 40–47.
- LeBlanc, R. J., Matthews, P., & Richard, R. P. (2009). Global atlas of excreta, wastewater sludge, and biosolids management: Moving forward the sustainable and welcome uses of a global resource (P. M. Ronald J. LeBlanc, Roland P. Richard Ed.). Nairobi: UN-HABITAT.
- Liu, B., Wei, Q., Zhang, B., & Bi, J. (2013). Life cycle GHG emissions of sewage sludge treatment and disposal options in Tai Lake Watershed, China. Science of the Total Environment, 447, 361–369. doi:10.1016/j.scitotenv.2013.01.019
- Lu, Q., He, Z. L., & Stoffella, P. J. (2012). Land application of biosolids in the USA: A review. Applied and Environmental Soil Science 1–11. doi:10.1155/2012/201462
- Lundin, M., Olofsson, M., Pettersson, G. J., & Zetterlund, H. (2004). Environmental and economic assessment of sewage sludge handling options. Resources, Conservation and Recycling, 41(4), 255–278. doi:10.1016/j.resconrec.2003.10.006
- Maisonnave, V., Montrejaud-Vignoles, M., Bonni, C., & Ensct, J. C. (2002). Impact on crops, plants and soils of metal trace elements transfer and flux, after spreading of fertilizers and biosolids. Water Science and Technology, 46(10), 217–224.
- McFarland, M. J. (2001). Biosolids engineering. New York, NY: McGraw-Hill.
- Metcalf, L., Eddy, H. P., & Tchobanoglous, G. (2004). Wastewater engineering: Treatment, disposal, and reuse. Columbus, OH: McGraw-Hill.
- Moitzi, G., Weingartmann, H., & Boxberger, J. (2006). Effects of tillage systems and wheel slip on fuel consumption. The Union of Scientists-Rousse: Energy Efficiency and Agricultural Engineering, 7–9(9), 237–242.
- NEBRA. (2008). A greenhouse gas emission analysis of biosolids management options for Merrimack. NH, USA. www.nebiosolids.org.
- Niu, D. J., Huang, H., Dai, X. H., & Zhao, Y. C. (2013). Greenhouse gases emissions accounting for typical sewage sludge digestion with energy utilization and residue land application in China. Waste Management, 33(1), 123–128. doi:10.1016/j.wasman.2012.06.024
- Parker, C. F., & Sommers, L. E. (1983). Mineralization of nitrogen in sewage sludges. Journal of Environmental Quality, 12(1), 150–156. doi: 10.2134/jeq1983.00472425001200010028x
- Pradel, M., & Reverdy, A. (2012). Assessing GHG emissions from sludge treatment and disposal routes: The method behind GESTABoues tool. ORBIT2012, Global assessment for organic resources and waste management, 1, 1–9.
- Quilbe, R., Serreau, C., Wicherek, S., Bernard, C., Thomas, Y., & Oudinet, J. P. (2005). Nutrient transfer by runoff from sewage sludge amended soil under simulated rainfall. Environmental Monitoring and Assessment, 100(1–3), 177–190. doi:10.1007/s10661-005-4773-8
- Recycled Organics Unit. (2006). Life cycle inventory and life cycle assessment for windrow composting systems. (Report prepared for NSW Department of Environment and Conservation. Recycled Organics Unit). The University of New South Wales, Sydney, Australia.
- Roy, M. M., Dutta, A., Corscadden, K., Havard, P., & Dickie, L. (2011). Review of biosolids management options and co-incineration of a biosolid-derived fuel. Waste Management, 31(11), 2228–2235. doi:10.1016/j.wasman.2011.06.008
- Ruíz-Valdiviezo, V., Aguilar-Chávez, Á., Cárdenas-Aquino, M., Mendoza-Urbina, L., Reynoso-Martínez, S., Bautista-Cerón, A., & Dendooven, L. (2013). Greenhouse gas emissions from a soil cultivated with wheat (Triticum spp. L.) and amended with castor bean (Ricinus communis L.) or Jatropha curcas L. seed cake: A greenhouse experiment. Plant, Soil and Environment, 59(12), 556–561.
- Shammas, N., & Wang, L. (2009). Land application of biosolids. In L. Wang, N. Shammas, & Y.-T. Hung (Eds.), Advanced biological treatment processes (Vol. 9, pp. 479–520). New York: Humana Press.
- Sigua, G., Adjei, M., & Rechcigl, J. (2005). Cumulative and residual effects of repeated sewage sludge applications: Forage productivity and soil quality implications in South Florida, USA (9 pp). Environmental Science and Pollution Research, 12(2), 80–88. doi: 10.1065/espr2004.10.220
- Singh, R. P., & Agrawal, M. (2008). Potential benefits and risks of land application of sewage sludge. Waste Management, 28(2), 347–358. doi:10.1016/j.wasman.2006.12.010
- Smith, S. R. (1996). Agricultural recycling of sewage sludge and the environment. Wallingford: CAB international.
- Sommers, L. (1977). Chemical composition of sewage sludges and analysis of their potential use as fertilizers. Journal of Environmental Quality, 6(2), 225–232. doi: 10.2134/jeq1977.00472425000600020026x
- Stocker, T. F., Qin, D., Plattner, G.-K., Tignor, M., Allen, S. K., Boschung, J., & Midgley, P. M. (2013). Climate change 2013: The physical science basis. Intergovernmental Panel on Climate Change, Working Group I Contribution to the IPCC Fifth Assessment Report (AR5). Cambridge Univ Press, New York, NY.
- Sylvis. (2009). The biosolids emissions assessment model (BEAM): A method for determining greenhouse gas emissions from Canadian biosolids management practices. Canada: Winnipeg.
- Togun, A., Akanbi, W., & Dris, R. (2003). Influence of compost and nitrogen fertilizer on growth, nutrient uptake and fruit yield of tomato (Lycopersicon esculentum). Crop Research-Hisar, 26(1), 98–105.
- Torri, S. I., & Lavado, R. S. (2008). Dynamics of Cd, Cu and Pb added to soil through different kinds of sewage sludge. Waste Management, 28(5), 821–832. doi:10.1016/j.wasman.2007.01.020
- Uggetti, E., Garcia, J., Lind, S. E., Martikainen, P. J., & Ferrer, I. (2012). Quantification of greenhouse gas emissions from sludge treatment wetlands. Water Research, 46(6), 1755–1762. doi: 10.1016/j.watres.2011.12.049
- de Urzedo, D. I., Franco, M. P., Pitombo, L. M., & do Carmo, J. B. (2013). Effects of organic and inorganic fertilizers on greenhouse gas (GHG) emissions in tropical forestry. Forest Ecology and Management, 310(0), 37–44. doi:10.1016/j.foreco.2013.08.018
- Veeresh, H., Tripathy, S., Chaudhuri, D., Ghosh, B., Hart, B., & Powell, M. (2003). Changes in physical and chemical properties of three soil types in India as a result of amendment with fly ash and sewage sludge. Environmental geology, 43(5), 513–520.
- Wang, L. K., Shammas, N. K., & Hung, Y. T. (2008). Biosolids engineering and management (Vol. 7). Totowa, NJ: Humana Press.
- Wang, N.-Y., Shih, C.-H., Chiueh, P.-T., & Huang, Y. F. (2013). Environmental effects of sewage sludge carbonization and other treatment alternatives. Energies, 6(2), 871–883. doi: 10.3390/en6020871
- Wang, P., Zhang, S., Wang, C., Hou, J., Guo, P., & Lin, Z. (2008). Study of heavy metal in sewage sludge and in Chinese cabbage grown in soil amended with sewage sludge. African Journal of Biotechnology, 7(9), 1329–1334.
- Wang, X., Chen, T., Ge, Y., & Jia, Y. (2008). Studies on land application of sewage sludge and its limiting factors. Journal of Hazardous Materials, 160(2–3), 554–558. doi:10.1016/j.jhazmat.2008.03.046
- Wood, S., & Cowie, A. (2004). A review of greenhouse gas emission factors for fertiliser production. IEA Bioenergy Task, 38(1), 1–20.