
 ?Mathematical formulae have been encoded as MathML and are displayed in this HTML version using MathJax in order to improve their display. Uncheck the box to turn MathJax off. This feature requires Javascript. Click on a formula to zoom.
ABSTRACT
We examine the impact of excluding sin stocks on expected portfolio risk and return. Exclusions involve risk relative to the market and peers. We show how this tracking error can be translated into an equivalent loss in expected return, which is negligible at low tracking error levels, but not at higher levels. However, even modest ex ante tracking error levels may lead to sizable compoundedunderperformance ex post. Taking an asset pricing perspective we find that popular exclusions typically go against rewarded factors such as value, profitability, and low risk, which is harmful for expected portfolio returns. Theoretically sin itself may also be a priced factor, but this is not yet supported by the empirical evidence. Tracking error may be minimized and expected portfolio return restored by filling the gap left by excluding sin stocks with non-sin stocks that offer the best hedging properties and similar or better factor exposures.
1. Introduction
Investors increasingly choose to exclude stocks from their portfolios because of non-financial considerations. Traditional targets for exclusion are firms with morally questionable business models, such as the tobacco, weapons, alcohol, gambling, and adult entertainment industries. In the literature such stocks are popularly known as ‘sin stocks’. With the rise of socially responsible investing (SRI) and sustainable investing (SI) the scope of exclusions has broadened to stocks that score poorly on Environmental, Social, and Governance (ESG) factors, the United Nations Sustainable Development Goals (UN SDGs), or their contribution to climate change (e.g. greenhouse gas emissions). The exclusions can be explicit, in the form of a blacklist specifying exactly which firms are not eligible for investment, but also implicit, in the form of constraints on portfolio sustainability scores, which require the removal of some of the worst offenders from the portfolio.
The effectiveness of exclusions in the real world is a hotly debated topic. It is important to realize that divesting from a stock comes down to a transfer of ownership, as the shares that are sold off by one investor are taken over by some other investor, who ends up holding them instead. Instead of excluding unsustainable firms one can also choose to remain invested and adopt an active ownership policy, by exercising one’s voting rights at shareholder meetings and engaging in a dialogue with firms aimed at improving their corporate behavior. In Blitz and Swinkels (Citation2020) we extensively discuss the pros and cons of these two approaches. In Blitz, Swinkels, and van Zanten (Citation2021) we argue that the real-world effects of sustainable investing are best observed in the primary market, i.e. the issuance of new stocks and bonds, instead of the secondary market where ownership of existing securities is merely exchanged between investors. The study finds no evidence that fresh capital is flowing more towards sustainable firms than to unsustainable firms, implying that exclusion has not reached the scale needed to deprive unsustainable firms of fresh capital.
The subject of this paper is how exclusions affect portfolio risk and return characteristics and how the gap that is left by exclusions can best be filled. Proponents of sustainable investing argue that excluding sin stocks need not go at the expense of returns, or can even improve returns. However, others point out that it conflicts with their fiduciary duty towards their clients to exclude certain stocks unconditionally, i.e. regardless of the implications for financial performance. We contribute to this debate by examining the impact of exclusions on risk and return, drawing on financial theory and empirical stylized facts. Many studies have already examined the performance of SRI-focused funds and ESG ratings; see, for instance, the meta-analysis by Friede, Busch, and Bassen (Citation2015) which covers over 2000 of such studies. The scope of our study is different, because we specifically look at the exclusion of sin stocks, which is becoming increasingly popular in mainstream portfolios, rather than at dedicated SRI investing.
We start by examining the impact of exclusions on portfolio risk. We next analyze the impact of exclusions on long-term expected returns from an asset pricing perspective, considering the current state of the art in the literature on which factor characteristics are associated with higher or lower returns. We then discuss whether such models should be augmented with a separate sin factor that either carries a positive or a negative premium. Throughout our analysis we consider an important question which is commonly ignored, namely how the gap that arises from excluding stocks should be filled. Finally, we discuss the other side of the sin stock exclusion trade, i.e. which investors end up owning the sin stocks that are sold off by investors with exclusion policies and what their considerations could be.
Our main results can be summarized as follows. First, we note that if the broad market portfolio is assumed to be efficient, exclusions lead to under-diversification. The exposure to unrewarded, diversifiable risk, comes down to tracking error. A high tracking error brings along the risk of significant underperformance compared to peers. We also show how tracking error can be translated in an equivalent loss in expected return, which is typically not negligible. The tracking error resulting from exclusions may be reduced by giving more weight to stocks that exhibit return behavior most similar to the excluded stocks. Second, we show that exclusions generally lead to lower expected returns by implicitly going against established factors such as value, profitability, investment, and low risk. However, such undesired factor tilts may be offset by increasing the weight of stocks that offer the same kind of factor characteristics. Third and finally, we argue that although there are theoretical arguments for the existence of a distinct sin premium, this is not supported by the empirical evidence. However, there is an important caveat here, namely that a sin premium may arise in the future if exclusion policies become more effective at raising the cost of capital of sin stocks. The resulting loss in expected return may be offset by increasing the exposure towards other priced factors.
2. The cost of tracking error
In this section we examine the impact of exclusions on portfolio risk. The impact on expected portfolio return is discussed in the subsequent sections.
2.1. The risk of underperformance
Exclusions lead to deviations from the capitalization-weighted market portfolio, or tracking error. Over longer periods the impact of tracking error accumulates with approximately a square root of time factor. This is shown in for several different levels of tracking error, assuming normally distributed returns. When exclusions lead to a tracking error of 5% per year, there is a 2.5% probability that the portfolio return is 20% or more above or below the market return after 5 years. Even a tracking error as low as 1% per year may lead to deviations of 5% over a 5-year period. Stakeholders should be aware of the potential magnitude of adverse outcomes to prevent disappointment.
Figure 1. Confidence bounds for different levels of tracking error.
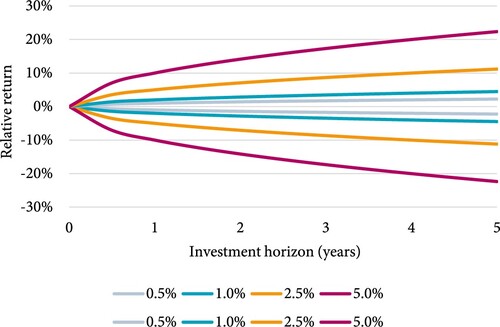
In principle, tracking error is a symmetric phenomenon, reflecting the fact that the outperformance of investors who exclude sin stocks is equal to the underperformance of investors who end up owning these stocks instead – and vice versa. However, from prospect theory (Kahneman and Tversky Citation1979) we know that the dissatisfaction from an X% loss far outweighs the satisfaction from an X% gain. A practical illustration of this asymmetry is that investment officers at pension funds may get fired if their actions result in a sizable underperformance compared to peers, while only receiving a modest token of appreciation in case of a similar-sized outperformance. Even though it may be argued that ex ante the exclusion had a (near) neutral expected impact on performance, and even if ex post the realized underperformance may be statistically insignificant given the relatively short evaluation horizons that are typically used in practice, the wisdom of the exclusion decision is likely to be questioned, with possible career ramifications. We can draw a parallel here with active managers, who regularly get replaced after a few consecutive years of underperformance.Footnote1 Some investors try to circumvent this problem by redefining their benchmark to be an index which incorporates all their exclusions. However, we doubt whether such attempts will be successful, because the standard benchmark which includes all stocks without any subjective exclusions remains readily available for comparison.Footnote2
Crucially, the amount of tracking error depends not only on which stocks are excluded, but also on how the resulting gap is filled with increased positions in other stocks. If the capitalization-weighted market portfolio is assumed to be efficient, then this does not imply that the most efficient portfolio given certain exclusions consists of cap-weighting the remaining stocks. Tracking error can be reduced by not naively excluding stocks and reweighting the remaining stocks according to their market capitalization, but by selectively increasing the weights of those stocks that provide the best hedge for the excluded stocks. Intuitively one can think of stocks that are from the same industry or, as we will discuss in the next section, stocks which offer similar factor characteristics. The former is of course only possible if the exclusion policy does not rule out entire industries, but leaves room to buy best-in-class stocks. Modern portfolio optimization techniques are suitable for minimizing the tracking error from exclusions.Footnote3
2.2. Quantifying the cost of under-diversification
The theoretical interpretation of tracking error is that it reflects the amount of non-systematic, diversifiable risk. If, for simplicity, we consider the Capital Asset Pricing Model (CAPM) in which the market is efficient and the only priced factor is market beta, then tracking error causes a portfolio to end up below the market, which is the tangency portfolio in risk-return space. This notion allows us to convert tracking error into an equivalent expected return loss.Footnote4
The CAPM relation states that the return of a portfolio in excess of the risk-free return is equal to the market beta of the portfolio times the return of the market in excess of the risk-free return (i.e. the equity premium) plus an idiosyncratic component:
(1)
(1)
Since the idiosyncratic component is unpriced, the expected portfolio excess return is equal to its beta times the market excess return:
(2)
(2)
Since idiosyncratic risk is by definition uncorrelated with systematic risk, portfolio volatility can be expressed as follows, where represents tracking error:
(3)
(3)
The Sharpe ratio of the portfolio can be obtained by dividing its expected return, given in (2), by its volatility, given in (3):
(4)
(4)
Since the market portfolio has a beta of 1 and zero idiosyncratic risk, its Sharpe ratio is simply:
(5)
(5)
In an efficient market the market portfolio is the tangency portfolio that offers the highest possible Sharpe ratio, so the required portfolio return can be calculated as the Sharpe ratio of the market, as in (5), times the volatility of the portfolio, as in (5), which gives:
(6)
(6)
The expected return loss of the portfolio can then be calculated as the difference between its required return, as in (6), and its actual return, as in (2), which results in:
(7)
(7)
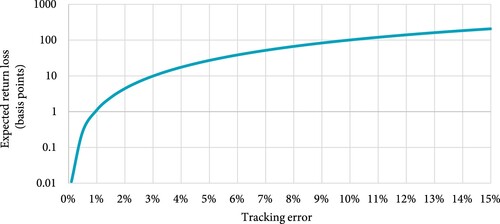
shows what this expected returns loss comes down to for a portfolio with a beta of 1, assuming an equity risk premium of 5% and a market volatility of 15%. We observe that the under-diversification that comes from a tracking error of 1% is equivalent to an expected return loss of just 1 basis point, or 0.01%. Thus, if the impact of exclusions can be limited to a tracking error of 1% or less, the cost of under-diversification is negligible for practical purposes. For a tracking error of 3%, the equivalent return loss amounts to 10 basis points, or 0.1%. This might still be considered small in comparison to the assumed equity premium of 5%, but in comparison to management fee levels (e.g. the fee difference between active and passive management) it is already quite sizable. The under-diversification associated with a tracking error of 10% is equivalent to an expected return loss of 100 basis points, or 1%, which is clearly not negligible anymore.
Figure 2. Conversion of tracking error into equivalent expected return loss.
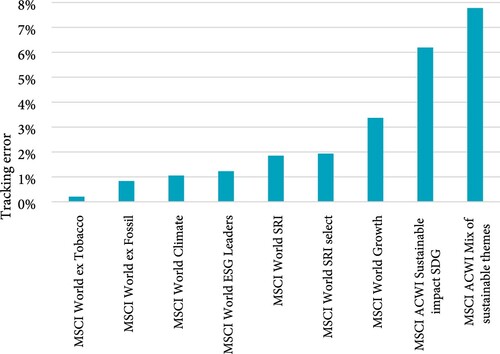
shows the tracking error of a selection of sustainable indices from MSCI. The tracking errors are calculated versus the relevant parent index, using monthly data from January 2015 to December 2020 (the longest period for which data for all indices is available). The mix of sustainability themes is the equally weighted average of the MSCI ACWI alternative energy, energy efficiency, environment, green building, pollution prevention, and sustainable water indices, which individually have tracking errors ranging between 10% and 20%. We observe that the tracking error from exclusions can range from a mere 0.2%, in case only tobacco stocks are excluded, to almost 8%, in case one only invests in the sustainable themes, and everything in between.
Figure 3. Tracking error of selected MSCI sustainable indices versus their parent indices, January 2015 to December 2020.
3. Asset pricing perspective
In this section we shift our attention to the impact of exclusions on expected portfolio return. We first describe our data and methodology, and next present the empirical results.
3.1. Data and methodology
The key takeaway from half a century of asset pricing research is that the expected return on a stock is determined by its exposures to a number of systematic factors. For instance, the widely used five-factor model of Fama and French (Citation2015) includes the factors market beta, size, value, profitability, and investment. From an asset pricing perspective the exclusion of sin stocks can therefore either increase or decrease the expected return, depending on whether these stocks have favorable or unfavorable factor characteristics.
In order to assess whether exclusion is generally beneficial or harmful for expected return we empirically examine the factor exposures of sin stocks. For our analysis we use industry return series from the online data library of Kenneth French, taking the most granular definition consisting of 49 different industries.Footnote5 Among these 49 industries we identify 11 industries that are potential exclusion candidates: smoke, beer, guns, coal, oil, utilities, transportation, mines, gold, soda, and meals. The first three are the classic sin stocks, with morally questionable business models: tobacco, alcohol, and weapons. The next four industries are modern-day exclusion targets because of their high carbon footprint, which makes them unwanted by investors who wish to de-carbonize or Paris-align their portfolios. These industries correspond with the GICS energy, utilities, and transportation industries.Footnote6 Mining and gold are in scope for exclusion because of their environmental impact. Soda is a typical example of an SDG exclusion not yet covered by the other industries, because of the contribution of soft drinks to the growing problem of obesity. The final industry, meals, contains fast-food restaurants, which is another example of unhealthy food, and hotels, which are associated with the classic gambling sin theme.
For each industry we regress the monthly returns in excess of the risk-free return on the factors in the Fama–French five-factor model, augmented with the low-risk factor of Blitz, Van Vliet, and Baltussen (Citation2020):Footnote7
(8)
(8) where
is the total return of industry i in excess of the risk-free return on Treasury bills,
the excess market return, SMB the size factor, HML the value factor, RMW the profitability factor, CMA the investment factor, and VOL the volatility factor. We consider the 10-year sample period from January 2011 to December 2020 in order to strike a balance between relevance for today’s environment and having a sufficient number of observations for meaningful statistical inferences.
3.2. Empirical results
shows for each industry the aggregate exposure to all priced factors except the market, i.e. size, value, profitability, investment, and low risk. One might be surprised that positive aggregate factor exposures are observed much more frequently than negative ones, but this can be explained by the fact that the industries with positive exposure tend to be considerably smaller, on average, than the industries with negative exposure. As one would expect, the capitalization-weighted average factor exposure of the 49 industries is close to zero.
Figure 4. Aggregate exposure of 49 US industries to the size, value, profitability, investment, and low-risk factors, January 2011 to December 2020 (11 sin industries marked with a different color).
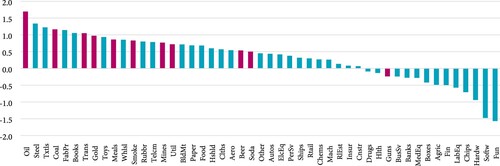
The 11 sin industries are marked with a different color in . We observe that 10 out of the 11 sin industries have a sizable positive combined exposure to the priced factors, the only exception being the guns industry, which has a marginally negative exposure. The oil industry stands out with a particularly high combined factor exposure, which implies that excluding this industry is most harmful for expected portfolio return. The average combined factor exposure across all 11 sin industries amounts to 0.81. Assuming that expected factor premiums are all equal to 3% per annum, this translates into an expected outperformance of 0.81 × 3% = 2.4% for sin stocks due to their factor exposures.Footnote8 Given that the total weight of the 11 sin industries in the market portfolio is currently about 11%, this implies an expected return loss of about 0.27% if sin stocks are naively excluded from the market portfolio.
shows the estimated exposures of the sin industries towards the individual factors. We observe that the positive aggregate factor exposures are not driven by the same factors for each industry. For instance, the value factor is an important driver for the coal, oil, and mines industry, but not for the smoke, beer, soda, and meals industries, which are more driven by their profitability and low-risk exposures. For the utilities and soda industries, the positive aggregate factor exposure is almost fully coming from their exposure towards the low-risk factor. Across all eleven industries, the investment and profitability factors contribute most to the positive aggregate factor exposures. Some industries also have large negative exposures towards certain individual factors. For instance, the gold, coal, and mines industries have a strong negative loading on the low-risk factor. However, these negative exposures are more than offset by their positive exposures towards other priced factors.
Table 1. Breakdown of factor exposures of US sin industries, January 2011 to December 2020.
Our results indicate that naïvely excluding sin stocks will generally lead to a lower expected return, because these stocks tend to have favorable factor characteristics. However, investors need not despair. Deteriorated factor exposures due to the exclusion of sin stocks can potentially be restored by giving more weight to acceptable stocks that offer the same kind of factor exposures as the excluded stocks. When the number of exclusions is limited this should generally not be a problem, because factor portfolios are well-diversified portfolios containing a large number of stocks. This might change though if investors wish to exclude a sizeable part of the universe, e.g. more than 10% or 20% of total market capitalization. The more stocks with favorable factor exposures are excluded, the more difficult it will become to find a sufficient number of substitute stocks that can make up for the lost factor exposures. Excluding entire industries is more likely to cause such problems than a best-in-class approach which only excludes the worst offenders in each sin industry, because industry-specific risks are difficult to diversify away with stocks from other industries. shows which non-sin industries offer similar factor exposures as sin industries, e.g. steel and telecom.
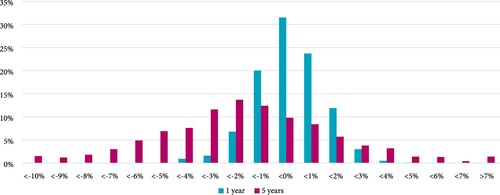
Investors should also not forget that although excluding sin stocks with favorable factor characteristics lowers the expected return, realized returns over a given period of time may differ substantially from their expectations. These differences arise because of the volatility in factor returns and the idiosyncratic volatility of sin stocks. Excluding all 11 sin industries results in an annualized tracking error of approximately 0.67% versus the market over our 10-year sample period. This volatility likely overshadows the expected return loss of 0.27% per annum over typical evaluation horizons of 1–5 years. In order to illustrate this empirically, we perform a historical bootstrap simulation that shows the distribution of the excess returns of a portfolio without sin stocks relative to the market over a 1-year and 5-year period.Footnote9 confirms that the realized excess returns show substantial variation around the mean at both horizons.Footnote10 Due to this variation there is still a 39% probability that the portfolio without sin stocks outperforms the market over a 1-year period, and a probability of 26% over a 5-year horizon. This wide dispersion also explains why we assess the impact of excluding sin stocks on expected returns using factor exposures, instead of considering much more noisy realized returns.
Figure 5. Distribution of boostrapped performance differences of portfolios excluding sin stocks versus the market portfolio, for 1- and 5-year investment horizon.
4. Is there a sin premium (or discount)?
In the previous section we examined the factor characteristics of sin stocks. But could it be that sin is a priced factor in its own right, i.e. a relevant factor that traditional asset pricing models fail to recognize? In this section we review theoretical arguments for a potential sin premium (or discount), the empirical evidence, and finally how the future may be different from the past.
4.1. Theoretical arguments
Theoretically it can be shown that if certain stocks are shunned by a large group of investors, this should lead to higher expected returns for such stocks; see Pástor, Stambaugh, and Taylor (Citation2020), Pedersen, Fitzgibbons, and Pomorski (Citation2020), and Zerbib (Citation2020), amongst others. Thus, the very act of excluding sin stocks can give rise to a sin premium, which can be interpreted as a reward for the reputational risk that is involved with holding sin stocks. In the asset pricing model that we estimated in the previous section, this would mean that there would be an additional priced factor, SIN, which could be constructed as a portfolio that is long the most unsustainable stocks and short the most sustainable stocks:
(9)
(9)
Another theoretical argument for a sin premium follows from the notion that the point of exclusion is to increase the cost of capital of sin stocks. This implies the creation of a sin premium, because in the long run the return on a stock should be equal to its cost of capital; see Asness (Citation2017). On the one hand, this sin premium can be interpreted as a measure of success, as it reflects the increased cost of capital for firms with unsustainable business models. However, it also means that investors who exclude sin stocks experience lower expected returns than those who do not, which comes down to a wealth transfer from sustainable investors to unsustainable investors. Investors who exclude sin stocks will only preserve their expected return if the firms in question do not experience an increased cost of capital; in other words, when their exclusion policies do not have any impact on the cost of capital of the target firms.
Although these arguments are backed by economic theory, it is not obvious whether they also hold in practice. A counterargument, for instance, is that even if a substantial group of investors decides to exclude certain stocks, the remaining investors still have a strong financial motive to jump on any mispricing opportunity that might arise. Mispricing due to exclusion by one group of investors can only persist if limits to arbitrage prevent the remaining investors from exploiting this opportunity. It is an open question at which scale investors need to exclude sin stocks for a significant sin premium to emerge.
Some reject the notion of a sin premium, arguing that investors should expect a sin discount (i.e. a negative instead of a positive premium) instead. Their argument is that sin stocks are firms with doomed business models that will turn out to be stranded assets, as in Andersson, Bolton, and Samama (Citation2016) and Caldecott (Citation2018), resulting in poor long-term returns. The problem with this notion is that even if it is true that sin stocks are ultimately doomed, they can still be an attractive investment in the short or medium term if investors can buy them cheaply. Thus, the stranded assets view does not support the unconditional exclusion of sin stocks, because it ignores the fact that any stock can be a good investment provided the price is low enough. Similarly, the most sustainable stocks can be bad investments if they trade at excessive prices.
4.2. Empirical evidence
Empirical analysis can potentially resolve the opposing theoretical views on whether sin stocks are rewarded with a premium or suffer a discount. Until recently, it seemed that there was strong empirical support for the existence of a sin premium, because studies such as Fabozzi, Ma, and Oliphant (Citation2008), Hong and Kacperczyk (Citation2009), and Statman and Glushkov (Citation2009) report highly significant positive abnormal returns for sin stocks after controlling for the classic asset pricing factors: market, size, value, and momentum. However, Blitz and Fabozzi (Citation2017) find that this sin premium becomes economically small and statistically insignificant when additionally controlling for more recently established asset pricing factors, in particular profitability, investment, and low risk. In other words, the strong historical returns of sin stocks observed in the earlier studies can be fully explained after all, when accounting for all relevant factor characteristics.Footnote11
Empirical support for a sin discount may be inferred from studies which report a positive relationship between ESG scores and future stock returns (see, e.g. Derwall, Koedijk, and Ter Horst Citation2011; Kotsantonis, Pinney, and Serafeim Citation2016; Harjoto, Hoepner, and Li Citation2021).Footnote12 However, this evidence is indirect, because exclusion is typically based on the core business activity of firms, rather than their general performance on environmental, social, and governance factors. Moreover, the empirical findings are mixed (e.g. Hsu et al. Citation2018, find no significant relation between ESG scores and subsequent returns), the available data history for ESG is relatively short (starting in the mid-2000s or later), the correlation between ESG scores from different providers is low (Berg, Kölbel, and Rigobon Citation2019; Dimson, Marsh, and Staunton Citation2020), and there are concerns about ESG data having been rewritten (Berg, Fabisik, and Sautner Citation2020).
Additional insights can be obtained from the corporate bond market, where a sin premium or discount may be inferred ex ante from credit spreads. Here too the empirical evidence turns out to be mixed. For instance, Bauer and Hann (Citation2010) find a higher cost of debt financing and lower credit ratings for firms with high environmental risk, while Fabozzi et al. (Citation2019) find that the most shunned firms experience cheaper than expected financing rates in the corporate bond market. Altogether we conclude that solid empirical evidence for the existence of a distinct sin premium or discount in historical data is lacking, especially after taking into account the relevant factor exposures of sin stocks and data reliability.
4.3. Is the past representative for the future?
Since exclusion in mainstream investment portfolios is a relatively young phenomenon, the past may not be representative for the future, in particular if investors start excluding sin stocks at a hitherto unprecedented scale and become more effective at pushing up the cost of capital of sin firms. Thus, sustainable investors should be prepared for the possibility that a sin stock premium may emerge as a direct consequence of their own, ethically motivated actions. Angel and Rivoli (Citation1997) estimate that the theoretical cost of equity capital increases with about 1% if the fraction of investors shunning a stock reaches 75%. As about 10% of the market can be classified as sin, this would imply a 0.10% return loss at the portfolio level if sin stocks are excluded. This comes on top of the effect of exclusion on factor exposures discussed in the previous section.
In the previous section we argued that the loss in expected return from excluding sin stocks with positive exposures to priced factors could be restored by replacing them with non-sin stocks that offer similar factor exposures. If there is an additional return loss due to the existence of a positive sin premium, then investors could offset that by seeking additional exposure to the other priced factors. In other words, replacing sin stocks with non-sin stocks that offer better instead of merely similar factor characteristics. The caveat here is that a net positive exposure towards a classic factor such as value is an imperfect hedge for a negative exposure towards a distinct sin factor. For the ex ante expected return the two effects may offset each other, but ex post the value premium could fail to materialize while the sin premium does.
Of course, massive exclusion may also have other consequences. Sin stocks might find themselves effectively cut off from capital markets, preventing them from raising capital for financing new projects, or even threatening their business continuity. Thus, sin stocks could indeed become stranded assets. Alternatively, sin firms might decide to abandon increasingly hostile public markets and go private, to be relieved from close scrutiny. Another possibility is that governments intervene and nationalize sin activities.Footnote13
5. Who is on the other side of sin stock exclusions?
To fully understand the impact of exclusions on expected returns, we should also consider the perspective of those who do not exclude sin stocks from their investment universe, or who are even overweighting sin stocks in their portfolios. In this section, we review ‘the other side’ of sin stock exclusions, which is equally relevant for equilibrium asset pricing.
Over the past decade, passive investors have been large net buyers of sin stocks. For instance, Blitz and Swinkels (Citation2021) find that the ownership of tobacco stocks by passive funds has increased substantially during this period. This is a direct consequence of the increased market share of passive investing. As passive investors follow a market capitalization-weighted index, they hold all stocks in proportion to their weight in the index, including sin stocks. This could change if passive investors would replace standard indices with indices that exclude sin stocks, but at present only a small fraction of passive assets appears to be managed this way. The vast majority of passive investors still follow standard indices such as the S&P 500 and MSCI World, which do not exclude stocks based on ethical or sustainability considerations.Footnote14 Passive investors may of course still make use of their voting power for sin stocks, although De Groot, De Koning, and Van Winkel (Citation2021) find that the major passive asset managers are least likely to vote in favor of social and environmental proposals.
We continue with discussing active investors who choose to refrain from applying non-financial considerations and retain sin stocks in their eligible investment universe. Some active investors may still underweight sin stocks because of financial considerations, i.e. because they expect these stocks to underperform. This could be because they believe that the firms in question will face headwinds, or because they expect that sin stocks will suffer from selling pressure because many non-financially motivated investors will be divesting from these stocks in the coming years. In other words, it can be rational to divest from sin stocks simply because one expects other investors to do so. A related reason for actively underweighting sin stocks could be ambiguity aversion, as in Easley and O’Hara (Citation2009) and Bossaerts et al. (Citation2010). What distinguishes these active underweighters from the excluders is that they could step in again if sin stocks become sufficiently cheap, for instance if a ‘green bubble’ were to arise, as in Semieniuk et al. (Citation2020).
On aggregate, however, active investors who do not exclude sin stocks must have an overweight position in these stocks, in order to offset the underweights of active investors who do exclude these stocks (passive assets drop out of this equation because they follow market weights). Why would many active investors choose to overweight sin stocks? One explanation could be that they hold ethical values that are diametrically opposed to those of sustainable investors. For example, from a moral point of view they could prefer to invest in tobacco and coal firms rather than in producers of healthy foods and renewable energy, ceteris paribus. This does not sound very plausible though.
Other active investors may choose to overweight sin stocks because they want to use their voting power and engagement to improve corporate strategy and business models, so that in due course the firm will no longer be a sin stock; see Dimson, Karakaş, and Li (Citation2015). However, based on the limited number of shareholder proposals for environmental issues, this does not seem the driving force for most of the overweights. Nevertheless, a similar trend is visible in the corporate bond market, with the growing popularity of ‘green bonds’.Footnote15
Another explanation could be that investors end up investing in sin stocks because of the factor characteristics of these stocks. For example, investors with a focus on value, high-dividend, low-risk, or quality stocks might be drawn to sin stocks because they generally score well on these factors, as discussed before. However, this can be at best a partial explanation as not all sin stocks are simultaneously attractive on these characteristics. Moreover, as long as the number of exclusions is not too large, high factor exposures may also be obtained without investing in sin stocks.
The final and arguably most plausible explanation is that active investors in sin stocks believe that these stocks offer an attractive return, if not in an absolute sense then at least relative to other stocks in which they do not hold net overweight positions. Active investors aim to beat the market, so if they hold overweight positions in certain stocks, this implies that they expect these stocks to do better than the market. As such, these investors are actively betting against the investors who choose to exclude sin stocks. Time will tell which of these two groups of investors will be earning a higher financial return.
The expected outperformance by an active manager may come from two channels. The current price P of a stock can be written as the sum of the expected future cash flows CF, each discounted at the discount rate R that reflects the risk of the company’s activities:
(10)
(10)
The decision to overweight sin stocks can be driven by the cash-flow channel (the numerator of this formula) as well as the discount rate, R (the denominator). The cash-flow argument is that the active investors whom overweight sin stocks have overly optimistic expectations about their future cash flows. Such a collective mis-assessment specifically for sin stocks seems implausible though. The other possibility is that the investors who overweight sin stocks like these stocks because of their high discount rates, as this translates into similarly high expected returns for investors. If sin stocks have a higher cost of capital than comparable stocks this implies the presence of a sin premium, as we discussed in the previous section. Investors are able to earn this sin premium if they have less reason to be concerned about reputational risks.Footnote16 In this case, exclusions come down to a wealth transfer from sustainable investors to investors who are willing to take on the active risk and do not have moral objections to investing in sin stocks.
6. Summary
We examined the impact of excluding sin stocks on expected portfolio return and risk. From a risk perspective we argued that exclusions lead to under-diversification and an exposure to unrewarded, diversifiable risk, or tracking error. A high tracking error brings along the risk of significant underperformance compared to peers. We also show how tracking error can be translated into an equivalent loss in expected return, which is negligible at low tracking error levels, but not at higher levels. The tracking error resulting from exclusions may be reduced by selectively overweighting stocks that exhibit return behavior most similar to the excluded stocks. This will typically be easier if the exclusion policy does not rule out entire industries, but leaves room for buying the best-in-class stocks within each industry.
Taking an asset pricing perspective we found that exclusions typically go against established asset pricing factors such as value, profitability, investment, and low risk, leading to lower expected returns. However, if the amount of exclusions is not too drastic it may be possible to offset such undesired factor tilts by increasing the weight of stocks that offer similar factor characteristics. We next discussed whether sin itself could be a priced factor which standard asset pricing models fail to recognize. Although it can be theoretically argued that sin stocks should command a higher average return, there is no strong empirical evidence for the existence of such a sin premium – nor for a sin discount for that matter. An important caveat here is that past data may no longer be representative if exclusion policies become successful at raising the cost of capital of sin stocks, which could create a sin premium in the future. In order to offset an additional loss in expected return due to a sin premium, investors could seek additional exposure towards the other priced factors.
Altogether we estimate that naively excluding large numbers of sin stocks can lower the expected equity return by 0.25–0.50%. Although this might seem small, a pension fund which underperforms its peers by such an amount may end up providing about 5% lower pensions in the long run.Footnote17 The good news, however, is that this performance loss may be prevented, or at least mitigated to a large extent, with more sophisticated portfolio management.
Acknowledgements
The views expressed in this paper are not necessarily shared by Robeco. We thank Guido Baltussen, Bart van der Grient, Jan Anton van Zanten and other colleagues at Robeco for valuable feedback.
Disclosure statement
Both authors are employed by Robeco, a global asset management firm that may use the insights from this research for the products or services it offers.
Notes
1 See, for example, Goyal and Wahal (Citation2008) on the importance of underperformance for pension plans firing their investment managers.
2 Exceptions could be acceptable for investments that are illegal in a certain jurisdiction. For example, investors in the Netherlands are legally not allowed to invest in companies that are involved with the production of controversial weapons, because of international treaties signed by the Dutch government. Other exclusions are by voluntary choice and therefore responsibility clearly lies with the investor.
3 See, e.g. Jansen and Van Dijk (Citation2002) for a discussion on tracking error minimization without owning all stocks of the target index.
4 Pizzutilo (Citation2017) also calculates the lack of diversification of sustainable indices by examining the volatility reduction that a non-sustainable investor could achieve, but does not link this to the loss of expected returns.
6 The transportation industry consists primarily of airlines and marine shipping. There is a separate industry for Automobile manufacturers, which we do not include in our analysis because it is a less common exclusion target.
8 This assumed expected return for factors is in line with their long-term historical averages in the Kenneth French data library and is also consistent with studies that cover international markets over long sample periods; see, e.g. Dimson, Marsh, and Staunton (Citation2017).
9 The historical bootstrap simulation is structured as follows. We take the average factor exposures displayed in the bottom row of and the standard deviation of the residuals. We randomly draw a 12-month period from the sample for which we have factor returns, July 1963 to December 2020. We multiply the factor betas with the realized factor returns and add a residual simulated from the normal distribution. We also store the market return in excess of the risk-free rate of the same 12-month period. We assume that sin stocks are 11% of the market portfolio and calculate the return difference between a portfolio excluding sin stocks and that of the market. For the 5-year horizon we concatenate five 12-month bootstrapped returns. We repeat this 1000 times and display the frequency distribution of the (under)performance of the portfolio without sin stocks relative to the market.
10 Note that this figure also provides an empirical illustration for the analytical result showed in , with the difference that there we assumed for simplicity that all stocks have the same expected returns.
11 Some recent studies find evidence for a sin premium using an environmental perspective. For example, Hsu, Li, and Tsou (Citation2020) document a pollution premium and Bolton and Kacperczyk (Citation2021) find a carbon premium.
12 Note two meta-studies, Clark, Feiner, and Viehs (Citation2014) and Friede, Busch, and Bassen (Citation2015) examine the literature and conclude that there is overwhelming evidence that ESG scores have a positive relationship with operational and financial firm performance, but that the relationship with stock returns is less clear cut.
13 For instance, China Tobacco is the world’s biggest tobacco firm but is run by a government ministry. The Japanese government also holds a large stake in Japan Tobacco.
14 Blitz and De Groot (Citation2019) argue that many of the choices regarding exclusions are active decisions and therefore difficult to reconcile with the philosophy behind passive investing.
15 Green bonds are issued by carbon-emitting firms to finance their transition to a low- or zero-carbon economy; see Flammer (Citation2021). Whereas regular corporate bonds may have been shunned by sustainable investors, the earmarking for green projects may convince them to invest for sustainable impact. Although this market is rapidly increasing in size, Swinkels (Citation2021) shows that it is currently less than 1% of the entire bond market.
16 Cojoianu et al. (Citation2021) find that banks operating in an environment with more stringent environmental policy provide less capital to domestic oil and gas companies, but increase financing of foreign oil and gas companies, which is less visible domestically. Hong and Kacperczyk (Citation2009) and Blitz and Swinkels (Citation2021) find that sin stocks are less held by investors that are more likely to be scrutinized by the public, for example because they are required to publicly disclose their positions.
17 If we assume 40 working years and 20 years in retirement, a dollar is on average 30 years invested. If we further assume that a pension fund invests 50% of its assets in the stock market, the loss due to exclusions is 30 times 50% times 0.25–0.50% equals 4–7%. See Barr and Diamond (Citation2010) for a similar calculation to gauge the effect of administration costs on final pensions.
References
- Andersson, M., P. Bolton, and F. Samama. 2016. “Hedging Climate Risk.” Financial Analysts Journal 72 (3): 13–32.
- Angel, J., and P. Rivoli. 1997. “Does Ethical Investing Impose a Cost upon the Firm? A Theoretical Perspective.” Journal of Investing 6 (4): 57–61.
- Asness, C. 2017. “Virtue Is Its Own Reward: Or, One Man’s Ceiling Is Another Man’s Floor.” AQR. https://www.aqr.com/insights/perspectives/virtue-is-its-own-reward-or-one-mans-ceiling-is-another-mans-floor.
- Barr, N., and P. Diamond. 2010. Pension Reform: A Short Guide. Oxford: Oxford University Press.
- Bauer, R., and D. Hann. 2010. “Corporate Environmental Management and Credit Risk.” SSRN working Paper, No. 1660470.
- Berg, F., K. Fabisik, and Z. Sautner. 2020. “Rewriting History II: The (Un)predictable Past of ESG Ratings.” SSRN Working Paper, No. 3722087.
- Berg, F., J. Kölbel, and R. Rigobon. 2019. “Aggregate Confusion: The Divergence of ESG Rating.” SSRN Working Paper, No. 3438533.
- Blitz, D., and W. De Groot. 2019. “Passive Investing and Sustainability Integration Are Fundamentally Irreconcilable Investment Philosophies.” Journal of Portfolio Management 45 (4): 7–11.
- Blitz, D., and F. Fabozzi. 2017. “Sin Stocks Revisited: Resolving the Sin Stock Anomaly.” Journal of Portfolio Management 44 (1): 105–111.
- Blitz, D., and L. Swinkels. 2020. “Is Exclusion Effective?” Journal of Portfolio Management 46 (3): 42–48.
- Blitz, D., and L. Swinkels. 2021. “Who Owns Tobacco Stocks?” Working Paper.
- Blitz, D., L. Swinkels, and J. A. van Zanten. 2021. “Does Sustainable Investing Deprive Unsustainable Firms of Fresh Capital?” Journal of Impact and ESG Investing 1 (3): 10–25.
- Blitz, D., P. Van Vliet, and G. Baltussen. 2020. “The Volatility Effect Revisited.” Journal of Portfolio Management 46 (2): 45–63.
- Bolton, P., and M. Kacperczyk. 2021. “Do Investors Care About Carbon Risk?” Journal of Financial Economics. doi:10.1016/j.jfineco.2021.05.008.
- Bossaerts, P., P. Ghirardato, S. Guarnaschelli, and W. Zame. 2010. “Ambiguity in Asset Markets: Theory and Experiment.” Review of Financial Studies 23 (4): 1325–1359.
- Caldecott, B. 2018. Stranded Assets: Developments in Finance and Investments. Abingdon: Routledge.
- Clark, G. L., A. Feiner, and M. Viehs. 2014. “From the Stockholder to the Stakeholder. How Sustainability Can Drive Financial Outperformance.” University of Oxford and Arabesque Partners.
- Cojoianu, T., F. Ascui, G. Clark, A. Hoepner, and D. Wójcik. 2021. “Does the Fossil Fuel Divestment Movement Impact New Oil and Gas Fundraising?” Journal of Economic Geography 21 (1): 141–164.
- De Groot, W., J. De Koning, and S. Van Winkel. 2021. “Sustainable Voting Behavior of Asset Managers: Do They Walk the Walk?” Journal of Impact and ESG Investing 1 (4): 7–29.
- Derwall, J., K. Koedijk, and J. Ter Horst. 2011. “A Tale of Values-Driven and Profit-Seeking Social Investors.” Journal of Banking and Finance 35 (8): 2137–2147.
- Dimson, E., O. Karakaş, and X. Li. 2015. “Active Ownership.” Review of Financial Studies 28 (12): 3225–3268.
- Dimson, E., P. Marsh, and M. Staunton. 2017. “Factor-Based Investing: The Long-Term Evidence.” Journal of Portfolio Management 43 (5): 15–37.
- Dimson, E., P. Marsh, and M. Staunton. 2020. “Exclusionary Screening.” Journal of Impact and ESG Investing 1 (1): 66–75.
- Easley, D., and M. O’Hara. 2009. “Ambiguity and Nonparticipation: The Role of Regulation.” Review of Financial Studies 22 (5): 1817–1843.
- Fabozzi, F., A. Lamba, T. Nishikawa, R. Rao, and K. Ma. 2019. “Does the Corporate Bond Market Over-Value Bonds of Sin Companies.” Finance Research Letters 28 (March): 165–170.
- Fabozzi, F., K. Ma, and B. Oliphant. 2008. “Sin Stock Returns.” Journal of Portfolio Management 35 (1): 82–94.
- Fama, E. F., and K. R. French. 2015. “A Five-Factor Asset Pricing Model.” Journal of Financial Economics 116 (1): 1–22.
- Flammer, C. 2021. “Corporate Green Bonds.” Journal of Financial Economics. doi:10.1016/j.jfineco.2021.01.010.
- Friede, G., T. Busch, and A. Bassen. 2015. “ESG and Financial Performance: Aggregated Evidence from More Than 2000 Empirical Studies.” Journal of Sustainable Finance and Investment 5 (4): 210–233.
- Goyal, A., and S. Wahal. 2008. “The Selection and Termination of Investment Management Firms by Plan Sponsors.” Journal of Finance 63 (4): 1805–1847.
- Harjoto, M., A. Hoepner, and Q. Li. 2021. “Corporate Social Irresponsibility and Portfolio Performance: A Cross-National Study.” Journal of International Financial Markets, Institutions and Money 70: 101274.
- Hong, H., and M. Kacperczyk. 2009. “The Price of Sin: the Effect of Social Norms on Markets.” Journal of Financial Economics 93 (1): 15–36.
- Hsu, P., K. Li, and C. Tsou. 2020. “The Pollution Premium.” SSRN Working Paper, No. 3578215.
- Hsu, J., X. Liu, K. Shen, V. Viswanathan, and Y. Zhao. 2018. “Outperformance Through Investing in ESG in Need.” Journal of Index Investing 9 (2): 18–26.
- Jansen, R., and R. Van Dijk. 2002. “Optimal Benchmark Tracking with Small Portfolios.” Journal of Portfolio Management 28 (2): 33–39.
- Kahneman, D., and A. Tversky. 1979. “Prospect Theory: An Analysis of Decision Under Risk.” Econometrica 47 (2): 263–291.
- Kotsantonis, S., C. Pinney, and G. Serafeim. 2016. “ESG Integration in Investment Management: Myths and Realities.” Journal of Applied Corporate Finance 28 (2): 10–16.
- Pástor, L., R. Stambaugh, and L. Taylor. 2020. “Sustainable Investing in Equilibrium.” Journal of Financial Economics. doi:10.1016/j.jfineco.2020.12.011.
- Pedersen, L., S. Fitzgibbons, and L. Pomorski. 2020. “Responsible Investing: The ESG-Efficient Frontier.” Journal of Financial Economics. doi:10.1016/j.jfineco.2020.11.001.
- Pizzutilo, F. 2017. “Measuring the Under-Diversification of Socially Responsible Investments.” Applied Economics Letters 24 (14): 1005–1018.
- Semieniuk, G., E. Campiglio, J. Mercure, U. Volz, and N. Edwards. 2020. “Low-Carbon Transition Risks for Finance.” WIREs Climate Change 12 (1): e678.
- Statman, M., and D. Glushkov. 2009. “The Wages of Social Responsibility.” Financial Analysts Journal 65 (4): 33–46.
- Swinkels, L. 2021. “Allocating to Green Bonds.” SSRN Working Paper, No. 3813967.
- Zerbib, D. 2020. “A Sustainable Capital Asset Pricing Model (S-CAPM): Evidence from Green Investing and Sin Stock Exclusion.” SSRN Working Paper, No. 3455090.