
 ?Mathematical formulae have been encoded as MathML and are displayed in this HTML version using MathJax in order to improve their display. Uncheck the box to turn MathJax off. This feature requires Javascript. Click on a formula to zoom.
ABSTRACT
For stock market investors, it is difficult to choose where to allocate their financial resources; furthermore, sustainable investment has become a choice to ensure better financial performance (FP). This research proves that countries and companies lined up with climate change laws are better options for investing and mitigating risks. The sample of the study is based on a net zero emission criteria, so six countries were identified with approved legislation, and a comparison between the largest market cap firms of these countries and the largest market cap of the world (Benchmark) is made to analyze their FP during the COVID-19 first year. Furthermore, regression models were run to review which ESG factor is the most related to predicting the ESG combined score for the firms. The results show that the firms had a better performance than the Benchmark and that the social factor ‘S’ is the most correlated to the ESG combined score. The relevance of this article lies with the relevance of investing in companies aligned with net zero emissions laws since they contribute to improving the expected return even in a volatile era.
Introduction
We live in a globalized world where jobs, productive sectors, financial markets, and lifestyles have changed. The risk-return that this globalization brought made all the financial actors focus on managing the various risks, including climate change (NGFS Citation2019).
Companies determine how risks should be managed based on their risk appetite and tolerance. The financial area has the task of identifying them and measuring possible consequences to eliminate or reduce their effects with the minimum investment of resources (Ekwere Citation2016). For stock market investors, it is difficult to choose where to allocate their capital, so it is essential to prove whether the sustainable investment has a better performance and profitability or not. Sustainable investments are booming worldwide (Lobe and Walkshäusl Citation2014), and integrating Environmental, Social, and Governance (ESG) factors into analysis and decision-making has seen a relevant rise over the past years (Kell Citation2020).
One of the actions that companies have implemented in recent years to be considered responsible investments is the implementation of projects and activities that can be measured and reported with an ESG score. Due to the increase in global sustainable investments, the commitment of financial markets toward ESG criteria within investment decisions has increased: the industry has reached USD 35.3 trillion under management, a growth of 15% in two years, and a total equating to 36% of all professionally managed assets (GLOBAL SUSTAINABLE INVESTMENT ALLIANCE Citation2020).
The environmental factor ‘E’ is the most linked to legislation and norms; the remarkable example is ‘The Paris Agreement,’ a landmark in the multilateral climate change process, and, for the first time, it is a binding agreement that brings all nations into a common cause to undertake ambitious efforts to combat climate change. It is seen as an essential growth for countries that legislate in favor of climate change (United Nations Citation2016).
Under the Paris Agreement, governments agreed to achieve net zero greenhouse gas emissions in the century’s second half. The IPPC Special Report on Global Warming found that to stand a good chance of limiting global warming to 1.5C, global CO2, and other GHG emissions, countries must reach net zero by 2050 and 2070, respectively (Climate Action Tracker Citation2020). According to The Energy and Climate Intelligence Unit, only two countries are currently negative in emissions, Bhutan and Suriname, and 17 countries have already approved laws that establish the Net Zero goal (ECIU Citation2021).
The Principles for Responsible Investments (PRI) organization established a new 2021–2024 strategic plan under the framework of its 10-year Blueprint for Responsible Investments. It consists of building a bridge between financial risk, opportunities, and real-world outcomes; the PRI will help signatories understand what this looks like in practice, how to integrate, and how to measure outcomes while remaining grounded in fiduciary duty and the broader role of investors in society (Principles for Responsible Investments Citation2022).
Knowing the seriousness of climate change as a risk and its potential driver for a future crisis is essential to analyze the financial performance (FP) of companies in times of crisis, such as the one created by covid 19, and corroborate the theory of In, Park, and Monk (Citation2019) – which states that carbon-efficient firms tend to be ‘good firms’ in terms of financial characteristics and corporate governance- is fulfilled (In, Park, and Monk Citation2019).
Alongside, ESG performance mitigates financial risk during financial crisis (Broadstock et al. Citation2021), but because the ESG ratings disagree between different providers or agencies (Berg, Klbel, and Rigobon Citation2019), it is difficult to measure and compare the performance. Besides, Atz et al. (Citation2021) analyzed nearly 1,150 studies between 2015 and 2020 and concluded that the ‘financial performance of ESG investing has, on average, been indistinguishable from conventional investing’ (Atz et al. Citation2021). Other studies demonstrated that companies with good ESG ratings performed better during covid 19. However, it was biased due to the method for measuring the ESG rating, and as mentioned by Demers et al. (Citation2021), ‘ESG offers no such positive explanatory power for returns during the COVID crisis’ (Demers et al. Citation2021).
So, this study seeks to be a tool for investors interested in climate change risk. Its main objective is to corroborate whether the companies of a country with Net Zero legislation will perform better than those who do not. Fankhauser et al. (Citation2022) state that net zero emission is a form of global risk management since it ‘requires operationalization in varied social, political and economic spheres.’ and good risk management creates value (Fankhauser et al. Citation2022).
As financial crises generally coincide with periods in which risk aversion increases (Coudert and Gex Citation2008), the relevance of this research is that it provides evidence that countries and companies lined up with climate change laws are better options for investing and mitigating risks, especially in a volatile era, and to understand how ESG factors are related to the ESG score of the firm.
The findings in this article show that countries such as Sweden, Denmark, and the United Kingdom, which have already approved the legislation, have a better FP than other benchmark companies in the same sector. Next, the literature review is presented to know previous related studies and their most relevant findings, as well as the approach of our research hypotheses, the methodology, main results, and conclusions.
Literature review
Sustainable investment perspective during the COVID-19 crisis
Sustainable investment is a term inclusive of investment approaches, and it considers the ESG factors in portfolio selection. The most common sustainable investment strategy is ESG integration, followed by negative screening, corporate engagement and shareholder action, norms-based screening, and sustainability-themed investment (GLOBAL SUSTAINABLE INVESTMENT ALLIANCE Citation2020).
The term ESG was first coined in 2005 in a landmark study entitled ‘Who Cares Wins.’ The report made the case that embedding environmental, social, and governance factors in capital markets make good business sense and lead to more sustainable markets and better societal outcomes (Kell Citation2018). Stakeholders are increasingly exerting pressure on companies to have more sustainable behavior and provide detailed information about sustainability through adequate disclosure policies (Raimo et al. Citation2021).
The first policy initiatives directly related to ESG date back to 2018, created by the European Commission, and since then, climate change has been the most critical issue to investors. For this reason, the EU has signaled that it regards climate change and human rights as linked issues, so the social aspect of ESG is covered as an annex to environmental regulation (Clifford Chance Citation2020; Andrieux Citation2021).
A study presented by Whelan et al. (Whelan, Clark, and Atz Citation2021) examined the relationship between ESG and financial performance from articles written before 2015, and they found a positive correlation between ESG performance and operational efficiencies, stock performance, and lower cost of capital. Other authors (Friede, Busch, and Bassen Citation2015), analyzed the findings of 2200 individual studies; most of them report positive ESG–Corporate financial performance relation and that this relation seems to be stable over time.
A recent study made by Cheema-Fox et al. (Citation2021) looked at the initial stock market reaction to the COVID-19 crisis (up to March 23) and found that companies scoring high on a ‘crisis response’ measure (based on human capital, supply chain, and products and services ESG sentiment) were associated with 1.4–2.7% higher stock returns (Cheema-Fox et al. Citation2021). Therefore, Yoshino, Taghizadeh-Hesary, and Otsuka (Citation2021) suggest that the best way is to adopt international GHG (CO2, NOx) and plastic taxation systems; this will ultimately lead to optimal asset allocation, achieve sustainable growth, and will increase their rate of return (Yoshino, Taghizadeh-Hesary, and Otsuka Citation2021).
Safer investment strategies increase during crisis periods, so investors become more attentive to corporate fundamentals and find refuge in the ESG approach as it focuses on the long-run sustainability of firms (A. Singh Citation2020). The Covid-19 virus has not stopped the growth of ESG investing, which has better than average returns since the pandemic’s start; intelligent ESG investing is bound to become the new normal (Forbes and Georg Kell Citation2020).
The most significant amount of sustainable investing assets are in Europe, totaling US$14.1 trillion, followed by the United States with US$12 trillion and investment managers are likely to respond to this demand by potentially launching up to a record 200 new ESG funds by 2023, more than double the previous three years (Deloitte Citation2020a).
Kim, Kim, and Qian (Citation2018) suggested that a company’s sustainable practices increase a firm’s reputation and performance due to its commitment to the well-being of future generations (Kim, Kim, and Qian Citation2018). Companies are coping with pressures received by stakeholders and society to rethink their business in a more ethical and sustainable way to come up against the changes our society is facing (Bogers, Chesbrough, and Strand Citation2020). Firms with a sustainable business model are expected to bear the brunt in a much more effective manner (A. Singh Citation2020). The degree of responsibility of a company is often measured by its activities from the perspective of ESG factors. An investment style that focuses on such aspects is called SRI or ESG investment (Omura, Roca, and Nakai Citation2021).
The performance of the MSCI-SRI index amplifies the attractiveness of this type of investment. However, market participants would be interested in knowing whether this outperformance becomes even more significant in crisis periods such as during the current pandemic and whether this more significant outperformance can continue to be attributed to ESG factors (Deloitte Citation2020a). The ETF that replicates the behavior of this index is AMUNDI INDEX MSCI EUROPE SRI – UCITS ETF DR.
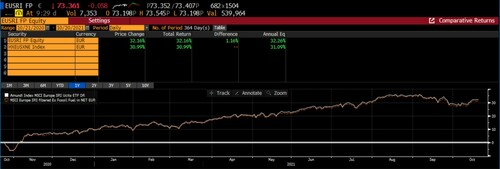
Another ETF that has had a good performance in the last year is The Lyxor Net Zero 2050 S&P Eurozone Climate (ZPAB: TH); it was launched in July 2020 on the EURONEXT PARIS Exchange. The ETF tracks the performance of the S&P Eurozone LargeMidCap Paris-Aligned Climate Net Total Return Index, which is composed of companies from the S&P Eurozone Large MidCap that are compatible with a 1.5° global warming climate scenario. The fund invests in five main sectors: Financial Services, Consumer Cyclical, Technology, HealthCare, and Industrial (Morningstar Citation2021).
For both ETFs, the returns have been increasing in the last year and are currently up to 30% annually. The following figures show the ETF’s historical returns compared with their respective indexes ( and ):
Figure 1. UCITS ETF’s historical returns.
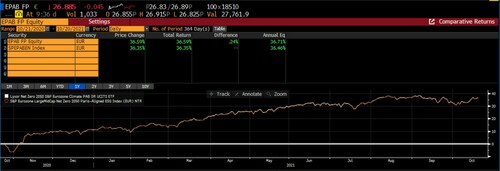
Figure 2. ZPAB:TH ETF’s historical returns.
Esg risk management
Financial crises coincide with a period of risk aversion (Coudert and Gex Citation2008); the ongoing Covid-19 pandemic and the Russia-Ukraine war have induced chaos and turbulence in financial markets, superior to the turbulence seen in the Global Financial Crisis in 2008–2009. The standards around ESG reporting could not be different from all those factors that must be reported in non-financial information, including the factors considered as risks that are the ones that have the most progress in legislation. The lack of global rules means that each factor separately (such as the climate) or together (such as ESG) is reported in various ways, with the bit of existing legislation that should have the attention of companies to avoid legal risk.
For Gözlügöl (Citation2021), ESG has recently become a mainstream issue for companies and institutional investors. Without achieving sustainability and their transition in line with the net zero carbon goals, it will not be possible to keep global warming in check (Gözlügöl Citation2021). As main contributors to climate change, companies must be part of the solution by transitioning to net zero by 2050.
Risk identification plays an essential role in determining which risks are likely to affect the project; defining the climate change risk would seem to be the most critical task because, with the definition, we could identify this risk and all those that are a consequence of it. However, it is precisely at this point that the global problem begins, the lack of homogeneous definitions and frameworks.
Over the last few years, firms have considered the sum of individual risks as a combination of interrelated risks; this concept is usually referred to as Enterprise Risk Management (ERM) (Stoian and Stoian Citation2018). Trying to define ERM globally is, again, a problem. Enterprise-Wide Risk Management (EWRM), Holistic Risk Management (HRM), Corporate Risk Management (CRM), Business Risk Management (BRM), Integrated Risk Management (IRM), and Strategic Risk Management (SRM) have quite similar meanings with the ERM (Rizal Razali and Tahir Citation2011). Again, the definition finds a second obstacle, the number of existing frameworks which will be dependent on the industry, goals, organizational structure, technology infrastructure, and available resources (Smartsheet Contributor Andy Marker Citation2021).
ERM is an essential factor for rating organizations but is not legally required. No statutes or federal court cases require an ERM framework for private enterprises, although ERM is accepted as a value-contributing best practice. (Whitman Citation2015). Most risk disclosure regulations were created because of financial scandals, and the demand for transparent risk disclosure has increased. Consequently, new regulations have been introduced to widen the scope of risk reporting and enhance the disclosure of financial risk (Cordazzo, Papa, and Rossi Citation2017).
As suggested by Colas et al., climate change risk should be treated as a financial risk (Colas, Khaykin, and Pyanet Citation2019); alongside, the company should create its risk taxonomy. The risk taxonomy spells out the key terms and definitions a firm uses to describe its risks and creates the language used for risk identification in key end-to-end business processes. (Boultwood Citation2021). Climate change is an environmental risk that is often not well understood by the public. While studies have accounted for people’s risk perceptions and propensity to engage in risk-taking behaviors, the perception of climate change risks is slightly more complex (Etkin and Ho Citation2007).
The Framework Convention on Climate Change (FCCC) focused on international policy, and the Intergovernmental Panel on Climate Change (IPCC), which focused on scientific assessments in support of the FCCC, used different definitions of climate change (Pielke Citation2004). Climate change is a long-term change in a region’s typical or average weather. Climate Change, Global Warming, and, more recently, Climate Emergency has been, in the past decade and longer, terms synonymous with the greatest sustainability challenge of the 21st century (Santos and Bakhshoodeh Citation2021).
Suppose the disclosure of the risks (which are part of the non-financial reports) depends on non-global legislation. In that case, the situation of the disclosure of non-financial information has the same characteristic. No dominating global standards for non-financial reporting can be compared to International Financial Reporting Standards and the US GAAP. Nowadays, organizations could decide to avoid any form of non-financial reporting entirely or to cherry-pick and even fabricate positive information to be included in glossy reports to strengthen their social and environmental credentials (Monciardini, Mähönen, and Tsagas Citation2020).
Part of the motivation for some corporations to increase ESG disclosures is to avoid or mitigate the risk and the associated financial penalties (Murphy and McGrath Citation2013). The legislation in each country is the biggest driver for companies to start reporting non-financial factors more precisely, including risks. ‘To assess the impact of the crisis on the economy, it is important to determine the actual task of assessing risks and the potential damage and to reduce risks when they affect the growth dynamics by structural analysis’ (S. Sukharev Citation2020). In addition, ESG activities help companies to build strong equity and a loyalty brand that leads to higher resilience against economic downturn (Omura, Roca, and Nakai Citation2021).
Esg firms’ criteria and reporting
In the United States, Asia, and Europe, institutional investors ask the regulators, such as the SEC or ESMA, for a consistent framework and taxonomy that applies to ESG investments (Deloitte Citation2020b). In the absence of a worldwide framework recognized, the companies have diverse options to report ESG; the disclosure and measurement have variations; therefore, the financial professional must know each one to make informed decisions. In addition, it is known that one of the biggest problems that ESG reports have, is comparability.
Five frameworks- and standard-setting are the most used worldwide: 1. CDP, 2. the Climate Disclosure Standards Board (CDSB), 3. the Global Reporting Initiative (GRI), 4. the International Integrated Reporting Council (IIRC), and 5. the Sustainability Accounting Standards Board (SASB) (CDP Citation2020). According to the Sustainable Stock Exchanges Initiative, the most widely used framework is the GRI. In October 2020, two standard-setting groups, SASB and the IIRC announced that they would be merging, and the CDSB may be joining them as well (Cohn Citation2020).
Now that they are complementary, the IIRC functions as a framework that connects corporate value creation activities across six areas or ‘capitals’: financial, manufactured, intellectual, human, social and relationship, and natural; while SASB standards enable non-financial data of companies in the same industry to be compared, a crucial feature for investors (See Tho Citation2020), while the CDSB offers companies a framework for reporting environmental and climate information with the same rigor as financial information (CDSB Citation2020).
Leadership and top management, as well as ethical policy, play a critical role in enhancing the environmental performance of companies, and they need to seek green innovation as a pathway to enhance competitive advantage (S. K. Singh et al. Citation2020). Also, being certified aggregate value to companies in diverse sources of strategy such as branding, reliability, risk analysis, social and environmental responsibility, ethics, and as a consequence, financial performance (Scarlat and Dallemand Citation2011; Mol and Oosterveer Citation2015).
The Dow Jones Sustainability Index and FTSE4 Good indexes are examples of sustainability indexes that combine companies that comprise a public commitment to sustainable development and follow the world standards such as the Global Reporting Initiative, Quality Management (ISO 9001:2015); Environmental Management (ISO 14001:2008); Health and Safety at Work (OHSAS, 18001:1999 and ISO 45001:2018); Social Responsibility (ISO 26000:2010) and Energy Management Systems (ISO 50001:2018).
Cezarino and other authors (2020) conducted a study in Brazil to verify if two public companies reinvest in sustainability metrics in a crisis economic scenario, founding that there is an evolution of companies but with a reduction in proportional value. The companies maintain their investments and even increase them in a financial crisis scenario. Others recent studies affirm that the behavior of companies is not influenced only by economic context but by culture, values, and behavior adjustments over time. Certified companies seem to be aware of the positive results of sustainability efforts for their strategy choices (Cezarino et al. Citation2020).
Another research made by Wong et al. (Citation2021), from a sample of Malaysian listed firms, over the period 2005–2018, showed that on average, a firm’s cost of capital reduces by 1.2%, while Tobin’s Q increased by 31.9%, upon receiving an ESG rating. These findings demonstrate the benefits to stakeholders from firms pursuing an ESG agenda (Wong et al. Citation2021).
Based on all the previous content and literature, the following hypotheses are proposed:
H0 I: The firms whose country has a net zero approved legislation have better financial performance than those without legislation in the crisis era.
H0 II: The environmental (E) factor has a more significant significance than the social (S) and governance (G) factors for predicting the ESG combined score that firms report.
Methodology
The study encompasses the comparative financial performance between the most prominent market capitalization companies of the six countries that have already approved net zero legislation (as of the date this research was started) with the top world companies for ten industries: Energy, Industrials, Basic Materials, Real Estate, Healthcare, Utilities, Consumer Cyclicals, Consumer Non-Cyclicals, Financials and Technology. These countries are Sweden, the United Kingdom, France, Denmark, Hungary, and New Zealand, referred to as ‘green countries’ for practice effect. The industry classification used is ‘The Refinitiv® Business Classification (TRBC)’ (Refinitiv Citation2021).
The collected data was ordered as a panel with the companies being the individuals and the year the time-indexed variable. With it, the goal is to use different approaches and regression specifications to measure the impact of certain variables on the ESG score.
For the literature part, it was searched literature and information from analog research to have a deep background of what it has done in terms of ESG reporting, net zero legislation, and sustainable investment. In addition, this search helped us to find which countries and firms already have environmental-approved legislation.
Research design and sample
The study was divided into three phases: firstly, 6 ‘green countries,’ 10 sectors, 60 listed companies from the respective countries and sectors, and 10 listed world’s largest market cap firms are identified (Appendix A shows this information); the data are extracted from TRBC Refinitiv database as of March 11, 2020. Ten of the thirteen sectors are included in this research: energy, basic materials, real estate, utilities, health care, utilities, consumer cyclicals, consumer non cyclicals, financials, and technology. Academic and educational services, government activity and institutions, and the associations and organizations sectors are not considered due to the market exchange size.
Secondly, a financial performance analysis was made considering the total annual returns of the green firms and the industry’s largest market cap companies; our study assumes one year of analysis regarding COVID-19, this is from March 11, 2020, to March 11, 2021 (as a reference when the World Health Organization confirmed it was considered a pandemic).
Finally, the statistical and regression analysis was made to corroborate if the significant variables were consistent among the countries; it was used 15 annual periods of ESG scores to determine whether hypothesis II could be accepted or not. The final sample is composed of 787 data.
‘Green countries’ selection
In June 2017, Sweden’s Riksdag decided by a large political majority to introduce a climate policy framework with a climate act for Sweden. This framework is the most crucial climate reform in Sweden’s history and sets out the implementation of the Paris Agreement in Sweden. As a result, by 2045, Sweden will have zero greenhouse gas emissions into the atmosphere. This country has intermediate measurements for 2030 and 2040 emission reductions based on 1990 (Swedish Environmental Protection Agency Citation2017).
The UK also has 1990 as a base year for intermediate goals and aims to be zero emissions by 2050; this was expressed in the law of June 2019. The government is already working towards its commitment to reduce emissions in 2030 by at least 68% compared to 1990 levels through the UK’s latest Nationally Determined Contribution, the highest reduction target made by a major economy (Gov.UK Citation2021).
Shortly after the UK announced its climate change ambitions, France announced in June 2019 its legislation to reach net-zero greenhouse gas emissions by 2050 (base year, 1990). France, a nation that relies heavily on nuclear power, is looking to ramp up its development of low-carbon sources and renewable hydrogen while aiming to phase out coal-fired power plants by 2022 (Murray Citation2020).
In 2019, also Denmark defined the climate targets for the country. The Danish Climate Act sets a near-term target of reducing Denmark’s total greenhouse gas emissions by 70% by 2030 compared to the 1990 level and sets a long-term target of achieving climate neutrality by 2050 at the latest (Climate Programme Citation2020). In addition, new Zealand passed multipartisan climate legislation in late 2019 that set a target of net zero by 2050 for CO2 emissions and set up an independent expert body, the Climate Change Commission, with the primary goal of deciding a path to get there (Morton Citation2021).
Finally, in mid-2020, Hungary issued a law passed by parliament; the law reaffirmed Hungary’s 2030 target of a 40% cut in emissions from 1990 levels and looking for a climate neutrality goal for 2050 (Darby Citation2020).
Statistics and regression models
ESG partial and combined scores and financial indicators of the firms were obtained from TRBC Refinitiv, and cleaning and homologation data was done. Refinitiv collects this ESG information through a firm’s corporate social responsibility (CSR) or sustainability report, annual reports and websites, and other public sources, as well from direct contact with the firm. The ESG score (range from 0 to 100) is computed from 120 quantitative and qualitative measures across the environment, social, and governance dimensions using Refinitiv’s calculation.
With this data, some descriptive statistical analysis is made. It was essential to observe the average, median, and standard deviation of the ESG scores between the green country’s firms related to the non-green and largest company in the world. For the regression equation, and because of the panel disposition of the information, the following model is presented:
Where
is the ESG Combined Score for each firm
in each period
, while the regressors are
for ESG Controversies,
for Environmental Pillar Score,
for Social Pillar Score and
for Government Pillar Score. With this, it is analyzed how much the ESG Combined Score changes when each independent variable changes by one unit.
Results
After analyzing the total return performance graphs, descriptive statistics, histograms, and regression test, the H0 I is accepted, and H0 II must be rejected.
Green countries’ firms vs. Benchmark total return performance: H0 I
The total return analysis corroborates that for all sectors, the green country firm performs better than the largest world market cap firm, respectively. One example is the ‘utilities’ sector, where the Minesto AB Swedish firm has excellent performance (the other sectors and graphs can be seen in Appendix B) ().
Figure 3. Green countries firm’s vs benchmark performance: utilities sector.
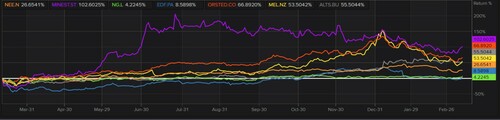
From the analysis, four Swedish firms of the ten sectors perform better in the first pandemic year than the Benchmark; these sectors are basic materials, utilities, financials, and technology; it should be noted that Sweden is the country with the most ambitious legislation regarding net zero emissions, which expects zero emissions by 2045. In second place is Denmark, which in 3 sectors have performed better than the Benchmark, these sectors are consumer cyclicals, industrials, and energy.
The following table shows that in all the green countries, at least one company performed better than those without net zero legislation, even in the financial crisis era ().
Table 1. Green countries vs Benchmark complying the HP1.
Statistical analysis and regression models: H0 II
It analyzed some descriptive statistics for all the variables used in the regression; these are shown in :
The minimum and maximum total annual return values are very extreme according to the mean; there are important outliers’ points. For example, the mean of all the ESG factors scores is above 60 except for the ESG combined score, and some firms have a 0 score for the environmental factor; these are firms that have not approved legislation (benchmarks).
Table 2. Descriptive statistics data for variables.
Also, the Pearson correlation was calculated for the five variables. shows the results:
E & S factors are almost in the same measure correlated to the ESG combined score with 0.679 and 0.688, respectively; the ESG controversies score has a positive but not too strong linear relation to the ESG combined score however it has a negative relation to the ESG factors (almost the same measure) as some authors argument in other studies (Nirino et al. Citation2021); for instance, every time that the ESG controversies score increase in one point the environmental pillar score decrease in 0.224 points.
Figure 4. Histogram of ESG combined scores: green countries vs Benchmark.
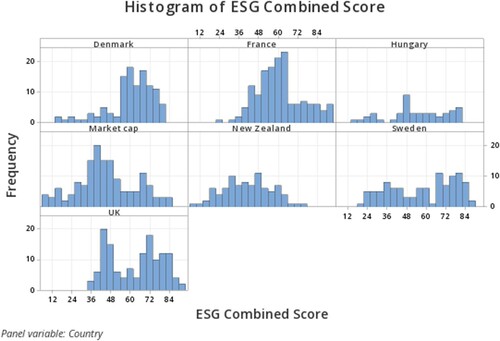
Table 3. Correlations at 95% confidence interval.
For the regression analysis, four models were computed depending on the type of regression proposed. The first one is the estimations for the Pooled OLS Model; that is, a simple regression with the previously defined variables ( and ).
Figure 5. Interval and mean plot of ESG combined score.
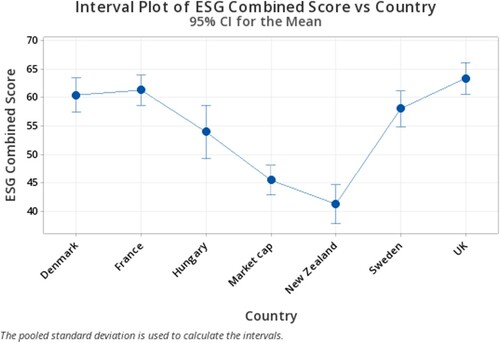
Table 4. Pooled OLS Model.
The coefficient of determination is high, so the model fits very well; the data explains 92.27% of the dependent variable’s variation. Also, the results for each country are consistent in terms of ESG factors coefficients. The social pillar score is the control variable most related to the ESG combined score (for all the data as well for each country), every time the social score changes by one point, the ESG combined score increases by 0.4236 points; this finding does not agree with the H0 II which stipule that the most representative variable is the environmental one. The environmental pillar score represents the least relevant of the considered variables, with a sensitivity of 0.2601 points of ESG for every increment.
The second model is the estimations for the First Difference Model, where the variables turn into the increment from one year to another for each company. By making the transformation, the intertemporal impact of a change in the regressors is captured and measured through the slopes of the model. This model corresponds with the first differences, and it is possible to consider the dynamic impact of the change in indicators over the ESG. In this case, the variable is presented in levels, so the interpretation of the estimates is the increment in points and not the percentual variation as is common for time series models ().
Table 5. First difference model.
The first thing to notice from this specification is the insignificance of the intercept coefficient; this is a common feature in most of the first difference time series models. Secondly, the significance of the rest of the variables shows that the intertemporal impact is present and not only in the cross-sectional OLS model. For our case, the social pillar score presents once more as the driver of the phenomenon with an increment of 0.41 points in ESG for every increment in the social pillar score. Following is the controversies variable with a sensitivity of 0.2895. In this case, the environmental pillar score is the least relevant.
The third analysis is the Fixed Effects Model, meaning the recognition of the heterogeneity between companies. In this specification, the parameter, considered constant in the OLS, is now allowed to change among the individuals, turning into
().
Table 6. Fixed effects model.
In this specification, the intercept is not explicitly included in the table as there is one for each company. Nevertheless, it is also relevant to consider the significance of the rest of the variables. The order of importance remains; however, it is noticeable that the coefficients are reduced in magnitude compared with the pooled model. Furthermore, the adjusted R square is now 87.93%. Even though the values are reduced, it may be considered that the estimates are more consistent considering the panel structure of the data.
Finally, the Random Effects Model is computed to recognize the unobserved heterogeneity among individuals ().
Table 7. Random effects model.
The estimated coefficients in this specification show similar behavior to those of the previous models. Once more, the highest impact comes from the social pillar score, followed by controversies, and in last place, the environmental one. In this case, the adjusted R square becomes 90%, so it might indicate better performance. Nevertheless, more robust criteria are needed to compare and choose among the presented models correctly. First, the Lagrange Multiplier test allows us to consider the potential benefit of moving from a pooled OLS regression to a Random Effects model. The p-value of the test is 2.2 × 10(−16), meaning the rejection of the null hypothesis so that the Random Effects computation would be preferred. Secondly, the Hausman test is performed over the last two models to detect inconsistencies in the model. The p-value of the test is 0.0013, meaning the rejection of the null hypothesis once more. In this case, the Fixed Effects model is the one selected that better captures the impact of the variables over the dependent one.
Result discussion
The closer the date on which a country plans to achieve zero emissions, the better the total return performance for the companies in the country. The intermediate goals that each country has before reaching zero emissions also positively affect financial performance. This study was based on net zero emission dates and not on the evaluation of the effectiveness of the laws. The countries’ approval of net zero emissions laws motivates companies to begin their sustainable strategic plan, even if it represents more expenditure since the production process must be modified.
In the context of climate change, there is a controversial point. Some research argues that despite the environmental aspect of sustainability coming to the forefront, its potential clash with the social aspect or interests should be noted (Gözlügöl Citation2021b); the net zero transition will not be inclusive for all. In certain regions and sectors, such as energy, there can be significant adverse effects on the workforce and communities; this is because many workers tend to be replaced by machines or technology or must be trained in their use.
Contrary to what was found in this research, some authors like Zhou et al. (Citation2020) stated that ‘Environmental regulations are negatively related to companies’ financial performance. The government’s environmental regulation policies have a restraining effect on the financial performance of enterprises’. This case was in China, where there is not yet a net zero legislation approved (Zhou et al. Citation2020).
Based on our results and knowing the impact of controversies, we consider a possibility that companies with a better ESG controversies score can control (mitigate) it thanks to an effective communication department with management strategy.
Implementing ESG reporting can provide firm owners strong support and give them confidence in the decision-making process. When implementing and measuring activities related to ESG, it is possible to quantify which of them contributes the most marginal utility or cost. However, because there is no standard ESG legislation, companies cannot be compared based on the ESG reporting framework.
The policymakers and governments must contribute to the implementation of climate and ESG issues and support and advise countries on their environmental legislation process. In addition, they can help to develop environmental and social frameworks needed to provide alignment and comparability in the firms’ reports and create a global sustainability system for investors. Moreover, this will support signatory climate action in aligning portfolios towards net zero by 2050.
Knowing that investors incorporate ESG factors primarily as a method for mitigating risk and are typically motivated by hedging, it is much less critical as a tool for additional value creation (Przychodzen et al. Citation2016). We must begin to see ESG factors, in particular climate change, as a legal risk for companies and not as a method to generate higher returns. Various efforts have been made to achieve ESG reporting universally; some regulatory institutions, such as the SEC, have begun to request specific climate chain parameters that must appear in financial statements, but the main driver for companies to have the reporting disclosure and manage legal risk, will be the respective legislation.
Conclusions
H0 I is accepted, corroborating that for all the green countries, their firm’s performance is better than those that do not have any net zero legislation for the first pandemic year; and H0 II is refuted because the factor that has a major significance for predicting the ESG combined score is the social one and not the environmental. In the correlation test, the social factor has the highest positive correlation to the ESG combined score.
The elaboration of the fourth model and the best specification to describe data provide evidence of the high relationship among the independent variables with ESG. Since the Fixed Effects Model best suits the information, it is worth mentioning the implication of the heterogeneity of the firms that were selected to create the sample. Furthermore, this difference is constant through time, meaning that in the selected period, the factors that provided the uniqueness to the firms did not change. Based on the estimators of the coefficients, along the adjusted R square, it highlights that with only a few variables, the ESG may be explained. It is also relevant to observe the sensitivity of the dependent variable with the social pillar score, being the most relevant of the four models. This result provides insight into this indicator’s focus and marks the direction for further research.
In the countries with approved net zero legislation, at least one company for each analyzed sector performed better than the Benchmark. The most significant difference in performance is Sweden for the utilities sector, with 75.9 percentage points above the Benchmark. We found the slightest difference between one company and the Benchmark in the healthcare sector. Denmark was 1.7 percentage points above the Benchmark. On the other hand, this same sector had three countries that exceeded the Benchmark having only 4.6 percentage points, on average, above it.
From our selected sample, Sweden has three companies that already have a corporate strategy for this net zero goal (Lundin, H&M Hennes, and Ericsson); the UK has five companies with clear plans (AstraZeneca, BP, Compass, HSBC, Linde); France has two (L’Oréal and Schneider Electric), and Denmark has 3 (Orsted, Vestas Wind Systems A / S and Carlsberg). Neither New Zealand nor Hungary has companies registered with an emission plan.
If an investment portfolio uses ESG factors for asset allocation, investors will be much more likely to invest in countries like Sweden, New Zealand, the UK, and Denmark.
The sector with the best average compared to the Benchmark was industrials with 53.7 percentage points above. This performance was achieved thanks to 3 countries, Sweden, Denmark, and France, surpassing the Benchmark. The financials and the technology sector were the only two where a single country surpassed the Benchmark. In both cases, Sweden was the country that had the best performance in the year of study.
The present study contributes to the literature on sustainable finance, and our findings will be helpful to practitioners and researchers; investors can protect their financial wealth during the downturn by selecting companies aligned to the net zero legislation of its country, especially from Europe. It also contributes significantly to legislators and governments in proposing, reviewing, and approving environmental legislation that serves as a regulatory framework for companies to report their ESG indicators. For researchers, this work can be helpful to compare the financial performance of other types of assets, such as bonds, or to compare periods of greater stability. Finally, this research could be tested in other types of crises, like wars or financial crises, looking for the net zero countries hedge the financial risks.
It is worth remembering that ESG reporting is, until today, optional, so the current legislation in the countries is the leading source for a standardized reporting framework. However, ESG investing will become the new normal, and firms with adequate governance, environmental initiatives, and workplace efficiency are expected to be the reference for sustainable business models.
Supplemental Material
Download MS Word (1.3 MB)Disclosure statement
No potential conflict of interest was reported by the author(s).
References
- Andrieux, Jean-Baptiste. 2021. “Climate Change Tops List of Most Important ESG Concerns | Money Marketing.” https://www.moneymarketing.co.uk/news/climate-change-tops-list-of-most-important-esg-concerns/.
- Atz, Ulrich, Zongyuan Zoe Liu, Christopher Bruno, and Tracy van Holt. 2021. “Online Appendix: Does Sustainability Generate Better Financial Performance? Review, Meta-Analysis, and Propositions.” SSRN Electronic Journal 1–29. https://doi.org/10.2139/ssrn.3919652.
- Berg, Florian, Julian Klbel, and Roberto Rigobon. 2019. “Aggregate Confusion: The Divergence of ESG Ratings.” SSRN Electronic Journal 617: 1–50. https://doi.org/10.2139/ssrn.3438533.
- Bogers, Marcel, Henry Chesbrough, and Robert Strand. 2020. “Sustainable Open Innovation to Address a Grand Challenge.” British Food Journal 122: 1505–1517. https://doi.org/10.1108/BFJ-07-2019-0534.
- Boultwood, Brenda. 2021. “How to Develop an Enterprise Risk Taxonomy.” https://www.garp.org/risk-intelligence/culture-governance/how-to-develop-an-enterprise-risk-taxonomy.
- Broadstock, David C., Kalok Chan, Louis T.W. Cheng, and Xiaowei Wang. 2021. “The Role of ESG Performance During Times of Financial Crisis: Evidence from COVID-19 in China.” Finance Research Letters 38 (January): 101716. https://doi.org/10.1016/j.frl.2020.101716.
- CDP. 2020. “Five Global Organisations, Whose Frameworks, Standards and Platforms Guide the Majority of Sustainability and Integrated Reporting, Announce a Shared Vision of What Is Needed for Progress towards Comprehensive Corporate Reporting – and the Intent to Work.” https://www.cdp.net/en/articles/media/comprehensive-corporate-reporting.
- CDSB. 2020. “Global Sustainability and Integrated Reporting Organisations Launch Prototype Climate-Related Financial Disclosure Standard | Climate Disclosure Standards Board.” https://www.cdsb.net/corporate-reporting/1139/global-sustainability-and-integrated-reporting-organisations-launch.
- Cezarino, Luciana Oranges, Márcio de Queiroz Murad, Paulo Vinícius Resende, and Wisley Falco Sales. 2020. “Being Green Makes Me Greener? An Evaluation of Sustainability Rebound Effects.” Journal of Cleaner Production 269 (October): 121436. https://doi.org/10.1016/j.jclepro.2020.121436.
- Cheema-Fox, Alex, Bridget R. LaPerla, Hui (Stacie) Wang, and George Serafeim. 2021. “Corporate Resilience and Response to COVID-19.” Journal of Applied Corporate Finance 33 (2): 24–40. https://doi.org/10.1111/jacf.12457.
- Clifford Chance. 2020. “Legal Risk or Business Opportunity? Esg – Legal Risk or Business Opportunity ?” July.
- Climate Action Tracker. 2020. “Paris Agreement Turning Point.” Climate Action Tracker, no. June 2019: 18.
- Climate Programme. 2020. “Climate Programme 2020 Denmark’s Mid-Century, Long-Term Low Greenhouse Gas Emission Development Strategy.”
- Cohn, Michael. 2020. “IFAC Endorses International Sustainability Standard-Setting Board | Accounting Today.” https://www.accountingtoday.com/news/ifac-endorses-international-sustainability-standard-setting-board.
- Colas, John, Ilya Khaykin, and Alban Pyanet. 2019. “Climate Change Managing a New Financial Risk.” https://www.oliverwyman.com/content/dam/oliver-wyman/v2/publications/2019/feb/Oliver_Wyman_Climate_Change_Managing_a_New_Financial_Risk1.pdf.
- Cordazzo, Michela, Marco Papa, and Paola Rossi. 2017. “The Interaction Between Mandatory and Voluntary Risk Disclosure: A Comparative Study.” Managerial Auditing Journal 32 (7): 682–714. https://doi.org/10.1108/MAJ-01-2016-1308.
- Coudert, Virginie, and Mathieu Gex. 2008. “Does Risk Aversion Drive Financial Crises? Testing the Predictive Power of Empirical Indicators.” Journal of Empirical Finance 15 (2): 167–184. https://doi.org/10.1016/j.jempfin.2007.06.001.
- Darby, Megan. 2020. “Hungary Sets 2050 Climate Neutrality Goal in Law, Issues Green Bond.” https://www.climatechangenews.com/2020/06/04/hungary-sets-2050-climate-neutrality-goal-law-issues-green-bond/.
- Deloitte. 2020a. “Advancing Environmental, Social, and Governance Investing A Holistic Approach for Investment Management Firms A Report from the Deloitte Center for Financial Services.” www.deloitte.com/us/cfs.
- Deloitte. 2020b. “Advancing Environmental, Social, and Governance Investing A Holistic Approach for Investment Management Firms A Report from the Deloitte Center for Financial Services.”
- Demers, Elizabeth, Jurian Hendrikse, Philip Joos, and Baruch Lev. 2021. “ESG did not Immunize Stocks During the COVID-19 Crisis, but Investments in Intangible Assets did.” Journal of Business Finance & Accounting 48 (3–4): 433–62. https://doi.org/10.1111/jbfa.12523.
- ECIU. 2021. “Net Zero – The Scorecard.”
- Ekwere, Nsikan. 2016. “Framework of Effective Risk Management in Small and Medium Enterprises (SMESs): A Literature Review.” Bina Ekonomi 20 (1): 23–46. https://doi.org/10.26593/be.v20i1.1894.23-46.
- Etkin, David, and Elise Ho. 2007. “Climate Change: Perceptions and Discourses of Risk.” Journal of Risk Research 10 (5): 623–41. https://doi.org/10.1080/13669870701281462.
- Fankhauser, Sam, Stephen M Smith, Myles Allen, Kaya Axelsson, Thomas Hale, Cameron Hepburn, K. J. Kendall, et al. 2022. “The Meaning of Net Zero and How to Get It Right.” Nature Climate Change 12 (1): 15–21. https://doi.org/10.1038/s41558-021-01245-w.
- Forbes, and Georg Kell. 2020. “Covid-19 Is Accelerating ESG Investing And Corporate Sustainability Practices.” Https://Www.Forbes:Com./Sites/Georgkell/2020/05/19/Covid-19-Is-Accelerating-Esg-Investing-and-Corporate-Sustainability-Practices/?Sh=4c27b9bf26bb.2020.
- Friede, Gunnar, Timo Busch, and Alexander Bassen. 2015. “ESG and Financial Performance: Aggregated Evidence from More Than 2000 Empirical Studies.” Journal of Sustainable Finance & Investment 5 (4): 210–33. https://doi.org/10.1080/20430795.2015.1118917.
- Global Sustainable Investment Alliance. 2020. “Global Sustainable Investment Review 2020.” http://www.gsi-alliance.org/wp-content/uploads/2021/08/GSIR-20201.pdf.
- Gov.uk. 2021. “UK Enshrines New Target in Law to Slash Emissions by 78% by 2035 – GOV.UK.” https://www.gov.uk/government/news/uk-enshrines-new-target-in-law-to-slash-emissions-by-78-by-2035.
- Gözlügöl, A. Alperen. 2021a. “The Clash of ‘E’ and ‘S’ of Esg: Just Transition on The Path to Net Zero and the Implications for Sustainable Corporate Governance And Finance.” SAFE Working Paper, 325. https://doi.org/10.2139/ssrn.3962238.
- Gözlügöl, A. Alperen. 2021b. “The Clash of ‘E’ and ‘S’ of Esg: Just Transition on The Path to Net Zero and The Implications for Sustainable Corporate Governance and Finance.” SAFE Working Paper No. 325. Frankurt. https://papers.ssrn.com/sol3/papers.cfm?abstract_id=3962238.
- In, Soh Young, Ki Young Park, and Ashby Monk. 2019. “Is ‘Being Green’ Rewarded in the Market? An Empirical Investigation of Decarbonization and Stock Returns.” Ssrn 1–57. https://www.iaee.org/en/Publications/newsletterdl.aspx?id=432%0Ahttps://ssrn.com/abstract=3020304Electroniccopyavailableat:https://ssrn.com/abstract=3020304.
- Kell, Georg. 2018. “The Remarkable Rise of ESG.” https://www.forbes.com/sites/georgkell/2018/07/11/the-remarkable-rise-of-esg/?sh=7176cdaa1695.
- Kell, Georg. 2020. “Covid-19 Is Accelerating ESG Investing And Corporate Sustainability Practices,” 3–8.
- Kim, Kwang-Ho, MinChung Kim, and Cuili Qian. 2018. “Effects of Corporate Social Responsibility on Corporate Financial Performance: A Competitive-Action Perspective.” Journal of Management 44: 1097–1118. https://doi.org/10.1177/0149206315602530.
- Lobe, Sebastian, and Christian Walkshäusl. 2014. “Responsible Investment in Germany, Austria, and Switzerland.” Problems and Perspectives in Management 12 (1): 209–17.
- Mol, Arthur P J, and Peter Oosterveer. 2015. “Certification of Markets, Markets of Certificates: Tracing Sustainability in Global Agro-Food Value Chains.” 7: 12258–78. https://doi.org/10.3390/su70912258.
- Monciardini, David, Jukka Tapio Mähönen, and Georgina Tsagas. 2020. “Rethinking Non-Financial Reporting: A Blueprint for Structural Regulatory Changes.” Accounting, Economics and Law: A Convivium 10 (2): 14–35. https://doi.org/10.1515/AEL-2020-0092/MACHINEREADABLECITATION/RIS.
- Morningstar. 2021. “Lyxor Net Zero 2050 S&P Eurozone Climate PAB (DR) UCITS ETF – Acc.” https://www.morningstar.co.uk/uk/etf/snapshot/snapshot.aspx?id=0P0001KAIC&tab=14&DocumentId=fc248deca5cb969e10d12c6c188529ff&Format=PDF. 2021. https://www.morningstar.co.uk/uk/etf/snapshot/snapshot.aspx?id=0P0001KAIC&tab=14&DocumentId=fc248deca5cb969e10d12c6c188529ff&Format=PDF.
- Morton, Adam. 2021. “What New Zealand Is Really Doing on Climate – and the Issues with Carving out Farming from Net Zero Emissions.” The Guardian. 2021. https://www.theguardian.com/environment/2021/feb/09/what-is-new-zealand-doing-to-reach-net-zero-what-would-happen-if-australia-did-the-same.
- Murphy, Daniel, and Dianne McGrath. 2013. “ESG Reporting – Class Actions, Deterrence, and Avoidance.” Sustainability Accounting, Management and Policy Journal 4 (2): 216–35. https://doi.org/10.1108/SAMPJ-Apr-2012-0016.
- Murray, James. 2020. “Which Countries Have a Legally-Binding Net-Zero Emissions Target?” https://www.nsenergybusiness.com/news/countries-net-zero-emissions/.
- NGFS. 2019. “A Call for Action: Climate Change as a Source of Financial Risk.” NGFS Report, no. April: 1–40. https://www.ngfs.net/en/first-comprehensive-report-call-action.
- Nirino, Niccolò, Gabriele Santoro, Nicola Miglietta, and Roberto Quaglia. 2021. “Corporate Controversies and Company’s Financial Performance: Exploring the Moderating Role of ESG Practices.” Technological Forecasting and Social Change 162: 120341. https://doi.org/10.1016/j.techfore.2020.120341.
- Omura, Akihiro, Eduardo Roca, and Miwa Nakai. 2021. “Does Responsible Investing Pay During Economic Downturns: Evidence from the COVID-19 Pandemic.” Finance Research Letters 42: 101914. https://doi.org/10.1016/j.frl.2020.101914.
- Pielke, Roger A. 2004. “What Is Climate Change?” Energy & Environment 15 (3): 515–20. https://doi.org/10.1260/0958305041494576.
- Principles for Responsible Investments. 2022. “PRI 2021-24 Strategy.” PRI 2021-24 Strategy.
- Przychodzen, Justyna, Fernando Gómez-Bezares, Wojciech Przychodzen, and Mikel Larreina. 2016. “ESG Issues among Fund Managers—Factors and Motives.” Sustainability (Switzerland) 8 (10): 1078. https://doi.org/10.3390/su8101078.
- Raimo, Nicola, Alessandra Caragnano, Marianna Zito, Filippo Vitolla, and Massimo Mariani. 2021. “Extending the Benefits of ESG Disclosure: The Effect on the Cost of Debt Financing.” Corporate Social Responsibility and Environmental Management 28 (4): 1412–21. https://doi.org/10.1002/csr.2134.
- Refinitiv. 2021. “Comparative Sector Analysis.”
- Rizal Razali, Ahmad, and Izah Mohd Tahir. 2011. “Review of the Literature on Enterprise Risk Management.” Business Management Dynamics. https://doi.org/10.1177/034003529402000408.
- Santos, Rafael M., and Reza Bakhshoodeh. 2021. “Climate Change/Global Warming/Climate Emergency Versus General Climate Research: Comparative Bibliometric Trends of Publications.” Heliyon 7 (11): e08219. https://doi.org/10.1016/j.heliyon.2021.e08219.
- Scarlat, Nicolae, and Jean-Franc -Ois Dallemand. 2011. “Recent Developments of Biofuels/Bioenergy Sustainability Certification: A Global Overview.” Energy Policy 39 (3): 1630–1646. https://doi.org/10.1016/j.enpol.2010.12.039.
- See Tho, Alexis. 2020. “SASB and IIRC to Merge to Simplify Corporate, Sustainability Reporting – FM.” https://www.fm-magazine.com/news/2020/nov/sasb-iirc-merging-to-simplify-corporate-sustainability-reporting.html.
- Singh, Amanjot. 2020. “COVID-19 and Safer Investment Bets.” Finance Research Letters 36 (October): 101729. https://doi.org/10.1016/j.frl.2020.101729.
- Singh, Sanjay Kumar, Manlio Del Giudice, Roberto Chierici, and Domenico Graziano. 2020. “Green Innovation and Environmental Performance: The Role of Green Transformational Leadership and Green Human Resource Management.” Technological Forecasting and Social Change 150: 119762. https://doi.org/10.1016/j.techfore.2019.119762.
- Smartsheet Contributor Andy Marker. 2021. “Enterprise Risk Management Frameworks and Models.” Smartsheet. https://www.smartsheet.com/content/enterprise-risk-management-framework-model.
- S. Sukharev, Oleg. 2020. “Economic Crisis as a Consequence COVID-19 Virus Attack: Risk and Damage Assessment.” Quantitative Finance and Economics 4 (2): 274–293. https://doi.org/10.3934/QFE.2020013.
- Stoian, Mirela Madalina, and Rares Gabriel Stoian. 2018. “Financial Risk Management: An Introduction.” Global Business Expansion: Concepts, Methodologies, Tools, and Appl 43 (June): 97–108. https://doi.org/10.4018/978-1-5225-5481-3.ch007.
- Swedish Environmental Protection Agency. 2017. “Sweden’s Climate Act and Climate Policy Framework – Swedish Environmental Protection Agency.”
- United Nations. 2016. “The Paris Agreement: Frequently Asked Questions – United Nations Sustainable Development.” https://www.un.org/sustainabledevelopment/blog/2016/09/the-paris-agreement-faqs/.
- Whelan, Tensie, Casey Clark, and Ulrich Atz. 2021. “ESG AND FINANCIAL PERFORMANCE: Uncovering the Relationship by Aggregating Evidence from 1,000 Plus Studies Published between 2015–2020.” https://www.stern.nyu.edu/sites/default/files/assets/documents/NYU-RAM_ESG-Paper_2021.pdf.
- Whitman, Andrew F. 2015. “Is ERM Legally Required? Yes for Financial and Governmental Institutions, No for Private Enterprises.” Risk Management and Insurance Review 18 (2): 161–97. https://doi.org/10.1111/rmir.12045.
- Wong, Woei Chyuan, Jonathan A. Batten, Abd Halim Ahmad, Shamsul Bahrain Mohamed-Arshad, Sabariah Nordin, and Azira Abdul Adzis. 2021. “Does ESG Certification Add Firm Value?” Finance Research Letters 39 (March): 101593. https://doi.org/10.1016/j.frl.2020.101593.
- Yoshino, Naoyuki, Farhad Taghizadeh-Hesary, and Miyu Otsuka. 2021. “Covid-19 and Optimal Portfolio Selection for Investment in Sustainable Development Goals.” Finance Research Letters 38 (January): 101695. https://doi.org/10.1016/j.frl.2020.101695.
- Zhou, Bing, Jing Wu, Sidai Guo, Mingxia Hu, and Jing Wang. 2020. “Environmental Regulation and Financial Performance of Chinese Listed Companies.” PLoS ONE 15: e0244083. https://doi.org/10.1371/journal.pone.0244083.