
 ?Mathematical formulae have been encoded as MathML and are displayed in this HTML version using MathJax in order to improve their display. Uncheck the box to turn MathJax off. This feature requires Javascript. Click on a formula to zoom.
ABSTRACT
To allocate capital to its most sustainable use, market participants need information on companies' sustainability plans and initiatives. This information is disclosed in sustainability reports, but the disclosure process is largely unregulated and voluntary. When do sustainability reports convey relevant information? To answer this question we estimate the heterogeneous effects of nonfinancial disclosure on analysts' estimates of earnings and firms' equity values. We have found that the information content of nonfinancial disclosure is larger when firms are subject to greater information asymmetry, and when nonfinancial information is integrated within a financial context. Moreover, positive responses have a long-lasting impact while negative shocks are corrected within a short window. Overall, our work suggests that market participants' interest in standalone nonfinancial information is limited, and integrated reporting increases the value of sustainability reports.
1. Introduction
The pressing need for a transition to a sustainable economy is currently driving a large amount of capital towards funds and corporations that claim to allocate it to sustainable projects and initiatives (Schoenmaker and Schramade Citation2019; Boffo and Patalano Citation2020; Christensen, Hail, and Leuz Citation2021). This structural shift of capital markets from being a purely profit maximization instrument into a value creation system is key to address the main challenges of our era, from climate change (Tol Citation2009; Nordhaus Citation2017; Stan, Watt, and Sanchez-Azofeifa Citation2021) to structural social inequalities (Greenwald, Lettau, and Ludvigson Citation2019). In order to allocate capital to its best use, it is crucial that market participants have access to transparent information on both financial and nonfinancial activities and performance of public corporations.
Information about firms' financial information is released in quarterly and yearly financial statements, and it is well known that publication of financial data is an important process to transfer information from insiders (e.g. management) to outsiders (e.g. market participants and other stakeholders). Information transfer lower information asymmetry (Verrecchia Citation1982; Diamond Citation1985; Barron, Byard, and Kim Citation2002) which in turn affects important aspects of a corporation from its cost of capital (Akins, Ng, and Verdi Citation2012; Armstrong et al. Citation2011) to its financing choices and capital structure decisions (Myers Citation1984). While the importance of financial information disclosure for market participants is well established, the role of nonfinancial disclosure in the information transfer process is less well understood (Cho, Lee, and Pfeiffer Citation2013; Christensen, Hail, and Leuz Citation2021). Yet, to properly allocate capital to its most sustainable use, it is crucial that markets' participants properly process information on the nonfinancial activities of a corporation.
Publicly traded firms can disclose nonfinancial information in annual sustainability reports. While the publication of these reports is a largely voluntary and unregulated process, the number of firms that issue some form of sustainability information has increased dramatically in the past few years, reaching 96% of the world's largest 250 companies and 80% of the N100 companies in 2020 (GRI, and SASB Citation2021). However, given the lack of systematic regulations in reporting standards and the discretion on the format and content of the information released in sustainability reports, a central question is to what extent and under what conditions sustainability reporting convey relevant information. In this context, in order to assess if, analogously to financial statements, the disclosure of nonfinancial information transfers relevant information to markets and its participants, a number of empirical works have looked at the average effect of corporate social responsibility (CSR) reporting on analysts' estimates of earnings (Pflugrath, Roebuck, and Simnett Citation2011; D.S. Dhaliwal et al. Citation2012; Becchetti, Ciciretti, and Giovannelli Citation2013; Hope, Hu, and Lu Citation2016), firms' market values (Cormier and Magnan Citation2007; Cheung Citation2011; Du et al. Citation2017; Du and Yu Citation2021), and cost of capital (Luo and Bhattacharya Citation2009; El Ghoul et al. Citation2011; D. Dhaliwal et al. Citation2014; Chava Citation2014).
In the following, we will review the main findings from the literature and propose a new approach to address important gaps. Broadly speaking, we are going to argue that two important limitations of previous works are a narrow focus on small samples and on average population effects. Specifically, we show that the effect of CSR disclosure is highly heterogeneous in both significance and sign, and these heterogeneities depend on important firms' characteristics. In particular, on the information asymmetry between insiders and outsiders. Overall, our work provides new insights on the role of sustainability reporting in market dynamics.
1.1. Related literature
Two of the most important recipients of sustainability reports are financial analysts and investors (Christensen, Hail, and Leuz Citation2021). Analysts are important actors in market dynamics. They are intermediaries that transform the information contained in financial reports into actionable and complementary information for investors (Barron, Byard, and Kim Citation2002; Zadeh et al. Citation2021). While it is well established that analysts are good processors of financial information, their role in processing nonfinancial information is still not well understood. In this context, a number of works have looked at the relation between CSR reporting and analyst reactions. Aerts, Cormier, and Magnan (Citation2008), D.S. Dhaliwal et al. (Citation2011), D.S. Dhaliwal et al. (Citation2012) and Cormier and Magnan (Citation2015) have found a negative association between CSR disclosure and analysts' forecasting error, i.e. analysts tend to assess better the value of firms that disclose nonfinancial information through standalone sustainability reports. Moreover, other works have found that the capacity of analysts to assess firms' risk is positively correlated with the specificity of the disclosure (Hope, Hu, and Lu Citation2016). Similarly, analysts appear to put more weight on firms that issue CSR reports assured by an external accounting firm (Pflugrath, Roebuck, and Simnett Citation2011).
To assess the impact of the publication of sustainability report on investors, previous studies have looked at the effect of disclosure on realized stock returns. However, as argued by Christensen, Hail, and Leuz (Citation2021), most studies in the literature focus on markets' reaction to information about CSR activities and exposure, rather than the disclosure itself. One of the few studies that look at the effect of disclosure on stock returns is Du et al. (Citation2017). In their work, the authors performed an event study on cumulative abnormal returns around the publication period and have found a statistically significant short-term market reaction. Moreover, they have found that the effect is smaller when the information contained in the CSR reports is released through other channels before publication. Other studies (Du and Yu Citation2021) have looked at the relation between a number of characteristics of the reports (e.g. readability and tone) and have found that clarity in the language is positively associated with markets' responses to publications. Both studies focused on a small sample of US firms.
Other works have looked at the impact of CSR reporting on investors via the effect of CSR disclosure on cost of capital. Broadly speaking, the cost of capital is the market expected return of a firm, i.e. the discount rate that markets apply to its expected cash flow. In imperfect equity markets information asymmetry increases the cost of capital (Armstrong et al. Citation2011; Hail and Leuz Citation2006; Easley, Hvidkjaer, and O'Hara Citation2002). Therefore, it is expected that any event that lowers the former (e.g. information disclosure) should also impact the latter. In this context, we expect that if there is any information transfer from CSR reports to markets, there should also be a measurable effect on cost of capital. Similarly to the analysis of stock returns, most works focused on the effect of CSR activities on cost of capital (Christensen, Hail, and Leuz Citation2021). Studies that focused on reporting have found mixed evidence: some works have found a negative relation (Plumlee et al. Citation2015; Matsumura, Prakash, and Vera-Munoz Citation2017) while other have found positive (Richardson and Welker Citation2001) or no effects between the two (Clarkson et al. Citation2013).
1.2. Hypotheses development
Overall, existing evidence suggests that CSR reporting transfers relevant information to markets and their participants. These findings are well summarized by Christensen, Hail, and Leuz (Citation2021) in a recent extensive review of sustainability reporting. However, conclusions from previous works are, except for a few studies (such as D. Dhaliwal et al. Citation2014), drawn from relatively small samples, and are mainly conclusions about average effects estimated through regression approaches.
These two limitations have important consequences for the generalizability of the findings. Specifically, focusing on small samples might bias the importance of the events through sample selection issues. For example, conclusions from samples made of large US firms (as in several previous studies (Clarkson et al. Citation2013; Plumlee et al. Citation2015; Krüger Citation2015; Du et al. Citation2017; Du and Yu Citation2021)), can be biased by the stakeholders' pressure and scrutiny faced by these firms, which are less prevalent in smaller international firms (Seroka-Stolka and Fijorek Citation2020). Using regression approaches instead is problematic for two reasons. First, despite it is well known that regression coefficients are unbiased estimates of causal effects only under very stringent assumptions (Pearl Citation1995; Gow, Larcker, and Reiss Citation2016; Pearl, Glymour, and Jewell Citation2016; Cenci and Kealhofer Citation2022), these assumptions are rarely tested ex-ante on data. Therefore the causal interpretation of regression coefficients is often difficult to justify (Gow, Larcker, and Reiss Citation2016). Second, and most importantly, because regression coefficients measure average effects, they might mask important heterogeneities, such as for example the incidence of statistically significant effects and the relative importance of positive versus negative effects.
In light of these limitations, to better understand the effect of nonfinancial disclosure on markets and their participants, at the global level, the goal of this paper is to estimate a firm-level -- heterogeneous - effect of sustainability reporting on analysts revision of earnings, firms' equity value and cost of capital. Notably, this approach is in stark contrast with the existing literature that focuses on population effects (Christensen, Hail, and Leuz Citation2021). To estimate heterogeneous effects we developed a non-parametric and non-regression based approach which is tested against a number of null models. Moreover, differently from previous studies, which are often limited in sample size and geographical distribution, here we focus on a large sample of firms (), countries (41) and events (
. The events include publications of CSR and integrated reports as well as other nonfinancial communications to stakeholders (see Section 2).
The implicit hypotheses we are going to test in this paper are the following:
| (1) | There is a significant heterogeneity in markets' reactions to the disclosure of nonfinancial information and, | ||||
| (2) | Information asymmetry between insiders and outsiders is an important factor in determining whether or not the disclosure of nonfinancial information conveys relevant information to markets and their participants. | ||||
Our first hypothesis is motivated by several reasons. Firstly, it is well known that CSR issues are not equivalently material for all firms (Eccles and Serafeim Citation2013; Nardi et al. Citation2021). For example, firms exposed to higher environmental risks, such as firms in the oil and gas industry, require different managerial strategies to protect their earnings from changes in regulatory frameworks and other stakeholder pressures compared to firms in low-emitting sectors (Ahman Citation2020; Yuen et al. Citation2023). Therefore, we expect that analysts respond differently to the information released by companies in these sectors, since their nonfinancial practices are directly related to their financial risks. Secondly, we do not expect these differences to exist only across sectors, but also within the same sector across different firms and more importantly, within the same firms across time. For example, firms that venture into new products might take on new risk that is directly related to their CSR exposure and therefore analysts might value this risk differently based on the information released in CSR reports (Ioannou and Serafeim Citation2015; Liu, Ju, and Gao Citation2021). All these sectors, firms and time differences can be captured by regression approaches, by for example, carefully controlling for sectors and countries differences, but only to the extent that they change the value of the average coefficients. Yet, these average values can mask important heterogeneities. In other words, rather than asking the question as to whether or not the disclosure of nonfinancial information is relevant to markets' participants and estimating an average sign, here we introduce an approach to identify when this information is relevant and how the sign of the reaction is distributed across our sample.
After identifying the heterogeneities of markets' reactions to the disclosure of nonfinancial information, we investigate what type of firms characteristics are, on average, associated with significant responses. Our main hypothesis is that significant markets' reactions are driven by the (time-varying) level of information asymmetry, i.e. the higher the information asymmetry the higher the likelihood that markets' participants react to the disclosure of CSR information. The hypothesis is directly related to several studies that have investigated the role of information asymmetry in market reactions to CSR disclosure (Healy and Palepu Citation2001; Muslu et al. Citation2019; Hinze and Sump Citation2019; Zadeh et al. Citation2021; Rossignoli, Stacchezzini, and Lai Citation2022). Generally, we expect that likelihood of market reactions (e.g. analysts' revision of earnings) to CSR disclosure and information asymmetry are positively correlated for two main reasons. First, several studies have shown that CSR disclosure can partially substitute financial disclosure (Zadeh et al. Citation2021) and it is well known that the effect of financial disclosure on markets is higher for high information asymmetry firms (Diamond Citation1985; Barron, Byard, and Kim Citation2002). Second, we expect market reactions to be greater when baseline information is more opaque (i.e. surprises are greater when priors are less well defined), which is the case when information asymmetry is higher (Fink Citation2021).
1.3. Contribution and the organizational structure of the paper
Overall, our study contributes to the stream of CSR literature that analyses the impact of sustainability reporting on markets and their participants (Christensen, Hail, and Leuz Citation2021). In particular, it extends the investigation of several previous studies to include a more in depth, large scale and non-parametric analysis of the heterogeneity of markets' reactions to the disclosure of nonfinancial information. In this context, the main contributions of this work are to (1) provide evidence in support to the hypothesis that, while at the population level sustainability reports have a positive and statistically significant effect on markets, at the firm-level, we observe a significant variation, which include insignificant and also negative effects; and (2) to show that information asymmetry and integrated reporting are the main factors that determine markets' reactions to disclosure of nonfinancial information at a global scale.
In our analysis, we looked at the effect of nonfinancial disclosure on financial analysts' estimates of earnings, realized market value of equity and cost of capital. Looking at analysts' reactions to CSR publications, we have found that the effects are statistically significant only for of the firms in our sample. Moreover, while the average effect is positive, we observe a significant number of negative, and statistically significant reactions. In line with our hypothesis, analysts' reactions to the publication of sustainability reports are larger for companies subject to greater information asymmetry, i.e. for companies where insiders have a markedly superior information than outsiders. Similarly, analysts value nonfinancial information more when integrated with information about financial strategies and performance, as reported in integrated reports. We did not put forward any hypothesis concerning the role of integrated reporting, but our results are robust, economically significant and extend to a global scale previous findings that focus on countries with mandatory integrated reporting (Barth et al. Citation2017; Caglio, Melloni, and Perego Citation2020).
Focusing on the effect of disclosure on markets' value of equity, we have found that the negative effects are relative short lived while positive effects are larger and long-lasting. This result complement previous population level findings that documented average positive effects (Du et al. Citation2017). Moreover, effects on equity value are larger (in absolute value) after the disclosure of integrated reports. Finally, we have found no evidence in support to the hypothesis that the disclosure of nonfinancial information has a measurable effect on firms' cost of capital. This result is robust to different measures of cost of capital.
We now turn to present our methods and results in further detail, and we leave a more in-depth discussion of the findings to the final section of the paper. The paper is organized as follows: in Section 2, we present our dataset with a focus on its geographical, sectorial, and temporal composition. In Section 3, we present our approach to estimate the heterogeneous effect of sustainability reporting and to test our hypothesis. In Section 4, we present our results. Finally, in Sections 5 and 6, we discuss our findings and their implications.
2. Data
Our dataset includes a global sample of publicly listed firms for which we could collect data on CSR publications in the form of either standalone CSR reports, integrated reports, annual reports with nonfinancial sectionsFootnote1 or other form of communication of nonfinancial information to stakeholders. Examples of these communications include sustainability statements, health and safety statements and community-related activities. Communications on websites are included only if they are updated annually. We download the CSR publication dataset from REFINITIV (data item TR.CSRReporting) and we only include firms with at least three years of observations. The REFINITIV dataset also includes information on the reports themselves. In particular, if the reports have an external auditor, if they follow GRI guidelines, and if they include information on global or local activities. The reports are also associated with a title. The titles do not follow a specific format, so we classify a report as to be an integrated report if the words: annual report, integrated reports, annual financial or 10-K are in the title. Otherwise, the report is a standalone report. Some of the standalone reports are minor communications, but we did not exclude these documents because the Refinitiv screening is organized so that minor communications are included if and only if they are the only available sustainability reports for the firm. Overall, we have a sample of 4565 firms and 29, 823 events (i.e. disclosure of nonfinancial information) from 2009 to 2020.
For each firm in the CSR issuance dataset, we download analysts estimates of earnings from the Institutional Brokers' Estimate System (I/B/E/S) through the REFINITIV API. Specifically, we focus on mean estimated Earning Before Interests, Tax, Depreciation and Amortization (EBITDA) and Earnings Per Share (EPS) (data items TR.EBITDAMean, TR.EPSMean). The I/B/E/S dataset also includes the dates of companies' announcements of earnings. Additionally to information on financial and nonfinancial disclosure and analysts' revision of earnings, we download data on offering announcements dates and M&A announcements dates from S&P Capital IQ as well as data on ESG rating announcements dates from MSCI. From the full sample, we remove data from 2020 because during the COVID-19 crisis, there might have been many unobserved events that drove analysts estimates of earnings around the time of disclosure of nonfinancial information (particularly news and social media communications which we do not include in our dataset). However, we will use data from 2020 in one of our robustness tests. Finally, we remove observations with an event date prior to the end of the fiscal year reported in the report. This is a small sample of observations (). To match firms in the different datasets we use ISIN numbers. When ISIN numbers are not available for a perfect match, we match by company name after removing special characters and punctuations. After merging the REFINITIV, I/B/E/S, S&P, and MSCI datasets we are left with 4305 firms and 21903 CSR events. The total number of firms and events drop to 3073 and 16879, respectively, when we account for missing or not enough data around some of the events and overlapping windows with other announcements.
A summary view of the data is shown in Table . The table shows a summary statistics of the event dataset by sectors, regions, and year of announcement. Table S1 shows the composition by country. Notice that the number of announcements and nonfinancial disclosures is not necessarily representative of sectors and regions' true distributions. For example, we have a large number of nonfinancial disclosures in the Industrial sector. The number is significantly larger than the number of disclosure in, for example, Consumer Staple. However, this difference might be due simply to a sector bias in the REFINITIV dataset, not to a true difference in the behavior of the firms in the two sectors. On the other hand, the trend in the number of nonfinancial disclosure per year is representative of the true distribution, i.e. the number of firms that disclose nonfinancial information has grown significantly (more than doubled) during the sample period. Notice as well that the total number of events in the dataset is significantly larger than the one shown in the table. We only focus on this subset of events because it is the overlap of all financial and nonfinancial announcements. Table shows a summary statistics of the characteristics of the CSR reports including the proportion of integrated reports, the fraction of reports that went through an external audit, the fraction of reports that follow GRI guidelines and report on global (as opposed to regional) CSR activities. Table S2 shows the composition by country. Notice that information on External audit, GRI guidelines and Global activities are available only for approximatively 30% of the observations in our sample. Therefore, the proportions of these three variables refer to a subset of the full sample.
Table 1. Number of announcements.
Table 2. Statistics of the nonfinancial disclosure.
Additionally to events data, we also download cost of capital and equity data from REFINITIV (data items TR.WACC, TR.ClosePrice), and accounting data from COMPUSTAT. Emission data are from TruCost. Specifically, here we use emissions under direct control of management, which in TruCost are defined as GHG protocol scope 1 emissions, plus any other emissions derived from a wider range of GHGs relevant to a company's operations, plus GHG protocol scope 2 emissions, plus the company's first-tier upstream supply chain. This is the TruCost's default measure of emissions (see https://www.spglobal.com/spdji/en/documents/additional-material/faq-trucost.pdf).
Finally, we use weekly equity data from REFINITIV to estimate firms' idiosyncratic volatilities.Footnote2 The estimation process is the following: firstly, we group firms in macro regions following the S&P Capital IQ region classification. Then, for each macro region, we run a weekly cross-sectional regression of equity returns on sector dummiesFootnote3 with an intercept:
(1)
(1) where
is 1 if firm i is in sector s and zero otherwise. From Equation (Equation1
(1)
(1) ) we obtain an estimate for sectors' factors (
) and an estimate of the (regional) market return (
). Then, we run a time-series regression of the weekly returns on the market and sectors' factors on a rolling basis with a 104 weeks (two years) window. The idiosyncratic volatility is the standard deviation of the residual of the time-series regression, i.e.
:
(2)
(2) The summary statistics of the variables used in the following analyses are shown in Table .
Table 3. Summary statistics of the sample.
3. Empirical approach
In this section, we present our approach to estimate the effect of the disclosure of nonfinancial information on analysts' revisions of earnings, stock returns and cost of capital.
3.1. Revisions of earnings
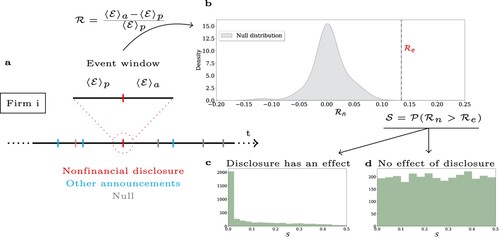
To identify heterogeneities in markets' reactions to the disclosure of nonfinancial information (our first hypothesis), we develop a non-parametric event study approach to estimate the impact of nonfinancial disclosure on analysts' revisions of earnings. Later in this section, we apply the same approach to changes in cost of capital. Figure shows a schematic summary of our proposed approach which is set up to mitigate endogeneity issues in the estimation of the effect of CSR disclosures. The analysis is organized as follow: for each firm, we loop over the dates of nonfinancial disclosures. If in a 30 days window around the disclosure date (15 days prior and 15 days after) there is either a earning announcements, a M&A announcements, an offering announcements or the publication of ESG rating, then we ignore the date. Otherwise, we compute the average value of the earnings estimates in the 15 days prior () and after (
) the event. Our statistics is the average change in revision during the 30 days event window:
(3)
(3) where the subscript e stands for the statistics evaluated in the event window (see Figure (a)). The statistics itself is not informative about the impact of the event because the average revision per analyst changes significantly from firm to firm. However, we cannot compare
with an average revision per firm, because the distribution of the revision is strongly influenced by significant events. Therefore, to assess if the revision is significantly different from the typical reassessment of earnings, we create a null model as follows. Firstly, we sample random dates in the observation period of the firm. These dates are sampled so to not overlap with any other event (including in this step the publication of CSR reports). Secondly, we compute a null distribution of our statistics
. Thirdly, we estimate the frequency of the dates in the null model with a revision greater than the revision in the event of interest:
if
and
otherwise (see Figure (b)). Finally, we repeat the process for every firm in our sample and estimate the distribution of
. If the distribution is uniform (see Figure (d)), there is no effect in the population (as an extreme event is as likely in the event distribution as in the null). If the distribution deviate from uniformity instead ( see Figure (c)), the effect exists and it is concentrated in those firms with
smaller than a given threshold, which we fix to 0.1. Small changes in this choice do not change significantly the results of the analysis. To distinguish between uniform and non uniform distributions we use a
test, i.e. if the p-value of the test
then the distribution of
is not uniform and the data support the hypothesis that an effect exists in the sample. Figure S1 in the Supplementary Information shows an example of the null distribution of
and the value of
for two firms in our population.
Figure 1. Overview of the study design. The figure shows the basic structure of our study design. For each firm i and nonfinancial disclosure (red in (a)) that does not overlap with other announcements (cyan in (a)) we compute the average change in analysts' forecast of earnings prior and after the event during a 30 days event window (). We then compute the same statistics over dates with no significant event (gray) and we create a null distribution (gray in (b)). Then, we compute the probability that the changes in earnings' forecasts in the null model were greater than changes occurred in the event (
). Finally, we plot the distribution of this statistics over the whole population. (c,d) show two hypothetical shapes of this distribution. We conclude that an effect exists in the population if the distribution of this statistics is not uniform, as shown in (c).
Notice that we have claimed that the results of our test have a causal interpretation. Indeed, our test is equivalent to a conditional independence test which tests whether a change in analysts' revision () is conditional independent on the event (
, i.e. disclosure of nonfinancial information) conditioned on all the other (observed) events,
. In practice, the time of the event is our proxy for potential confounder
. Under this interpretation
causes
⇔
. This is a standard definition of causality (Zhang et al. Citation2011; Pearl, Glymour, and Jewell Citation2016; Peters, Janzing, and Schölkopf Citation2017). In practice, when testing for conditional independencies over multiple realisations of the same process, if the variables in the samples are conditionally independent, then the distribution of p-values of the independence tests will be uniform (we are as likely to observe a small p-value as we are to observe a large one). Otherwise, the distribution will deviate from uniformity and it will be skewed towards small p-values (as, if there is an effect, most of the observations will not pass the independence test). In the extreme case where each observation in the sample exhibits an effect then the whole distribution will be around zero. This is the same setting shown in Figure (c, d). In our case, we do not expect that each disclosure has an effect on the revisions, but if the effect exists over the population we expect the distribution of
to not be uniform.
Overall, the process described above provides us with a methodology to isolate from our population the firms for which the disclosure of nonfinancial information tends to have, on average, an impact on earnings' estimates. We call this population, if it exists, the effect population and the rest of the population the no effect population. Similarly, we repeat the same process on the single observations. That is, we estimate the event-specific effect by calculating the frequency of extreme revisions under the null and compare it not with but with
. With this process we can separate the effect events from the no effect events. Notice again that this classification is only valid if the distribution of
is not uniform
An important underlying assumption of our approach is that we observe all the relevant events of the firms around the disclosure date so that any change in the statistics during the event window is caused by the event. In other word, we assume that we observe the full conditioning set . Notice, however, that the method is still valid if the unobserved events are linked to the publication of the reports (if for example a company advertise the event on social media, or the reports is picked up by the news). This is an important limitation of the methodology but (1) it is not different from assuming no missing-variables in a regression approach and (2) we have controlled for the most important events affecting the predicted earnings of a corporations, so we expect that other events, even if they overlap with our windows, do not play a significant role. To further show the validity of point (2) we run an additional analysis where we also condition on dates around large equity shocks, which are events that can be used as proxy for other, unobserved, events affecting the firm.
3.1.1. Probit model
To test our second hypothesis, we need to identify the differences in the assets' characteristics of firms-events in the effect and no effect population. To this end we run a Probit model where the dependent variable, e in Equation (Equation4(4)
(4) ), is one if firm i belongs to the effect population in year t and zero otherwise:
(4)
(4) where
is a vector of control variables which include: Size (log of sales in USD adjusted for inflation), Tangibility (Property plant and equipment, PPE, scaled by total book asset, AT), investment intensity (Total invested capital over revenue, SALE), and Profitability (Earnings before interests, taxes, depreciation, and amortization, EBITDA, scaled by previous period book asset). We also control for the ESG ratings in each of the three dimensions (environmental, social and governance), for GHG emissions of the firm scaled by total invested capital (Emission intensity) and for the idiosyncratic volatility (calculated as described in Section 2). Table shows a summary statistics of the variables used in Equation (Equation4
(4)
(4) ).
We expect that Size is an important determining factor for the probability of observing a significant effect of nonfinancial disclosure because small firms have fewer channels to communicate with stakeholders, and CSR reports are therefore an important source of information for analysts. Size is also inversely related to information asymmetry since public information is widely more available for large firms than it is for small companies (Harris Citation2015). Tangibility is also an important factor since firms with more tangible assets (e.g. plants and equipment) have more transparent business models and needs than firms whose value is mostly determined by intangibles (e.g. patents). Therefore, we expect that analysts need greater disclosure from the latter to correctly estimate earnings. We control for Profitability because we expect that analysts pay more attention to less profitable firms since their earnings are at greater risks. Similarly, we expect that investment intensity is positively associated with the probability of observing a significant event since estimates of earnings require more information when investment is large (compared to total revenue).
In our analysis, we will be particularly interested in the sign of these four factors because, together, they can be used as proxy for the level of information asymmetry between insiders and outsiders. Indeed, large, profitable firms with a high proportion of tangible assets and small investments tend to have a lower level of information asymmetry due to stakeholders' pressure and scrutiny (Seroka-Stolka and Fijorek Citation2020), stability of the value of property, plants and equipment, and lower earnings at risk. To further determine the relationship between information asymmetry and the probability of a significant revision, we control for idiosyncratic volatility, which is a direct proxy for, and a market-based measure of, information asymmetry (Mitra Citation2016).
ESG scores measure exposure of earnings to ESG risks, and therefore are a crucial component of CSR reports. Hence, we expect to observe a relationship between ESG scores and analysts' reaction to CSR disclosure. Among all the ESG issues, climate changes is the most material for firms in virtually any sector due to the involved physical (e.g. sea level rise, wildfire) and transition (e.g. carbon pricing) risks (Schoenmaker and Schramade Citation2019). Therefore, we expect that analysts play particular attention to firms' environmental impact which we measure here as emission intensity. To isolate narrowly focused disclosures from broader information releases, we control for the breadth of the information disclosed in the reports by controlling for whether or not the disclosure was integrated with financial information, i.e. for a binary variable which is one if a report was an integrated report and zero otherwise ().Footnote4 Finally, because our sample is broad in both sectorial and geographical distributions, we also control for sector and geography fixed effects as well as year fixed effects,
, in Equation (Equation4
(4)
(4) ).Footnote5
The disclosure of nonfinancial information is a voluntary process. Therefore, the disclosing and non-disclosing populations can be systematically different. This difference might induce a self-selection bias in the Probit model (Equation (Equation4(4)
(4) )). To mitigate endogeneity concerns, we estimate the model by first controlling for self-selectivity with the Heckman correction (Heckman Citation1979). Data as to whether a company issues CSR reports are from Refinitiv. In this self-selection step, we control for Size, Total invested capital and the average issuance of nonfinancial information in the sector, which can be seen as a peer pressure variable.
3.1.2. Robustness tests
In our model specification, we made a series of assumptions. Therefore, to guarantee the validity of our results we run a series of robustness tests where we relax each of these assumptions. Specifically, we run eight robustness tests. In the first test, we repeat our estimation without adjusting for self-selectivity. In the second test, we extend our analysis including data from 2020, which we have excluded as discussed in Section 2. In the third,fourth and fifth tests, we use different providers for the ESG ratings. Specifically, to extend coverage in our main specification, we use ESG ratings from multiple data providers, i.e. MSCI, REFINITIV, and S&P Global. That is, for every firm and every year we first search for a ESG rating in the MSCI database, if the data were missing, we looked in the REFINITIV database. If the data was still missing, we searched in the S&P Global database. However, because different data providers use different methodologies and define the scope of the ratings differently (Berg, Kölbel, and Rigobon Citation2022), this mixing could cause biases in the estimation. In these robustness tests, we run the model using MSCI, REFINITIV, and S&P Global data independently.
In the sixth test, we control for country rather than geography fixed effects. This is an important test as, whilst environmental and governance policies tend to be similar in countries within the same geographical region (e.g. Europe), country idiosyncrasies could play a relevant role in the stakeholder pressure on the disclosure of CSR reports. In the seventh report, we control for lag effects. Because some of the control variables (e.g. tangibility) are strongly auto-correlated, lags could induce multicollinearity issues. Therefore, rather than including lags explicitly, we take historical averages of the control variables. That is, we test if the average asset characteristics determine the probability of observing a significant effect of disclosure. Finally, in the last test we repeat our main specification but the effect and no effect populations are now constructed using changes in analysts' forecast of earnings per share (EPS), rather than EBITDA. That is, in this test we take a different proxy for our dependent variable.
3.2. Effect on equity value
To estimate the effect of the disclosure on market value of equity we run a standard event study (Campbell, Lo, and MacKinlay Citation1997). That is, firstly we estimate a market model over a three months period prior to the event, with a gap of 20 days to the event date. We use a simple CAPM to estimate the expected returns, that is, for we estimate:
(5)
(5) Where
is the market-weighted average returns of the firms within our population. Secondly, we compute abnormal returns (AR) over the event window (leaving a five days gap with the estimation window):
(6)
(6) Finally, we aggregate the abnormal returns across securities and we compare the effect of the disclosure after a positive, negative, and no effect revision of earnings at different time horizons. The goal is to assess how markets respond to the analyst reactions to the publication of CSR reports. To assess if the events (publication of CSR reports) have a statistically significant effect on cumulative abnormal returns we assume zero covariance among the securities and we use the following test statistics
, where CAR are the cumulative abnormal returns. We calculate the test statistics for the positive (
), negative (
) and no effect (
) events. The average as well as the standard deviation are estimated across securities during the event window.
3.3. Effects on cost of capital
Finally, we test for the existence of an effect of disclosure of nonfinancial information on the weighted average cost of capital (WACC). WACC data are from Refinitiv but only cover the period 2015-2019, which is a significantly smaller time frame than the one analyzed in the previous two analyses. Importantly, we use a measure of cost of capital that takes into account all form of capital, i.e. common shares, preferred stocks and debt liabilities weighted proportionally to a firm's capital structure. The WACC data are weekly and noisier than equity data. To reduce the impact of outliers, we remove observations that are in the top and bottom centile of the distribution of weekly changes of WACC. We apply this filter by firm, not over the full distribution.
To estimate the impact of nonfinancial disclosure on cost of capital, we run a similar analysis to the revision of earnings. Specifically, we remove all event dates that overlap with the other significant events in our dataset. Then we construct the same statistics as in Equation (Equation3(3)
(3) ) by taking the averages of the WACC in the 15 days before and after the event,
. Finally, we benchmark the effects with a null model constructed from randomly sampling dates with no events.
4. Results
4.1. Effect of nonfinancial disclosure on the revision of earnings
Figure summarizes our main results. Specifically, Figure (a) shows the frequency distribution of extreme events under the null. This is the empirical version of the theoretical distribution shown in Figure (c). As discussed in Section 3, the x-axis can be interpreted as a p-value of a statistical test, as it is the probability of observing a change in analysts revisions in the null distribution that is greater than the average revision after the disclosure of nonfinancial information. The panel supports the findings of the literature: on average we observe an effect of sustainability reporting across the population (p-value of the test ≪ 0.01). However, the panel also shows that this effect is only significant for a fraction of the population. Specifically, we have found that the effect is statistically significant (p-value ¡ 0.1) for
of the firms in our population. This number is consistent after conditioning also on dates around large equity shocks (see Figure S8 in Section A in the Supplementary Information). In the following, we will refer to this population as the effect population. For comparison, if we were looking at the effect of earning announcements on revision of earnings the effect population would have been
of the total population (see Figure S3 in the Supplementary Information). Notice that while there are many more firms in the no effect population, the average number of events per firm is approximately the same in the two populations (effect and no effect, 4.65, 4.74, respectively, and the difference in the mean is not statistically significant). These results are robust to the choice of the pooling window of the analysts' estimates around the event, see Figure S2.
Figure 2. The impact of nonfinancial disclosure on analysts' revisions of earnings. (a) shows the distribution of the statistics as in Figure (c). The panel illustrates that there is a significant effect across the population. In (b–d), we look at the event-specific effects. Specifically, in (b), we show the distribution of the magnitude of the statistically significant and not significant effects, compared to the null model. (c) shows the evolution of the magnitude of the effects in time. Finally, (d) shows the fraction of integrated reports in the population. Overall, the figure shows that analysts revise their earnings' estimates following the disclosure of nonfinancial information. The effect of the revision is concentrated in a small fraction of the population and integrated reporting is associated with a higher likelihood of observing a statistically significant effect.
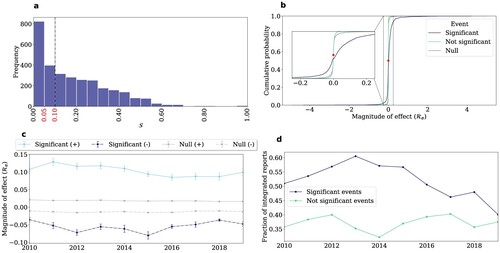
The other three panels in the figure show a number of statistics for the event-specific effects. Panel b shows that when the effect is statistically significant (blue line), it is slightly more likely to be positive (i.e. earnings are forecasted to increase). The average effect across the whole population, including the non-significant effects, is 0.015 and it is statistically significant (the p-value of the one sample t-test is ). As expected the effects that are not statistically significant (green) are no different from the effects in the null distribution (gray). Panel c shows the evolution of the magnitude of the effects (y-axis) in time compared to the evolution of the effects in the null distribution. Interestingly, we have found that the positive effects are consistently larger, in absolute value, than the negative effects with no time effect. Overall panel b and c show that, on average, analysts see the publication of CSR reports as a positive event for a firm.
Importantly, panel d shows that the publication of integrated reports is associated with a larger fraction of statistically significant revisions.Footnote6 The difference between the frequency of integrated reporting in the significant and not significant events observations was notably larger at the beginning of the observation period (2010–2015), and reached a peaked in 2014. Notice that we have excluded from the analysis all the publications that overlap with earning announcements. Therefore financial information was already available to analysts at the time of publication of the reports. We believe that the role of integrated reporting in this context is therefore to provide investors with a holistic view of the financial and nonfinancial activities of a corporation.
We now look back at the firm-level effects and focus on explaining the differences between the effect and no effect populations at the asset level. An important hypothesis in the literature is that whether or not firms' outsiders (e.g. analysts) have detailed knowledge of the operations of a firm is an important factor that determines the impact of nonfinancial disclosure. In other words, analysts should value more information disclosed by firms with greater information asymmetry. To test this hypothesis we look at the idiosyncratic volatility of the firms in the two populations. Figure shows the distribution and the temporal evolution of the idiosyncratic volatility in the two populations (see Section 2 for a discussion of how we estimate the idiosyncratic volatility). Panel a shows the ratio of the idiosyncratic volatility in the effect and no effect population (the error band shows the error of the ratio). The figures shows that for the whole sample period, the effect population has a higher idiosyncratic volatility and this difference is statistically significant. Similarly, panel b shows the temporal evolution of the volatility in the two groups. In this figure, we have also included data on 2020 to show that, while not included in the analysis, the difference in the two population persist also over this period. Importantly, Figure S4, and the inset, in the Supplementary Information show the cumulative and frequency distribution of the volatility in the two groups, respectively. The figure illustrates that the differences in the average of the two groups are not due to extreme observations but rather to a consistent small, but significant, difference in the two distributions across the whole sample.
Figure 3. Analysts' reactions and information asymmetry. The figure shows the ratio (a) and the level (b) of idiosyncratic volatility in the effect and no effect population. Overall, the figure shows that the difference between the volatility in the two populations is statistically significant and persists outside the estimation window (2020).
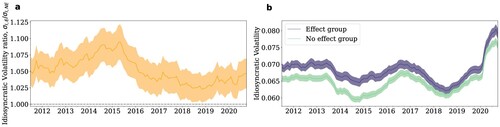
Figure shows that the publication of nonfinancial information is taken into larger consideration by analysts that assess firms with larger idiosyncratic volatility. The idiosyncratic volatility can be seen as a market measure of information asymmetry (see Section 2) and the figure shows an unconditional test in which we did not account for difference in the assets characteristics. To look in further details at the effects of different characteristics of a firm's asset on the probability of begin part of the effect or no effect population, we run a Probit model as discussed in Section 3.1.1.
4.1.1. Probit model
The results of the Probit specification, Equation (Equation4(4)
(4) ), are shown in Table . Before running the regression we standardize the control variables so that the coefficients can be directly compared among each others. The last column in the table shows that Size, Tangibility, and Profitability are negatively and statistically significantly associated with the probability of belonging to the effect group. Following the discussion in Section 3.1.1, this result suggests that information asymmetry is higher in this group. Indeed, analysts and investors (outsiders) have less information than managers (insiders) on the value of intangibles assets of small, less profitable, firms. This result is left unchanged when we explicitly control for the idiosyncratic volatility (Model 8 in Table ), which is a direct measure of information asymmetry. Importantly, idiosyncratic volatility is positively associated with the probability of belonging to the effect group and the coefficient is statistically significant.
Table 4. Probit model.
Interestingly, investment intensity is negatively associated with the probability of belonging to the effect group but the coefficient is not statistically significant. Similarly, we have found that emissions intensity as well as ESG ratings do not influence the probability of belonging to the effect group. That is, whether a firm is a high or a low emitter or has a large or small exposure to ESG risks do not influence the decision of analysts to account for nonfinancial disclosure in their revisions. Finally, we have found a large, positive and statistically significant effect of the integrated report dummy, i.e. reporting nonfinancial information alongside financial data is associated with a higher likelihood of observing a significant revision of earnings.
To confirm the validity of these results, Table shows the results of the robustness tests presented in Section 3.1.2. Overall, results are consistently robust across all the eight tests. However, there are some important considerations that emerge from the analysis of these tests. First, removing the adjustment for self-selectivity or including data from 2020 does not significantly change the results (R.T. 1 and 2). Second, controlling for ESG ratings from different data providers does not change the sign and the significance of the coefficients of the factors related to measures of information asymmetry (R.T. 3-5). However, the statistical significance of the ratings varies across the different providers. This inconsistency is in line with previous studies that have found a lack of correlation between the ESG ratings from different data sources (Berg, Kölbel, and Rigobon Citation2022).
Table 5. Robustness tests.
Third, controlling for national idiosyncrasies through countries rather than geography fixed effect does not significantly change the results either (R.T. 6). Indeed, we already observe systematic differences at the geography level (see Figure S5 in the Supplementary Information). Specifically, firms in the effect group are more concentrated in China, Asia-Pacific (ex-Japan) and Europe, while they are less present in the Americas (both North and South) as well as Japan. Column R.T. 7 shows that including historical values of the control variables does not significantly alter the results. Finally, results are robust, and even stronger, when we use an alternative proxy for the dependent variable (R.T. 8). Indeed, when we use EPS, as opposed to EBITDA as earning measure we find that emission intensity is also statistically significant (results of the identification step of the two populations under the EPS measure are shown in Figure S7). Following the discussion in Section 3.1.1, this result strengthen our finding that revision of earnings are more likely to be significant for firms (and events) with high level of information asymmetry.
Overall, we have found that analysts take into consideration the disclosure of nonfinancial information when revising their earnings estimates for of firms in our sample. The effect is on average positive, statistically significant, and more pronounced for firms with larger information asymmetry that issue integrated reports.
4.2. Effect on equity value
We now focus on the effect of the disclosure of nonfinancial information on the equity value of a firm. Here we run a standard event study as discussed in Section 3.2. We start with an analysis at the population level. Figure (a) shows the cumulative abnormal returns (CAR), i.e. the cumulative sum of the difference between realized and expected returns (Equation (Equation6(6)
(6) )), in basis points. The table next to the figure shows the p-value of the test statistics
(see Section 3.2). The statistics and the abnormal returns are calculated at multiple time windows around the events (i.e. 2, 3, 4, 5, 10, and 20 days) to test for the robustness of the results. Overall, the figure shows that there is evidence for an average effect of the disclosure of nonfinancial information through CSR reports on firms' equity value. The other three panels in the figure look at the heterogeneity of this effect.
Figure 4. Effect on equity value. (a) shows the effect of disclosure of nonfinancial information on equity values at the population level. The x-axis is the number of days prior and after the event. The y-axis is the cumulative abnormal returns (in basis points). The table on the right shows the results of the test to assess the statistical significance of the effects (at multiple time windows). (b) shows the effect of disclosure after publications with positive, negative and no effect on the revision of earnings. Overall, the table and the figure in (b) show that the disclosure of non financial information has a significant impact on firms' market value of equity but the effect is not homogeneous across the population. (c,d) shows the effect after the publication of standalone and integrated reports, respectively. The panels show that the statistically significant impact of CSR reporting on equity values is strongly driven by the publication of integrated reports.
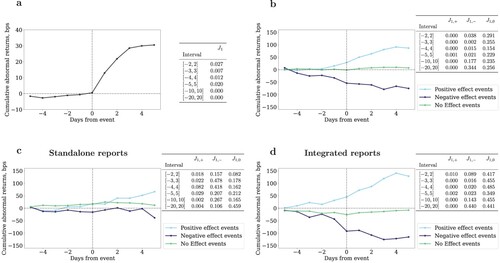
Similarly to the case of financial disclosure, we expect that an important channel for the effect of reporting on equity value is through analysts revisions of earnings. Figure (b) shows the CAR, after positive (cyan), negative (dark blue) and non-significant (green) revision of earnings. The three groups are constructed from the results of Section 4.1. The table on the right shows the p-values of the test statistics at different windows. The panel shows that when analysts give a positive revision to the earnings following the publication of a CSR report the market value of the firm increases. The effect is still significant 20 days after the event (first column and last row of the table). Similarly, when analysts issue a negative revision the effect on market values is negative. However, starting on average 5 days after the event, firms tend to recover from the negative shock. Finally, in the population where disclosure does not influence analysts revisions, we also find no effect of the event on the market value of equity. Overall, the panel suggests that markets react to the revision of earnings that follow the publication of CSR reports, and that negative effects are short lived.
Given the importance of integrated reporting that emerged from the analysis of revision of earnings we replicate the same analysis as above but dividing the events into those taking place after the publication of standalone reports and those taking place after the publication of integrated reports. Results are shown in Figure (c,d), respectively. The figures clearly show that the effect on equity values is strongly driven by integrated reporting. Specifically, we have found that the cumulative abnormal returns are not statistically significant after the publication of standalone CSR reports.Footnote7 On the other hand, the effect is strongly significant after the publication of integrated reports. These results highlight the importance of comprehensive communication of financial and nonfinancial activities within a unified framework.
The results in this section illustrate that the publication of CSR reports has a measurable effect on firms' market values of equity. At the population level the average effect is positive and statistically significant. The effect is particularly strong after positive revisions of earnings following the publication of integrated reports. It is important to notice that here we focused on the effects on equity mediated by the revision of earnings' estimate by market analysts. There could be other channels (e.g. news) that mediate the effects of sustainability reporting on firms' equity value. Estimating the relative importance of different causal channels is beyond the scope of this work but can be an important avenue of research.
4.3. Effect on cost of capital
In this last section, we look at the effect of non financial disclosure on the weighted average cost of capital (WACC). Figure (a) shows the distribution of the p-value of the statistical test (as in Figure (a)) for the effect of sustainability reporting on WACC. Differently from the previous analysis, this distribution is approximatively uniform in the interval [0,0.5] (p-value of the test > 0.1). Therefore, as discussed in Section 3, we cannot claim causality for the effects in the population with p-value less than 0.1. This is because with uniform distributions we are as likely to observe an event with p-value in the interval [0, 0.1] as we are to observe a p-value in any other interval in the support (assuming perfectly uniformity). Put it differently, after controlling for other relevant events, we cannot conclude that in our sample the disclosure of nonfinancial information drives changes in cost of capital.
Figure 5. No effect on cost of capital in our sample. (a) shows the distribution of the statistics , which, differently from Figure (a), is approximately uniform in [0,0.5]. (b) shows the distribution of the effect of disclosure on cost of capital for the events when analysts submit a statistically significant revision (blue) and a not statistically significant revision (green). The panel shows that none of the two distributions is significantly different from the null model. Overall, the figure shows that the disclosure of nonfinancial information has no measurable effect on cost of capital in our sample.
![Figure 5. No effect on cost of capital in our sample. (a) shows the distribution of the statistics SWACC, which, differently from Figure 2(a), is approximately uniform in [0,0.5]. (b) shows the distribution of the effect of disclosure on cost of capital for the events when analysts submit a statistically significant revision (blue) and a not statistically significant revision (green). The panel shows that none of the two distributions is significantly different from the null model. Overall, the figure shows that the disclosure of nonfinancial information has no measurable effect on cost of capital in our sample.](/cms/asset/84c424a1-4c4c-4d70-881d-60271ed0a0a9/tsfi_a_2228746_f0005_oc.jpg)
To further confirm our results we look at the change in WACC after revision of earnings that follow the publication of sustainability reports. We again divide between statistically significant and non-significant revisions. Figure (b), shows that the analysts' effect and no effect events have approximately the same average change in cost of capital. Importantly, the change is not statistically significant as cannot be distinguished to the distribution of the null model. Specifically, we run a t-test for the pairs effect–no effect, effect–null, no effect–null and found that the three averages are statistically the same.
To test if the results of our analysis of the WACC are due to the particular choice of the WACC measure, we repeated the same experiment as the one showed in Figure (a) using two different models for WACC, namely: the Ohlson and Juttner-Nauroth (OJN) model (Ohlson and Juettner-Nauroth Citation2005) and the Finite Horizon Gordon (FHG) model (Gordon and Gordon Citation1997). Details of the models and the results of the analysis are shown in Figure S9 in the Supplementary Information. Overall, results are robust to different measures of WACC: we find no evidence in support for the hypothesis that the disclosure of nonfinancial information has a measurable effect on the WACC.
5. Discussion
Financial systems are moving away from a purely profit maximization paradigm, and externalities, such as social and environmental impact of business operations, are becoming important factors in market dynamics (Schoenmaker and Schramade Citation2019). In this new financial system, market participants, from investors to analysts, require information on the sustainability behavior of corporations in order to allocate capital to its most productive and sustainable use. Nonfinancial information is often disclosed in CSR reports, but the process is largely unregulated and voluntary. Do markets and analysts process information contained in these reports? To answer this question we performed a large event study, backed by carefully constructed null models, over a large population of public corporations in 41 countries. Using our approach we have found a significant heterogeneity in the response of analysts to the publication of CSR reports. That is, the significance, sign and magnitude of the effects in the population are mixed: most of the disclosures () have no effect on analysts' estimates of earnings. The significant effects (
) are typically positive, although we have also found evidence of negative effects (Figure (b,c)).
Importantly, we have found that the publication of integrated reports is more likely to be followed by a statistically significant revision of earnings (Figure (d)). That is, our results suggest that analysts pay more attention to the publication of integrated versus standalone reports. Our results can be explained by two alternative hypotheses. In the first hypothesis, analysts value sustainability information more when integrated with information about financial strategies and performance. Indeed, integrated reports provide a comprehensive view of a corporations and its medium to long term strategies within a combined financial and nonfinancial context. An alternative, simpler, hypothesis is that the presentation of financial information alongside nonfinancial information can act as nudge for the analysts to read the reports and find information that triggers an earning revision. Further research is needed to assess which one of the two hypotheses is more likely to hold true.
We then looked at the characteristics of the firms for which, on average, the publication of CSR reports trigger a statistically significant revision of earnings from financial analysts. We divide our sample in two groups: the effect group (or population) and the no effect group. Firstly, we have found a significant difference in the geographical composition of the two groups: the effect population is predominant in Asia (ex-Japan) and Europe, and less represented in the Americas and Japan. This result is in line with the hypothesis that the importance of CSR disclosure depends on the stakeholder orientation of the country (D. Dhaliwal et al. Citation2014; Rossignoli, Stacchezzini, and Lai Citation2022). Secondly, we have found no differences in the characteristics of the reports, i.e. whether they follow the Global Reporting Initiative (GRI) guidelines, or they are assured by an external auditor, or they reports on national or global activities. However, we have found that the publication of integrated reports is associated with a higher likelihood to observe a firm-event in the effect group (Table last row). The effect is strongly statistically and economically significant. This result is in line with, and, more importantly, extend to a global scale, recent studies that highlight the relevance of integrated reporting for financial analysts (Barth et al. Citation2017; Villiers, Hsiao, and Maroun Citation2020; Caglio, Melloni, and Perego Citation2020; Rossignoli, Stacchezzini, and Lai Citation2022).
Looking at the assets of the firms in the two groups, we have found that firms in the effect population tend to be smaller. Size effects are comparable in magnitude to the role of integrated reporting. Firms in the effect group tend also to be less profitable and to have fewer tangible assets. Small firms with lower earnings and high proportion of intangible assets tend to have higher information asymmetry (as discussed in Section 3.1.1), and therefore these findings provide evidence in support to our hypothesis that adverse selection is an important factor determining whether or not the disclosure of nonfinancial information conveys relevant information to markets' participants. Importantly, the effect persists also after controlling for the type of report (integrated or standalone), self-selectivity bias and an explicit measure of information asymmetry, i.e. idiosyncratic volatility. Moreover, the results are robust to several alternative specifications of the model (Table ). Overall, our findings suggest that disclosure of nonfinancial information is more relevant when outsiders have limited knowledge of the operations of a firm. Other characteristics of the reports, such as materiality and readability for example, could also modulate this response. Assessing the role of these factors is beyond the scope of this work, which focuses on assets' characteristics, but an important avenue of future research (Du and Yu Citation2021).
Looking at the effects of nonfinancial disclosure on the market value of equity we have found that, on average, there is a statistically significant and positive effect of disclosure. This result is in line with, and extends at a global scale, the finding in Du et al. (Citation2017) which were drawn from a small sample of large U.S. firms. The population level positive effect is mostly driven by analysts revision of earnings and it is significantly more pronounced after the publication of integrated reports (Figure ). Importantly, the effect of negative revisions of earnings following CSR disclosure is only temporary, while positive revisions have a long-lasting effects.
The role of integrated reporting in influencing investors choices is particularly interesting. Integrated reports contain both financial and nonfinancial information. Therefore, it is difficult to disentangle the two, and to assess which component has a greater impact on investors. However, because we control for the earning announcements dates, part of the financial effect should have been already priced in. Therefore, we conjecture that it is the integrated view of the financial and nonfinancial activities of a corporation that carries relevant information to markets. Further research is needed to validate this hypothesis.
Finally, we have found no evidence in support for the hypothesis that the disclosure of nonfinancial information has a measurable effect on the cost of capital of firms in our sample. Results are robust to different methodologies to calculate the WACC (see Section B). Results from previous studies are mixed on this topic, reporting negative (El Ghoul et al. Citation2011; Plumlee et al. Citation2015), none (Clarkson et al. Citation2013) and even positive relationships (Richardson and Welker Citation2001) between the two. We believe that the main challenge associated with estimating the effect of nonfinancial disclosure on the cost of capital is that, as noted by Christensen, Hail, and Leuz (Citation2021), the type of activities disclosed in nonfinancial reports can vary significantly across the population and, while the activity types can be an important factor determining the cost of capital, here we are not differentiating activities from reporting.
6. Conclusion
In order to facilitate the transition towards a sustainable and just economy, markets' participants need clear, standardized and consistent information on the sustainability activities of publicly traded corporations. However, given the lack of systematic regulations in reporting standards and the discretion on the format and content of the information released in sustainability reports, a central question in sustainable finance is to what extent and under what conditions sustainability reporting convey relevant information. In this work, we have shown that analysts and other markets' participants value the information content of nonfinancial disclosure, particularly when this information is integrated within a financial context. However, the effect is heterogeneous across the population and largely depends on the level of information asymmetry between insiders and outsiders.
The main implication of our findings concerns the role of integrated reporting, which we have shown can be an effective tool to communicate nonfinancial information to stakeholders across countries and industries. Given the fast changes in regulatory frameworks around nonfinancial reporting standards, we believe that our study highlights the importance of more regulations and better standardization for the publication of integrated reports. Some progress has been made through, for example, the recommendations of the Task Force on Climate-Related Financial Disclosure, but more progress is needed to standardize and enforce consistent integrated reporting along all the sustainability dimensions.
Data accessibility
We used data from third parties that cannot be made publicly available. Specifically, we use data from REFINITIV, S&P Capital IQ, COMPUSTAT, and TruCost. In the Methods section, we provided a detailed description of the data items used in this manuscript.
Supplemental Material
Download PDF (1.2 MB)Acknowledgments
The author would like to thank members of the Leonardo Centre on Business for Society and Stephen Kealhofer for fruitful discussions.
Disclosure statement
No potential conflict of interest was reported by the author(s).
Notes
1 Annual reports are only included if they include substantial data from the nonfinancial sections, which, following the definition on Refinitiv it means at least 5 pages of information.
2 Before the estimation, we convert prices from local currencies in USD using exchange rates data from RERFINITIV.
3 We use the GICS classification for sectors.
4 We do not control for any other characteristics of the reports because hypothesis (2) concerns the effect of asset characteristics which are not driven, and their effect is not confounded, by the characteristics of the reports. Controlling for reports characteristics might change the magnitude of the effect through mediating channels. However, because reports characteristics cannot confound the effect of assets' characteristics they cannot influence the magnitude of the total effects. In other word, there is no need to control for reports characteristics if we are after total, and not covariate-specific effects.
5 We do not control for firms fixed effect because (1) some firms go in and out of the sample, therefore for some observations we have limited number of years (and so subtracting average values would not be a well-defined operations Rajan, Ramella, and Zingales Citation2023), and (2) some of the variables, such as idiosyncratic volatility and emissions are measured with error, and firms fixed effects can significantly increase the noise to signal ratio in the presence of measurement error (Griliches and Hausman Citation1986).
6 See Section 2 for an explanation of how we categorize a report as integrated.
7 The positive effect is statistically but arguably not economically significant.
References
- Aerts, W., D. Cormier, and M. Magnan. 2008. Corporate environmental disclosure, financial markets and the media: An international perspective. Ecological Economics 64, no. 3: 643–659.
- Ahman, M. 2020. Perspective: Unlocking the “Hard to Abate” Sectors, WRI Expert Perspective. https://files.wri.org/expert-perspective-ahman.pdf.
- Akins, B.K., J. Ng, and R.S. Verdi. 2012. Investor competition over information and the pricing of information asymmetry. The Accounting Review 87, no. 1: 35–58.
- Armstrong, C.S., J.E. Core, D.J. Taylor, and R.E. Verrecchia. 2011. When does information asymmetry affect the cost of capital? Journal of Accounting Research 49, no. 1: 1–40.
- Barron, O.E., D. Byard, and O. Kim. 2002. Changes in analysts' information around earnings announcements. The Accounting Review 77, no. 4: 821–846.
- Barth, M.E., S.F. Cahan, L. Chen, and E.R. Venter. 2017. The economic consequences associated with integrated report quality: Capital market and real effects. Accounting, Organizations and Society 62: 43–64.
- Becchetti, L., R. Ciciretti, and A. Giovannelli. 2013. Corporate social responsibility and earnings forecasting unbiasedness. Journal of Banking & Finance 37, no. 9: 3654–3668.
- Berg, F., J.F. Kölbel, and R. Rigobon. 2022. Aggregate confusion: The divergence of ESG ratings*. Review of Finance 26, no. 6: 1315–1344.
- Boffo, R., and R. Patalano. 2020. ESG investing: Practices, progress and challenges. Paris: OECD. https://www.oecd.org/finance/ESG-Investing-Practices-Progress-Challenges.pdf.
- Caglio, A., G. Melloni, and P. Perego. 2020. Informational content and assurance of textual disclosures: Evidence on integrated reporting. European Accounting Review 29, no. 1: 55–83.
- Campbell, J., A. Lo, and A. MacKinlay. 1997. The econometrics of financial markets. Princeton, NJ: Princeton University Press.
- Cenci, S., and S. Kealhofer. 2022. A causal approach to test empirical capital structure regularities. The Journal of Finance and Data Science 8: 214–232.
- Chava, S. 2014. Environmental externalities and cost of capital. Management Science 60, no. 9: 2223–2247.
- Cheung, A.W.K. 2011. Do stock investors value corporate sustainability? Evidence from an event study. Journal of Business Ethics 99, no. 2: 145–165.
- Cho, S.Y., C. Lee, and R.J. Pfeiffer. 2013. Corporate social responsibility performance and information asymmetry. Journal of Accounting and Public Policy 32, no. 1: 71–83.
- Christensen, H.B., L. Hail, and C. Leuz. 2021. Mandatory CSR and sustainability reporting: economic analysis and literature review. Review of Accounting Studies 26, no. 3: 1176–1248.
- Clarkson, P.M., X. Fang, Y. Li, and G. Richardson. 2013. The relevance of environmental disclosures: Are such disclosures incrementally informative? Journal of Accounting and Public Policy 32, no. 5: 410–431.
- Cormier, D., and M. Magnan. 2007. The revisited contribution of environmental reporting to investors' valuation of a firm's earnings: An international perspective. Ecological Economics 62, no. 3–4: 613–626.
- Cormier, D., and M. Magnan. 2015. The economic relevance of environmental disclosure and its impact on corporate legitimacy: An empirical investigation. Business Strategy and the Environment 24, no. 6: 431–450.
- Dhaliwal, D.S., O.Z. Li, A. Tsang, and Y.G. Yang. 2011. Voluntary nonfinancial disclosure and the cost of equity capital: The initiation of corporate social responsibility reporting. The Accounting Review 86, no. 1: 59–100.
- Dhaliwal, D., O.Z. Li, A. Tsang, and Y.G. Yang. 2014. Corporate social responsibility disclosure and the cost of equity capital: The roles of stakeholder orientation and financial transparency. Journal of Accounting and Public Policy 33, no. 4: 328–355.
- Dhaliwal, D.S., S. Radhakrishnan, A. Tsang, and Y.G. Yang. 2012. Nonfinancial disclosure and analyst forecast accuracy: International evidence on corporate social responsibility disclosure. The Accounting Review 87, no. 3: 723–759.
- Diamond, D.W. 1985. Optimal release of information by firms. The Journal of Finance 40, no. 4: 1071–1094.
- Du, S., and K. Yu. 2021. Do corporate social responsibility reports convey value relevant information? Evidence from report readability and tone. Journal of Business Ethics 172, no. 2: 253–274.
- Du, S., K. Yu, C. Bhattacharya, and S. Sen. 2017. The business case for sustainability reporting: Evidence from stock market reactions. Journal of Public Policy & Marketing 36, no. 2: 313–330.
- Easley, D., S. Hvidkjaer, and M. O'Hara. 2002. Is information risk a determinant of asset returns? The Journal of Finance 57, no. 5: 2185–2221.
- Eccles, R., and G. Serafeim. 2013. The performance frontier: Innovating for a sustainable strategy. Harvard Business Review 5, no. 91: 50–56.
- El Ghoul, S., O. Guedhami, C.C. Kwok, and D.R. Mishra. 2011. Does corporate social responsibility affect the cost of capital?. Journal of Banking & Finance 35, no. 9: 2388–2406.
- Fink, J. 2021. A review of the post-earnings-announcement drift. Journal of Behavioral and Experimental Finance 29: 100446.
- Gordon, J.R., and M.J. Gordon. 1997. The finite horizon expected return model. Financial Analysts Journal 53, no. 3: 52–61.
- Gow, I.D., D.F. Larcker, and P.C. Reiss. 2016. Causal inference in accounting research. Journal of Accounting Research 54, no. 2: 477–523.
- Greenwald, D.L., M. Lettau, and S.C. Ludvigson. 2019. How the wealth was won: Factors shares as market fundamentals. Working Paper 25769, National Bureau of Economic Research.
- GRI, and SASB. 2021. A practical guide to sustainability reporting using GRI and SASB standards. https://www.globalreporting.org/media/mlkjpn1i/gri-sasb-joint-publication-april-2021.pdf.
- Griliches, Z., and J.A. Hausman. 1986. Errors in variables in panel data. Journal of Econometrics 31, no. 1: 93–118.
- Hail, L., and C. Leuz. 2006. International differences in the cost of equity capital: Do legal institutions and securities regulation matter?. Journal of Accounting Research 44, no. 3: 485–531.
- Harris, L.E. 2015. Minimum price variations, discrete bid–ask spreads, and quotation sizes. The Review of Financial Studies 7, no. 1: 149–178.
- Healy, P.M., and K.G. Palepu. 2001. Information asymmetry, corporate disclosure, and the capital markets: A review of the empirical disclosure literature. Journal of Accounting and Economics 31, no. 1–3: 405–440.
- Heckman, J.J. 1979. Sample selection bias as a specification error. Econometrica 47, no. 1: 153–161.
- Hinze, A.-K., and F. Sump. 2019. Corporate social responsibility and financial analysts: A review of the literature. Sustainability Accounting, Management and Policy Journal 10, no. 1: 183–207.
- Hope, O.-K., D. Hu, and H. Lu. 2016. The benefits of specific risk-factor disclosures. Review of Accounting Studies 21, no. 4: 1005–1045.
- Ioannou, I., and G. Serafeim. 2015. The impact of corporate social responsibility on investment recommendations: Analysts' perceptions and shifting institutional logics. Strategic Management Journal36, no. 7: 1053–1081.
- Krüger, P. 2015. Corporate goodness and shareholder wealth. Journal of Financial Economics 115, no. 2: 304–329.
- Liu, B., T. Ju, and S.S.S. Gao. 2021. The combined effects of innovation and corporate social responsibility on firm financial risk. Journal of International Financial Management & Accounting 32, no. 3: 283–310.
- Luo, X., and C. Bhattacharya. 2009. The debate over doing good: Corporate social performance, strategic marketing levers, and firm-idiosyncratic risk. Journal of Marketing 73, no. 6: 198–213.
- Matsumura, E.M., R. Prakash, and S. Vera-Munoz. 2017. To disclose or not to disclose climate-change risk in form 10-K: Does materiality lie in the eyes of the beholder? Working Paper.
- Mitra, R.K.. 2016. The association between earnings quality and firm-specific return volatility. Review of Accounting and Finance 15, no. 3: 294–316.
- Muslu, V., S. Mutlu, S. Radhakrishnan, and A. Tsang. 2019. Corporate social responsibility report narratives and analyst forecast accuracy. Journal of Business Ethics 154, no. 4: 1119–1142.
- Myers, S.C. 1984. The capital structure puzzle. The Journal of Finance 39, no. 3: 574–592.
- Nardi, L., T. Zenger, S.G. Lazzarini, and S. Cabral. 2021. Doing well by doing good, uniquely: Materiality and the market value of unique CSR strategies. Strategy Science 7, no. 1: 10–26.
- Nordhaus, W.D. 2017. Revisiting the social cost of carbon. Proceedings of the National Academy of Sciences 114, no. 7: 1518–1523.
- Ohlson, J.A., and B.E. Juettner-Nauroth. 2005. Expected EPS and EPS growth as determinants of value. Review of Accounting Studies 10, no. 2–3: 349–365.
- Pearl, J. 1995. Causal diagrams for empirical research. Biometrika 82, no. 4: 669–688.
- Pearl, J., M. Glymour, and N. Jewell. 2016. Causal inference in statistics: A primer. Chichester, UK: Wiley.
- Peters, J., D. Janzing, and B. Schölkopf. 2017. Elements of causal inference – foundations and learning algorithms, Adaptive Computation and Machine Learning Series. Cambridge, MA, USA: The MIT Press.
- Pflugrath, G., P. Roebuck, and R. Simnett. 2011. Impact of assurance and assurer's professional affiliation on financial analysts' assessment of credibility of corporate social responsibility information. AUDITING: A Journal of Practice & Theory 30, no. 3: 239–254.
- Plumlee, M., D. Brown, R.M. Hayes, and R.S. Marshall. 2015. Voluntary environmental disclosure quality and firm value: Further evidence. Journal of Accounting and Public Policy 34, no. 4: 336–361.
- Rajan, R., P. Ramella, and L. Zingales. 2023. What purpose do corporations purport? Evidence from letters to shareholders. Working Paper 31054, National Bureau of Economic Research. http://www.nber.org/papers/w31054.
- Richardson, A.J., and M. Welker. 2001. Social disclosure, financial disclosure and the cost of equity capital. Accounting, Organizations and Society 26, no. 7–8: 597–616.
- Rossignoli, F., R. Stacchezzini, and A. Lai. 2022. Financial analysts' reaction to voluntary integrated reporting: Cross-sectional variation in institutional enforcement contexts. Journal of Applied Accounting Research 23, no. 1: 29–54.
- Schoenmaker, D., and W. Schramade. 2019. Principles of sustainable finance. Oxford, UK: Oxford University Press.
- Seroka-Stolka, O., and K. Fijorek. 2020. Enhancing corporate sustainable development: Proactive environmental strategy, stakeholder pressure and the moderating effect of firm size. Business Strategy and the Environment 29, no. 6: 2338–2354.
- Stan, K., G.A. Watt, and A. Sanchez-Azofeifa. 2021. Financial stability in response to climate change in a northern temperate economy. Nature Communications 12, no. 1: 7161.
- Tol, R.S.J. 2009. The economic effects of climate change. Journal of Economic Perspectives 23, no. 2: 29–51.
- Verrecchia, R.E. 1982. Information acquisition in a noisy rational expectations economy. Econometrica 50, no. 6: 1415–1430.
- Villiers, C., P.-C. Hsiao, and W. Maroun. 2020. The Routledge handbook of integrated reporting. New York, NY: Routledge.
- Yuen, K.F., K.W. Ong, Y. Zhou, and X. Wang. 2023. Social media engagement of stakeholders in the oil and gas sector: Social presence, triple bottom line and source credibility theory. Journal of Cleaner Production 382: 135375.
- Zadeh, M.H., M. Magnan, D. Cormier, and A. Hammami. 2021. Environmental and social transparency and investment efficiency: The mediating effect of analysts' monitoring. Journal of Cleaner Production322: 128991.
- Zhang, K., J. Peters, D. Janzing, and B. Schölkopf. 2011. Kernel-based conditional independence test and application in causal discovery. In Proceedings of the twenty-seventh conference on uncertainty in artificial intelligence, UAI'11, 804–813, Arlington, VA, USA: AUAI Press.