
ABSTRACT
The impoundment of running waters through the construction of large dams is recognised as one of the most important factors determining the transport, transformation, and outgassing of carbon (C) in fluvial networks. However, the effects of small and very small water retention structures (SWRS) on the magnitude and spatiotemporal patterns of C emissions are still unknown, even though SWRS are the most common type of water retention structure causing river fragmentation worldwide. Here we evaluated and compared diffusive carbon dioxide (CO2) and methane (CH4) emissions from river sections impounded by SWRS and from their adjacent free-flowing sections along a highly impounded river. Emissions from impounded river sections (mean [SE] = 17.7 [2.8] and 0.67 [0.14] mmol m−2 d−1, for CO2 and CH4, respectively) never exceeded those from their adjacent free-flowing river sections (230.6 [49.7] and 2.14 [0.54] mmol m−2 d−1). We attribute this finding to the reduced turbulence in impounded river sections induced by SWRS compared to free-flowing river sections (i.e., physical driver). Likewise, the presence of SWRS favoured an increase of the concentration of CH4 in impounded waters, but this increase was not sufficient to cause a significant influence in the CH4 efflux from the downstream free-flowing river sections. By contrast, this influenced the larger-scale longitudinal patterns of dissolved CH4, which exhibited a clear shifting pattern along the study stretch, modulated by variables associated with the presence of SWRS, such as higher water residence times, higher sedimentation rates, and higher temperatures. Overall, our results show that the presence of SWRS can modify the concentrations of C gases in highly impounded rivers but exerts a minor influence on diffusive C emissions.
Introduction
Inland waters are active components of the global carbon (C) cycle that transform, store, and outgas more than half of the C they receive from terrestrial ecosystems (Cole et al. Citation2007, Battin et al. Citation2009a, Tranvik et al. Citation2009, Aufdenkampe et al. Citation2011). According to recent global estimates, fluvial networks outgas 2.1 PgC y−1 in the form of carbon dioxide (CO2), of which 1.8 PgC y−1 is emitted from streams and rivers (Raymond et al. Citation2013) and 0.32 PgC y−1 from lakes and reservoirs (Raymond et al. Citation2013). Similarly, fluvial networks outgas 0.09 PgC y−1 in the form of methane (CH4), of which 0.02 PgC y−1 is emitted from streams and rivers (Stanley et al. Citation2016) and 0.07 PgC y−1 from lakes and reservoirs (Bastviken et al. Citation2011, Deemer et al. Citation2016). Despite the increasing availability of data covering both spatial and temporal variability, fundamental uncertainties persist regarding the magnitude and spatiotemporal patterns of C emissions along highly impounded rivers where lotic and lentic sections interact in series.
Because of the high human demand for energy and water, many fluvial networks worldwide have been regulated with a variety of hydraulic structures ranging from large dams to smaller reservoirs, impoundments, and weirs (Nilsson et al. Citation2005, Döll et al. Citation2009). Thus, the natural condition of many fluvial networks as uninterrupted water conduits draining water from the catchments to the ocean (Vannote et al. Citation1980, Frissell et al. Citation1986) has been replaced by an alternating series of lotic and lentic reaches (Ward and Stanford Citation1983, Stanford and Ward Citation2001). Disruption of the water flow by dams changes the hydrological dynamics of rivers (Kondolf and Batalla Citation2005, Grill et al. Citation2015), thereby altering the water physicochemistry (Ward and Stanford Citation1983) and the transport of suspended particles (Syvitski et al. Citation2005, Houser et al. Citation2010), ultimately leading to multiple consequences for the structure and function of aquatic biological communities (Haxton and Findlay Citation2008, Ponsatí et al. Citation2015, von Schiller et al. Citation2015, Proia et al. Citation2016).
The increase in water residence time caused by river impoundment favours the mineralization of organic matter (OM) and CO2 supersaturation by increasing the interaction between organic substrates and biological actors (Battin et al. Citation2009b, Acuña and Tockner Citation2010, Crawford et al. Citation2016). Moreover, sediments, OM, and nutrients tend to accumulate in the lentic waterbodies upstream from water retention structures because of the high deposition rates typically occurring in these types of aquatic ecosystems (Syvitski et al. Citation2005, Maeck et al. Citation2013). The trapping of OM often leads to the development of anaerobic sedimentary environments where active methanogenesis takes place. This enchancing process leads to subsequent CH4 supersaturation of the water column and release of CH4 to the atmosphere (Keller and Stallard Citation1994, Giles Citation2006, Delsontro et al. Citation2010).
Most quantitative estimates of C emissions from impounded waters have been obtained for very large (>104 km2), large (104–102 km2), and medium-sized (100–1 km2) reservoirs (St. Louis et al. Citation2000, Barros et al. Citation2011, Deemer et al. Citation2016). These estimates indicate that the depositional zones close to the river inflow, where fresh OM enters the reservoir (i.e., the riverine–lacustrine transition zone; Wetzel Citation2001), are active compartments in terms of CO2 and CH4 production and emission, despite their relatively small areal coverage (Beaulieu et al. Citation2016). In smaller impoundments (<1 km2), the riverine–lacustrine transition zone can cover a larger fraction of the reservoir’s surface area and still host intense CO2 and CH4 production, making these systems potential “hot spots” for C emissions to the atmosphere (Maeck et al. Citation2013).
Small water retention structures (SWRS) include small to very small impoundments with an impounded area <0.1 km2 and a volume <0.2 hm3 (Lehner et al. Citation2011). These systems, despite their small global areal extent (3.8% of the global reservoir surface area; Downing et al. Citation2006, Lehner et al. Citation2011), represent one of the most common features in freshwater landscapes (99.5% of the total number of reservoirs worldwide; Downing et al. Citation2006, Lehner et al. Citation2011). They remain overlooked, however, or even ignored in most biogeochemical studies in fluvial networks (Downing et al. Citation2006). SWRS are also of increasing concern because their cumulative effects may be considerable (Downing et al. Citation2006). For example, Harrison et al. (Citation2009) showed that SWRS play an important role in the regional and global removal of nitrogen from surface water. Casas-Ruiz et al. (Citation2015) showed that the presence of SWRS generates changes in the composition and degradation of dissolved OM in rivers. Similarly, Proia et al. (Citation2016) found that the presence of SWRS modifies the natural dynamics of C processing along the river network by altering the structure and activity of microbial communities. These findings lead to the intriguing question of whether SWRS can affect the magnitude and patterns of diffusive CO2 and CH4 emissions as larger impoundments do.
Here we investigated the effect of SWRS on the concentrations and diffusive emissions of C gases in an intensively impounded stretch of a Mediterranean river. To this end, we measured the dissolved concentrations and diffusive emissions of CO2 and CH4 in impounded and free-flowing riverine sections on a seasonal basis. We hypothesised that the presence of SWRS would lead to higher water residence times and higher OM accumulation, thus enhancing aerobic heterotrophic respiration and anaerobic methanogenesis in both the water column and the sediments of impounded waters. We therefore predicted high concentrations and emission rates of CO2 and CH4 in impounded river sections associated with SWRS compared to their upstream free-flowing sections. We also hypothesised that the CO2 and CH4 accumulated in impounded river sections would enhance emissions from the free-flowing sections located downstream from the dams. Thus, we expected higher CO2 and CH4 emissions from free-flowing riverine sections located downstream than from those located upstream of SWRS.
Methods
Study site and sampling design
The Fluvià River (northeastern Iberian Peninsula) is 97 km long with a mean annual flow of 3.6 m3 s−1 at the catchment outlet (data from 2004 to 2014, Catalan Water Agency; http://aca.gencat.cat/ca/inici). The Fluvià River catchment (990 km2) is mostly calcareous, with some areas (<15%) of siliceous materials (Cartographic and Geological Institute of Catalonia, 2006, http://www.icc.cat) and covered with mixed forests (78%), agricultural (19%), and urban (3%) areas (Land Cover Map of Catalonia, Centre of Ecology and Forestry Research of Catalonia, 2009, http://www.creaf.cat). The climate is typically Mediterranean. The mean monthly air temperature ranges from 6 °C in January to 26 °C in July, and the mean annual precipitation is 660 mm, with rainfall primarily occurring in autumn and spring and occasional storms in summer (data from 2004 to 2014, Catalan Water Agency). The water flow of the Fluvià River has been deeply modified due to the high human demand for energy and water (García-Ruiz et al. Citation2011). Its fluvial network presents up to 61 SWRS that alter the flow dynamics from its headwaters to the river mouth (Pavón Citation2010).
This study focused on a highly impounded 36 km stretch situated in the upper part of the Fluvià river main stem (). To cover a wide spectrum of hydromorphological and trophic conditions (), we selected 11 SWRS to sample in spring (28–30 Apr), summer (2–4 Sep), and winter (9–11 Dec) 2014. At each site, we sampled the stagnant water impounded in the SWRS and the free-flowing riverine sections located upstream and downstream (). The distance between the SWRS and the downstream sampled free-flowing river section was between 20 and 380 m.
Figure 1. Location of (a) the Fluvià River catchment (northeastern Iberian Peninsula), with the position of the studied small water retention structures (SWRS; black circles, n = 11). See for a detailed hydromorphological and physicochemical description of the waters impounded in the studied SWRS. (b) Scheme of a SWRS sampling unit (i.e., upstream free-flowing river, impounded water, and downstream free-flowing river) sampled at each study site.
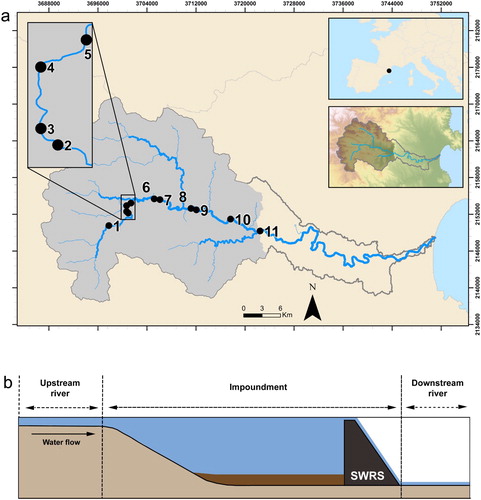
Table 1. Hydromorphological and physicochemical characteristics of the 11 studied impoundments. DOC = dissolved organic carbon, TDN = total dissolved nitrogen.
Determination of diffusive CO2 and CH4 fluxes
In the impounded river sections, we determined the CO2 flux across the water–air interface by the enclosed chamber method (Frankignoulle Citation1988). Briefly, we monitored the CO2 gas concentration in an opaque floating chamber every 4.8 s with an infrared gas analyser (EGM-4, PP-Systems, USA). In all cases, flux measurements lasted until a change in CO2 of at least 10 µatm was reached, with a maximum duration of 600 s and a minimum of 300 s. We calculated the CO2 flux from the rate of change of CO2 inside the chamber as follows:(1) where
is the change in CO2 concentration in the chamber along time in µatm s−1, V and S are the volume and surface area of the chamber (27.1 dm3 and 19.4 dm2, respectively), T is the air temperature in Kelvin, and R is the ideal gas constant (L atm K−1 mol−1). Positive CO2 flux values represent efflux of gas to the atmosphere while negative CO2 flux indicate influx of gas from the atmosphere. We performed 2 measurements in the central part of the impounded water after flushing the chamber with ambient air between consecutive measurements.
At each SWRS, we determined the partial pressure of CO2 and CH4 in the water (,
) and in air (
,
) at the same location as we took the flux measurements. We measured the
with an infrared gas analyser (EGM-4, PP-Systems, USA) coupled to a membrane contactor (MiniModule, Liqui-Cel, USA). The water was circulated by gravity through the contactor at 300 mL min−1, and the equilibrated gas was continuously recirculated into the infrared gas analyser for instantaneous
measurements (Teodoru et al. Citation2010). Measurement accuracy of the infrared gas analyser is estimated to be within 1% over the calibrated range. We determined the
by the headspace equilibrium technique and gas chromatography described by Striegl et al. (Citation2012). Briefly, we collected 40 mL of water with a 60 mL polypropylene syringe creating a headspace with ambient air of 3:2 ratio (water sample to ambient air). To facilitate the kinetics of equilibration between the liquid and the gas phase, we vigorously shook the syringe for 1 min and then submerged it for 30 min at constant water temperature. We then transferred the 20 mL of equilibrated gas to a preevacuated gas-tight glass tube (Exetainers, Labco Limited, UK). The CH4 samples were analysed in the laboratory with a gas chromatograph coupled to a Flame Ionization Detector (Trace GC Ultra, Thermo Fisher Scientific, USA). Measurement accuracy of the gas chromatograph is estimated to be within 4% over the calibrated range. For
and
, the air samples were taken ∼1 m above the water surface layer and directly analysed with the infrared gas analyser and the gas chromatographer, respectively.
We used the CO2 flux measured with the chamber to derive the gas transfer velocity of CO2 () from Fick’s law of gas diffusion:
(2) where
is the specific gas transfer velocity for CO2 (m d−1), CO2 flux is the chamber-measured CO2 flux between the surface water and the atmosphere (mmol m−2 d−1), and
is the Henry’s constant (mmol µatm−1 m−3) adjusted for salinity and temperature (Weiss Citation1974, Millero Citation1995). Because the gas transfer velocity is temperature and gas dependent, we standardised
to a Schmidt number of 600 (
; m d−1), which corresponds to CO2 at 20 °C in freshwater:
(3) where Sc is the Schmidt number of a given gas at a given water temperature (Jähne and Münnich Citation1987, Wanninkhof Citation1992, Bade Citation2009).
At each SWRS, we calculated the diffusive CH4 flux across the water–air interface (mmol m−2 d−1) following Equationequation 2(2) and combining
,
, and the chamber-derived
obtained by applying Equationequation 3
(3) for CH4.
In the free-flowing riverine sections upstream and downstream the SWRS, we determined the diffusive CO2 and CH4 flux across the water–air interface (mmol m−2 d−1) using Equationequation 2(2) . At each river section, we determined
,
,
, and
following the same technique described above, and we estimated the river section gas transfer velocity from the section slope (s; m m−1) and the mean section water velocity (v; m s−1) with Equationequation 4
(4) in Raymond et al. (Citation2012):
(4) The
was transformed to
and
following Equationequation 3
(3) . Note that the applicability of indirect
and
in the free-flowing riverine sections based on stream morphometric and hydrologic variables (Raymond et al. Citation2012) has previously been tested and validated in the same river network by Gómez-Gener et al. (Citation2016).
Statistical analyses
We investigated the overall effect of the SWRS on the CO2 and CH4 fluxes, concentrations, and gas transfer velocities in each season by using a one-way repeated measures analysis of variance (ANOVA). We performed subsequent post hoc comparisons (Tukey’s honest significant differences test) to evaluate the specific effect of SWRS on (1) the impounded water CO2 and CH4 fluxes, concentrations, and gas transfer velocities by comparing impounded waters and free-flowing upstream reaches, and (2) the downstream C fluxes, concentrations, and gas transfer velocities by comparing upstream and downstream free-flowing river sections adjacent to the SWRS.
We assessed the relative influence of and
on the CO2 efflux using simple linear regression models. We used the same statistical approach to assess the relative influence of
and
on the CH4 efflux.
We built 2 partial-least squares regression models (PLS) to identify the potential drivers of impounded water and
. PLS is a regression extension of a principal component analysis (PCA) that allows the exploration of relationships between multiple and collinear independent (X; potential explanatory variables listed and described in Supplemental Table S1) and dependent (Y;
and
) data matrices. This linear, multivariate model produces latent variables (i.e.; PLS loadings) representing the combination of X-variables that best describe the distribution of observations in a Y space (Wold et al. Citation2001). For each Y-variable, the best PLS model was selected by iteratively removing X-variables to maximise the goodness of fit (R2Y) and the predictive ability (Q2Y) of the model. In each case, Q2Y was determined by comparing modelled and actual Y observations through an iterative, cross-validation process. We identified the influence of each X-variable by using variable influence on the projection (VIP) scores, calculated as the sum of square of the PLS weights across all components. Variables with high influence on impounded water
and
were identified as VIP > 1, variables with moderate influence as VIP between 1 and 8, and low influence as VIP < 0.8 (Wold et al. Citation2001).
All statistical analyses were conducted in the R statistical environment (R Core Team 2013) using the vegan package (Oksanen et al. Citation2015), except for PLS, which was analysed with the software XLSAT (XLSTAT 2015.2.01, Addinsoft SRAL, Germany). When necessary, we log-transformed data to meet parametric assumptions. In all cases, differences were considered statistically significant when p < 0.05.
Results
Diffusive CO2 and CH4 emissions
The surface waters impounded in the 11 SWRS were net emitters of CO2 (mean [SE] = 17.7 [2.8] mmol m−2 d−1, range = −2.1 to 86.2 mmol m−2 d−1; ) and CH4 (0.67 [0.14] mmol m−2 d−1, range = 0.01–3.29 mmol m−2 d−1; ) to the atmosphere in the 3 studied seasons. The only exception to this pattern occurred at site N5, which acted as a sink of CO2 in winter (−2.1 mmol m−2 d−1). Nonetheless, the CO2 and CH4 effluxes from the impounded river sections never exceeded those from their adjacent free-flowing river sections, which were also always net emitters of both C gases to the atmosphere (–). More precisely, the efflux from impounded waters was significantly lower than their upstream and downstream free-flowing river sections in the case of CO2 (ANOVA, F = 10.26, p < 0.001, n = 33; ) but comparable in the case of CH4 (ANOVA, F = 4.82, p = 0.23, n = 33; ).
Figure 2. Mean (a) CO2 efflux, (b) CH4 efflux and CH4 efflux expressed as CO2-equivalents (CO2-equivalents = CO2e; 1 g CH4 = 28 g CO2e; IPCC 2013), (c) partial pressure of CO2 in water (), (d) partial pressure of CH4 in water (
), (e) gas transfer velocity of CO2 (
), and (f) gas transfer velocity of CH4 (
) of the 11 SWRS grouped by sampling units (i.e., upstream river, impoundment water, and downstream river) during the 3 sampled seasons (i.e., spring, summer, and winter). Error bars represent standard error (SE). Significant differences of reported parameters between SWRS units (p < 0.05, Tukey’s post hoc test after repeated measures ANOVA) are marked with different letters above the bars.
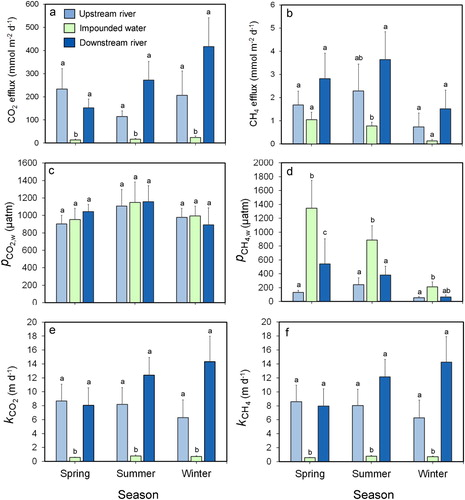
No significant differences among SWRS sampling units (i.e., upstream free-flowing river section, impounded river section, and downstream free-flowing river section) in terms of (ANOVA, F = 0.08, p = 0.92, n = 33; ) were detected. By contrast, we detected significant differences among SWRS sampling units in terms of
(ANOVA, F = 7.47, p < 0.001, n = 33; ). Specifically, we detected a significant increase in
in the impounded waters in relation to their upstream free-flowing river sections (ANOVA, post hoc, p < 0.001, n = 33; ). In spring, this effect was enhanced and translated into an increase of
in the flowing sections downstream the SWRS (ANOVA, post hoc, p = 0.01, n = 33; ). This impounded-waters
increase was, however, not sufficient to significantly influence the CH4 efflux of the downstream riverine sections (ANOVA, post hoc, p = 0.18, n = 33; ).
The surface water turbulence (measured as and
) was significantly lower in the impounded river sections than in free-flowing river sections for both CO2 (ANOVA, F = 18.36, p < 0.001, n = 33; ) and CH4 (ANOVA, F = 18.32, p < 0.001, n = 33; ). These 2 parameters govern the diffusive CO2 and CH4 emissions (see Equationequation 2
(2) ), and the surface water turbulence (measured as
and
) showed a significant positive relationship with both the CO2 efflux (CO2 efflux = 31.1
+ 46.2; r2 = 0.61, p < 0.001, n = 33; Supplemental Fig. S1a) and the CH4 efflux (CH4 efflux = 31.1
+ 46.2; r2 = 0.61, p < 0.001, n = 33; Supplemental Fig. S1b).
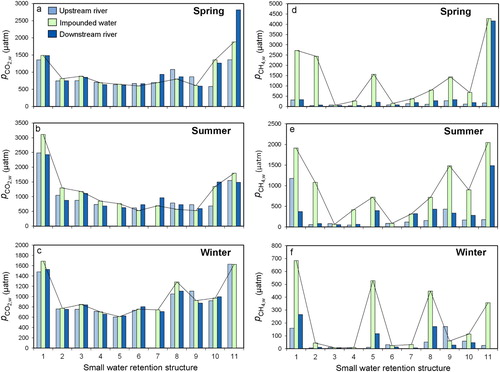
Longitudinal patterns of  and
and
Distinct longitudinal patterns along the studied 36 km stretch were identified for and
(). The
showed a relatively smooth downstream pattern during the 3 investigated seasons (–). By contrast, the presence of SWRS not only influenced the dynamics of
at the local scale (discussed earlier) but also led to abrupt fluctuations in the
longitudinal pattern (–). Although this longitudinal
pattern was consistent in the 3 studied seasons, a more marked fluctuating pattern was observed during winter ().
Figure 3. Downstream longitudinal patterns of the partial pressure of CO2 in water () in (a) spring, (b) summer, and (c) winter and of the partial pressure of CH4 in water (
) in (d) spring, (e) summer, and (f) winter across the 11 small water retention structure (SWRS) units (i.e., upstream river, impoundment water, and downstream river). The continuous solid lines represent the mean impoundment water
or
. Water flow direction goes from left to right.
Drivers of impounded water and
The PLS models identified distinct combinations of factors as predictors of impounded water and
(, Supplemental Table S2). The PLS model for
extracted 2 components from the data matrix that explained 68% of the variance (, Supplemental Table S2). The most influential factors (VIP > 1) on
were surface area, water residence time,
, electrical conductivity, and alkalinity, while the moderately influential factors (VIP between 0.8 and 1) on
were surface water oxygen saturation, dissolved organic carbon (DOC) concentration, and pH (see the direction and the relative strength of the effect of each factor on the
in Supplemental Table S2).
Figure 4. Loadings plot of the partial least squares (PLS) regression analysis for (a) partial pressure of CO2 in water () and (b) partial pressure of CH4 in water (
). The graph shows how the Y-variable (squares) correlates with X-variables (circles) and the correlation structure. X-variables are classified according to their variable influence on projection value (VIP): highly influential (black circles), moderately influential (grey circles), and less influential (white circles). The X-variables situated near Y-variables are positively correlated to them and those situated on the opposite side are negatively correlated (see Supplemental Tables S1 and S2 for explanation of abbreviations and summary of PLS models, respectively).
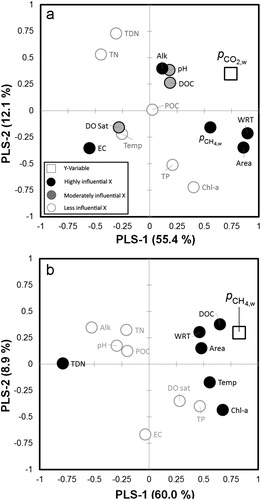
The PLS model for extracted 2 components from the data matrix that explained 69% of the variance (, Supplemental Table S2). The most influential factors (VIP > 1) on
were surface area, water residence time, total dissolved nitrogen concentration, DOC concentration, surface water temperature, and concentration of Chl-a in suspension (see the direction and the relative strength of the effect of each factor on the
in the Supplemental Table S2); no moderately influential factors were obtained from the PLS model for
.
Discussion
Low diffusive CO2 and CH4 emissions from impounded waters
Disruption of water flow by retention structures changes the hydrological dynamics of rivers, leading to higher water residence times and higher OM deposition rates (Syvitski et al. Citation2005, Acuña and Tockner Citation2010, Maeck et al. Citation2013). The intense accumulation of OM in lacustrine sediments typically boosts aerobic and anaerobic heterotrophic processes (Maeck et al. Citation2013), consequently favouring the enrichment of surface waters in CO2 and CH4 and ultimately leading to high C emissions to the atmosphere (Cole et al. Citation2000, St. Louis et al. Citation2000, Duarte and Prairie Citation2005, Giles Citation2006). Contrary to our expectations, however, the diffusive CO2 and CH4 emissions from impounded waters in our study never exceeded those from adjacent upstream free-flowing riverine waters (treated as reference systems without SWRS influence). We attribute this finding to the reduced turbulence in impounded river sections induced by SWRS compared to free-flowing river sections. Our results agree with previous findings that emphasised the importance of the gas transfer velocity as a major driver of diffusive CO2 and CH4 emissions from fluvial networks encompassing lakes and reservoirs (Guérin et al. Citation2007, Lundin et al. Citation2013, Crawford et al. Citation2014, Gómez-Gener et al. Citation2015).
Note that the total C emitted to the atmosphere and associated atmospheric effect from the studied sections is mainly dominated by the CO2 form (–, principal y-axis). The ∼30-fold higher global warming potential of CH4 compared to that of CO2 over a 100-year time horizon (IPCC Citation2013) may, however, substantially balance the atmospheric contribution of both C forms (, secondary y-axis). Therefore, the results from this study also emphasise the importance of including CH4 fluxes when aiming to understand the effects of the global warming on aquatic–atmospheric interactions in highly impounded rivers.
For CH4, we must consider that our estimates in the studied impounded waters did not account for the ebullitive efflux (i.e., CH4 bubbling). The ebullitive CH4 efflux has been described as a major pathway for CH4 efflux in very large, large, and medium-sized reservoirs (>1 km2; Fearnside and Pueyo Citation2012, Sobek et al. Citation2012, Beaulieu et al. Citation2016, Deemer et al. Citation2016), small impounded systems (<1 km2; Maeck et al. Citation2013), and very small systems previously examined in the same river (<0.1 km2; Gómez-Gener et al. Citation2015). Specifically, Gómez-Gener et al. (Citation2015) showed that the ebullitive CH4 efflux from 5 impounded systems in the same river network substantially contributed to the total CH4 efflux to the atmosphere. Therefore, based on their results, we may expect that the inclusion of ebullition estimates (e.g., using inverted funnel-style bubble traps) in our sampling design would probably have led to higher total CH4 emission rates in the studied impounded waters compared to the free-flowing river sections.
Low effect of SWRS on downstream diffusive CO2 and CH4 emissions
Flow regulation by dams not only affects C emissions from the surface waters of reservoirs but may also influence the C emissions in the riverine sections downstream from the reservoir (Guérin et al. Citation2006, Kemenes et al. Citation2007). Emissions downstream of reservoirs have generally been poorly studied and are usually not taken into account in reservoir C balances (Barros et al. Citation2011). The few works reporting C emissions downstream of reservoirs, mainly conducted in large reservoirs situated in the tropic region, showed that downstream C emissions can account for 7–25% of total CO2 emissions from reservoirs (Abril Citation2005, Guérin et al. Citation2006) and 50–90% of total CH4 emissions (Abril Citation2005, Guérin et al. Citation2006, Kemenes et al. Citation2007).
In the present study, we found no significant differences in CO2 or CH4 effluxes between free-flowing river sections located upstream and downstream of SWRS, even though significant enrichment in CH4 in the impounded surface water was evident. We propose that this finding may be at least partially due to the loss of CO2 and CH4 along the distance between the SWRS and the downstream sampling stations. We acknowledge that although the distance between the SWRS and the downstream sampling stations was relatively short (never exceeding 380 m), a nonquantifiable part of CO2 and CH4 could have been emitted along this distance (e.g., in the waterfall associated with the SWRS; Galy-Lacaux et al. Citation1997, Wehrli Citation2013, Deshmukh et al. Citation2015). Therefore, this result suggests the need to reduce the distance with the downstream sampling station and to include CO2 and CH4 emissions from the waterfall and turbine in this type of quantification.
Routing vs. local controls on the longitudinal patterns of dissolved CO2 and CH4 concentrations
Conceptual models of longitudinal patterns in streams and rivers are framed by the interplay of 2 contrasting perspectives. Some frameworks emphasize flow as an integrator over space (Vannote et al. Citation1980, Montgomery Citation1999; i.e., routing control), but other frameworks highlight patchiness and abrupt spatial changes (Frissell et al. Citation1986, Thorp et al. Citation2006, Winemiller et al. Citation2010; i.e., local control). These models are based on gradient analyses in which rivers are ultimately viewed as uninterrupted continua; however, few fluvial networks remain free from flow regulation over the entire course but, contrarily, typically result in an alternating series of lentic and lotic reaches (Ward and Stanford Citation1983, Nilsson et al. Citation2005, Döll et al. Citation2009).
Here we found that the downstream longitudinal patterns of dissolved C gases in water differed considerably depending on the gas species. CO2 concentrations varied moderately and homogeneously both at the local scale (i.e., across SWRS sampling units) and at the river network scale (i.e., along the 36 km study stretch). This pattern suggests that although local controls may influence CO2 concentrations in river water, the longitudinal dynamics of this gas have a routing control (Montgomery Citation1999) where the CO2 lost in riverine sections is constantly replenished by CO2 produced internally or imported from the catchment (Hotchkiss et al. Citation2015, Gómez Gener et al. Citation2016). By contrast, CH4 concentrations showed a more variable pattern both at local and river network scales, and this shifting longitudinal pattern suggests that the concentration of CH4 is highly dominated by local controls such as the presence of SWRS (Stanley et al. Citation2016). Likewise, the difference in between impounded and riverine sections also highlights the high reactivity and dynamism of this gas, which within a few meters can be generated and rapidly emitted or consumed via oxidation (Guérin et al. Citation2006, Kemenes et al. Citation2007).
Regulation of dissolved CO2 and CH4 concentrations from impounded waters
Surface water supersaturation of dissolved CO2 and CH4 in impounded waters was persistent along the studied stretch and across seasons. Nonetheless, the results from the PLS models suggest that the drivers of gas supersaturation in SWRS differ between CO2 and CH4.
CO2 supersaturation in impounded waters was explained by a combination of factors related to internal metabolic processes (i.e., oxygen saturation level, dissolved organic carbon, water residence time, and system surface area) and factors that may be related to hydrological inputs of CO2 from soil respiration and mineral weathering within the catchment (i.e., surface water alkalinity, pH, and electrical conductivity). These results support the idea that direct terrestrial or geological origin of river (Stets et al. Citation2009, McDonald et al. Citation2013, Hotchkiss et al. Citation2015, Marcé et al. Citation2015) does not contradict the widespread notion of net heterotrophy leading to CO2 supersaturation in different aquatic ecosystems (Duarte and Prairie Citation2005, Lapierre et al. Citation2013). In the case of
, our results suggest that the presence of SWRS, despite their relatively small water retention capacity, can still produce effects on impounded water
similar to those previously found in larger impoundments (Delsontro et al. Citation2010, Maeck et al. Citation2013, Beaulieu et al. Citation2016), for example by enhancing anaerobic processes in the sediments (Maeck et al. Citation2013, Crawford and Stanley Citation2016).
Conclusions and implications
Because of the attenuated turbulence induced by SWRS, the diffusive CO2 emission from impounded river sections was significantly lower than that from free-flowing river sections. Contrarily, no reduction in diffusive CH4 emissions associated with the presence of SWRS was detected, likely because the significant enrichment in CH4 at the impounded river sections compared to the free-flowing river sections compensated the physical effect on diffusive CH4 emissions. The significant enrichment in CH4 detected in the impounded waters was not sufficient, however, to significantly increase the diffusive CH4 efflux from the downstream free-flowing riverine sections. Nonetheless, it influenced the overall longitudinal patterns of CH4 concentration along the 36 km study stretch. These longitudinal patterns of CH4 concentration along the study stretch, which were driven by local factors associated with the presence of SWRS, emphasise that viewing a river as a continuum is insufficient to describe the true spatial complexity of C gas fluxes in fluvial networks.
Supplemental Material
Download MS Word (79.5 KB)Acknowledgements
This research was funded by the Olot City Council through an Oriol de Bolòs research grant to BO and was supported by the Spanish Ministry of Economy and Competitiveness (FUNSTREAM CGL2014-58760-C3-1R). LG was supported by an FPI predoctoral grants (BES-2012-059743). We thank Silvia de Castro for field and laboratory assistance.
ORCID
Lluís Gómez-Gener http://orcid.org/0000-0003-3279-3589
Related Research Data
References
- Abril G. 2005. Carbon dioxide and methane emissions and the carbon budget of a 10-year old tropical reservoir (Petit Saut, French Guiana). Glob Biogeochem Cy. 19:1–16. doi: 10.1029/2005GB002457
- Acuña V, Tockner K. 2010. The effects of alterations in temperature and flow regime on organic carbon dynamics in Mediterranean river networks. Glob Chang Biol. 16:2638–2650.
- Aufdenkampe AK, Mayorga E, Raymond PA, Melack JM, Doney SC, Alin SR, Aalto RE, Yoo K. 2011. Riverine coupling of biogeochemical cycles between land, oceans, and atmosphere. Front Ecol Environ. 9:53–60. doi: 10.1890/100014
- Bade DL. 2009. Gas exchange across the air-water interface. In: Gene EL, editor. Encyclopedia of inland waters. Oxford (UK): Academic Press; p. 70–78.
- Barros N, Cole JJ, Tranvik LJ, Prairie YT, Bastviken D, Huszar VLM, del Giorgio P, Roland F. 2011. Carbon emission from hydroelectric reservoirs linked to reservoir age and latitude. Nat Geosci. 4:593–596. doi: 10.1038/ngeo1211
- Bastviken D, Tranvik L, Downing J. 2011. Freshwater methane emissions offset the continental carbon sink. Science. 331:50. doi: 10.1126/science.1196808
- Battin TJ, Luyssaert S, Kaplan LA, Aufdenkampe AK, Richter A, Tranvik LJ. 2009a. The boundless carbon cycle. Nat Geosci. 2:598–600. doi: 10.1038/ngeo618
- Battin TJ, Kaplan LA, Findlay S, Hopkinson CS, Marti E, Packman AI, Newbold JD, Sabater F. 2009b. Biophysical controls on organic carbon fluxes in fluvial networks. Nat Geosci. 2:595–595. doi: 10.1038/ngeo602
- Beaulieu J, McManus M, Nietch C. 2016. Estimates of reservoir methane emissions based on a spatially-balanced probabilistic-survey. Limnol Oceanogr. 61:27–40. doi: 10.1002/lno.10284
- Casas-Ruiz JP, Tittel J, von Schiller D, Catalán N, Obrador B, Gómez-Gener L, Zwirnmann E, Sabater S, Marcé R. 2015. Drought-induced discontinuities in the source and degradation of dissolved organic matter in a Mediterranean river. Biogeochemistry. 127:1–15.
- Cole JJ, Pace ML, Carpenter SR, Kitchell JF. 2000. Persistence of net heterotrophy in lakes during nutrient addition and food web manipulations. Limnol Oceanogr. 45:1718–1730. doi: 10.4319/lo.2000.45.8.1718
- Cole JJ, Prairie YT, Caraco NF, McDowell WH, Tranvik LJ, Striegl RG, Duarte CM, Kortelainen P, Downing JA, Middelburg JJ, Melack J. 2007. Plumbing the global carbon cycle: integrating inland waters into the terrestrial carbon budget. Ecosystems. 10:172–185. doi: 10.1007/s10021-006-9013-8
- Crawford JT, Loken LC, Stanley EH, Stets EG, Dornblaser MM, Striegl RG. 2016. Basin scale controls on CO2 and CH4 emissions from the Upper Mississippi River. Geophys Res Lett. 43:1973–1979. doi: 10.1002/2015GL067599
- Crawford JT, Lottig NR, Stanley EH, Walker JF, Hanson PC, Finlay JC, Striegl RG. 2014. CO2 and CH4 emissions from streams in a lake-rich landscape: patterns, controls and regional significance. Glob Biogeochem Cy. 28:197–210. doi: 10.1002/2013GB004661
- Crawford JT, Stanley EH. 2016. Controls on methane concentrations and fluxes in streams draining human-dominated landscapes. Ecol Appl. 26:1581–1591. doi: 10.1890/15-1330
- Deemer B, Harrison J, Li S, Beaulieu JJ, Delsontro T. 2016. Greenhouse gas emissions from reservoir water surfaces: a new global synthesis. Bioscience. 66:949–964. doi: 10.1093/biosci/biw117
- Delsontro T, McGinnis DF, Sobek S, Ostrovsky I, Wehrli B. 2010. Extreme methane emissions from a Swiss hydropower reservoir: contribution from bubbling sediments. Environ Sci Technol. 44:2419–2425. doi: 10.1021/es9031369
- Deshmukh C, Guérin F, Labat D, Pighini S, Vongkhamsao A, Guédant P, Rode W, Godon A, Chanudet V, Descloux S, Serça D. 2015. Low methane (CH4) emissions downstream of a monomictic subtropical hydroelectric reservoir (Nam Theun 2, Lao PDR). Biogeosci Discuss. 12:11313–11347. doi: 10.5194/bgd-12-11313-2015
- Döll P, Fiedler K, Zhang J. 2009. Global-scale analysis of river flow alterations due to water withdrawals and reservoirs. Hydrol Earth Syst Sci Discuss. 6:4773–4812. doi: 10.5194/hessd-6-4773-2009
- Downing JA, Prairie YT, Cole JJ, Duarte CM, Tranvik LJ, Striegl RG, McDowell WH, Kortelainen P, Caraco NF, Melack JM, Middelburg JJ. 2006. Abundance and size distribution of lakes, ponds and impoundments. Limnol Oceanogr. 51:2388–2397. doi: 10.4319/lo.2006.51.5.2388
- Duarte CM, Prairie YT. 2005. Prevalence of heterotrophy and atmospheric CO2 emissions from aquatic ecosystems. Ecosystems. 8:862–870. doi: 10.1007/s10021-005-0177-4
- Fearnside PM, Pueyo S. 2012. Greenhouse-gas emissions from tropical dams. Nat Clim Change. 2:382–384. doi: 10.1038/nclimate1540
- Frankignoulle M. 1988. Field measurements of air-sea CO2 exchange. Limnol Oceanogr. 33:313–322. doi: 10.4319/lo.1988.33.3.0313
- Frissell CA, Liss WJ, Warren CE, Hurley MD. 1986. A hierarchical framework for stream habitat classification: viewing streams in a watershed context. Environ Manage. 10:199–214. doi: 10.1007/BF01867358
- Galy-Lacaux C, Delmas R, Labroue L, Gosse P. 1997. Gaseous emissions and oxygen consumption in hydroelectric dams: a case study in French Guyana. Glob Biogeochem Cy. 11:471–483. doi: 10.1029/97GB01625
- García-Ruiz JM, López-Moreno JI, Vicente-Serrano SM, Lasanta-Martínez T, Beguería S. 2011. Mediterranean water resources in a global change scenario. Earth-Sci Rev. 105:121–139. doi: 10.1016/j.earscirev.2011.01.006
- Giles J. 2006. Methane quashes green credentials of hydropower. Nature. 444:524–525.
- Gómez-Gener L, Obrador B, von Schiller D, Marcé R, Casas-Ruiz JP, Proia L, Acuña V, Catalán N, Muñoz I, Koschorreck M. 2015. Hot spots for carbon emissions from Mediterranean fluvial networks during summer drought. Biogeochemistry. 125:409–426. doi: 10.1007/s10533-015-0139-7
- Gómez-Gener L, von Schiller D, Marcé R, Arroita M, Casas-Ruiz JP, Staehr PA, Acuña V, Sabater S, Obrador B. 2016. Low contribution of internal metabolism to carbon dioxide emissions along lotic and lentic environments of a Mediterranean fluvial network. J Geophys Res-Biogeosci. 121:3030–3044. doi: 10.1002/2016JG003549
- Grill G, Lehner B, Lumsdon AE, MacDonald GK, Zarfl C, Reidy Liermann C. 2015. Dams reshape the world’s rivers. Nature. 517:530.
- Guérin F, Abril G, Richard S, Burban B, Reynouard C, Seyler P, Delmas R. 2006. Methane and carbon dioxide emissions from tropical reservoirs: significance of downstream rivers. Geophys Res Lett. 33:1–6. doi: 10.1029/2006GL027929
- Guérin F, Abril G, Serça D, Delon C, Richard S, Delmas R, Tremblay A, Varfalvy L. 2007. Gas transfer velocities of CO2 and CH4 in a tropical reservoir and its river downstream. J Mar Syst. 66:161–172. doi: 10.1016/j.jmarsys.2006.03.019
- Harrison JA, Maranger RJ, Alexander RB, Giblin AE, Jacinthe PA, Mayorga E, Seitzinger SP, Sobota DJ, Wollheim WM. 2009. The regional and global significance of nitrogen removal in lakes and reservoirs. Biogeochemistry. 93:143–157. doi: 10.1007/s10533-008-9272-x
- Haxton TJ, Findlay CS. 2008. Meta-analysis of the impacts of water management on aquatic communities. Can J Fish Aquat Sci. 65:437–447. doi: 10.1139/f07-175
- Hotchkiss ER, Hall RO, Sponseller R, Butman D, Klaminder J, Laudon H, Rosvall M, Karlsson J. 2015. Sources and control of CO2 emissions change with the size of sreams and rivers. Nat Geosci. 8:696–699. doi: 10.1038/ngeo2507
- Houser JN, Bierman DW, Burdis RM, Soeken-Gittinger LA. 2010. Longitudinal trends and discontinuities in nutrients, chlorophyll, and suspended solids in the Upper Mississippi River: implications for transport, processing, and export by large rivers. Hydrobiologia. 651:127–144. doi: 10.1007/s10750-010-0282-z
- [IPCC] Intergovernmental Panel on Climate Change. 2013. Climate Change 2013: the physical science basis. In: Stocker TF, Qin D, Plattner G-K, Tignor M, Allen SK, et al. editors. Contribution of Working Group I to the Fifth Assessment Report of the Intergovernmental Panel on Climate Change. Cambridge (UK) and New York (NY): Cambridge University Press.
- Jähne B, Münnich K. 1987. On the parameters influencing air-water gas exchange. J Geophys Res Ocean. 92:1937–1942. doi: 10.1029/JC092iC02p01937
- Keller M, Stallard RF. 1994. Methane emission by bubbling from Gatun Lake, Panama. J Geophys Res. 99:8307–8319. doi: 10.1029/92JD02170
- Kemenes A, Forsberg BR, Melack JM. 2007. Methane release below a tropical hydroelectric dam. Geophys Res Lett. 34:1–5. doi: 10.1029/2007GL029479
- Kondolf MG, Batalla RJ. 2005. Chapter 11. Hydrological effects of dams and water diversions on rivers of Mediterranean-climate regions: examples from California. Dev Earth Surf Process. 7:197–211. doi: 10.1016/S0928-2025(05)80017-3
- Lapierre J-F, Guillemette F, Berggren M, Del Giorgio PA. 2013. Increases in terrestrially derived carbon stimulate organic carbon processing and CO2 emissions in boreal aquatic ecosystems. Nat Commun. 4:2972. doi: 10.1038/ncomms3972
- Lehner B, Liermann CR, Revenga C, Vörömsmarty C, Fekete B, Crouzet P, Döll P, Endejan M, Frenken K, Magome J, et al. 2011. High-resolution mapping of the world’s reservoirs and dams for sustainable river-flow management. Front Ecol Environ. 9:494–502. doi: 10.1890/100125
- Lundin EJ, Giesler R, Persson A, Thompson MS, Karlsson J. 2013. Integrating carbon emissions from lakes and streams in a subarctic catchment. J Geophys Res Biogeosciences. 118:1200–1207. doi: 10.1002/jgrg.20092
- Maeck A, Delsontro T, McGinnis DF, Fischer H, Flury S, Schmidt M, Fietzek P, Lorke A. 2013. Sediment trapping by dams creates methane emission hot spots. Environ Sci Technol. 47:8130–8137. doi: 10.1021/es4003907
- Marcé R, Obrador B, Morguí J, Riera JL, López P, Armengol J. 2015. Carbonate weathering as a driver of CO2 supersaturation in lakes. Nat Geosci. 8:107–111. doi: 10.1038/ngeo2341
- McDonald CP, Stets EG, Striegl RG, Butman D. 2013. Inorganic carbon loading as a primary driver of dissolved carbon dioxide concentrations in the lakes and reservoirs of the contiguous United States. Glob Biogeochem Cy. 27:285–295. doi: 10.1002/gbc.20032
- Millero F. 1995. Thermodynamics of the carbon dioxide system in the oceans. Geochim Cosmochim Acta. 59:661–677. doi: 10.1016/0016-7037(94)00354-O
- Montgomery DR. 1999. Process domains and the river continuum. J Am Water Resour Assoc. 35:397–410. doi: 10.1111/j.1752-1688.1999.tb03598.x
- Nilsson C, Reidy CA, Dynesius M, Revenga C. 2005. Fragmentation and flow regulation of the world’s large river systems. 308:405–408.
- Oksanen J, Guillaume Blanchet F, Kindt R, Legendre P, Minchin PR, O’Hara RB, Simpson GL, Solymos P, Stevens MHH, Wagner H. 2015. Vegan: community ecology package. R Package version 2.2-1. http://CRAN.R-project.org/package=vegan
- Pavón D. 2010. Desarrollo y decadencia hidroeléctrica en los pequeños ríos del litoral mediterráneo catalán. El caso de las cuencas del Fluvià y de la Muga [Development and hydroelectric decadence in the small rivers of the Catalan Mediterranean coast. The case of the Fluvià and Muga basins]. Rev Hist Ind. 42:43–87.
- Ponsatí L, Acuña V, Aristi I, García-Berthou E, von Schiller D, Elosegi A, Sabater S. 2015. Biofilm responses to flow regulation by dams in Mediterranean rivers. River Res Appl. 31:1003–1016. doi: 10.1002/rra.2807
- Proia L, von Schiller D, Gutierrez C, Casas-Ruiz JP, Gómez-Gener L, Marcé R, Obrador B, Acuña V, Sabater S. 2016. Microbial carbon processing along a river discontinuum. Freshwater Sci. 35:1133–1147. doi: 10.1086/689181
- Raymond PA, Hartmann J, Lauerwald R, Sobek S, McDonald C, Hoover M, Butman D, Striegl R, Mayorga E, Humborg C, et al. 2013. Global carbon dioxide emissions from inland waters. Nature. 503:355–359. doi: 10.1038/nature12760
- Raymond PA, Zappa CJ, Butman D, Bott TL, Potter J, Mulholland P, Laursen AE, McDowell WH, Newbold D. 2012. Scaling the gas transfer velocity and hydraulic geometry in streams and small rivers. Limnol Oceanogr-Fluids Environ. 2:41–53. doi: 10.1215/21573689-1597669
- Sobek S, DelSontro T, Wongfun N, Wehrli B. 2012. Extreme organic carbon burial fuels intense methane bubbling in a temperate reservoir. Geophys Res Lett. 39:2–5. doi: 10.1029/2011GL050144
- Stanford JA, Ward J V. 2001. Revisiting the serial discontinuity concept. Regul Riv-Res Manage. 17:303–310. doi: 10.1002/rrr.659
- Stanley EH, Casson NJ, Christel ST, Crawford JT, Loken LC, Oliver SK. 2016. The ecology of methane in streams and rivers: patterns, controls, and global significance. Ecol Monogr. 86:146–171. doi: 10.1890/15-1027
- Stets EG, Striegl RG, Aiken GR, Rosenberry DO, Winter TC. 2009. Hydrologic support of carbon dioxide flux revealed by whole-lake carbon budgets. J Geophys Res Biogeosciences. 114:1–14. doi: 10.1029/2008JG000783
- St. Louis VL, Kelly CA, Duchemin É, Rudd JWM, Rosenberg DM. 2000. Reservoir surfaces as sources of greenhouse gases to the atmosphere: a global estimate. Bioscience. 50:766. doi: 10.1641/0006-3568(2000)050[0766:RSASOG]2.0.CO;2
- Striegl RG, Dornblaser MM, McDonald CP, Rover JR, Stets EG. 2012. Carbon dioxide and methane emissions from the Yukon River system. Glob Biogeochem Cy. 26:GB0E05.
- Syvitski J, Vörösmarty C, Kettner AJ, Green P. 2005. Impact of humans on the flux of terrestrial sediment to the global coastal ocean. Science. 308:376–380. doi: 10.1126/science.1109454
- Teodoru CR, Prairie YT, del Giorgio PA. 2010. Spatial heterogeneity of surface CO2 fluxes in a newly created Eastmain-1 reservoir in northern Quebec, Canada. Ecosystems. 14:28–46. doi: 10.1007/s10021-010-9393-7
- Thorp JH, Thoms MC, Delong MD. 2006. The riverine ecosystem synthesis: biocomplexity in river networks across space and time. River Res Appl. 22:123–147. doi: 10.1002/rra.901
- Tranvik L, Downing J, Cotner J. 2009. Lakes and reservoirs as regulators of carbon cycling and climate. Limnol Oceangr. 54:2298–2314. doi: 10.4319/lo.2009.54.6_part_2.2298
- Vannote RL, Minshall GW, Cummins KW, Sedell JR, Cushing CE. 1980. The river continuum concept. Can J Fish Aquat Sci. 37:130–137. doi: 10.1139/f80-017
- von Schiller D, Aristi I, Ponsatí L, Arroita M, Acuña V, Elosegi A, Sabater S. 2015. Regulation causes nitrogen cycling discontinuities in Mediterranean rivers. Sci Total Environ. 540:168–177. doi: 10.1016/j.scitotenv.2015.07.017
- Wanninkhof R. 1992. Relationship between wind speed and gas exchange over the ocean. J Geophys Res Ocean. 97:7373–7382. doi: 10.1029/92JC00188
- Ward JV, Stanford JA. 1983. Serial discontinuity concept of lotic ecosystems. In: Fontain TD, Bartell SM, editors. Dynamics of Lotic Ecosystems. Ann Arbor (MI): Ann Arbor Sci; p. 29–42.
- Wehrli B. 2013. Conduits of the carbon cycle. Nature. 503:9–10. doi: 10.1038/503346a
- Weiss R. 1974. Carbon dioxide in water and seawater: the solubility of a non-ideal gas. Mar Chem. 2:203–215. doi: 10.1016/0304-4203(74)90015-2
- Wetzel RG. 2001. Limnology—lake and river ecosystems. San Diego (CA): Academic.
- Winemiller KO, Flecker AS, Hoeinghaus DJ. 2010. Patch dynamics and environmental heterogeneity in lotic ecosystems. J N Am Benthol Soc. 29:84–99. doi: 10.1899/08-048.1
- Wold S, Sjöström M, Eriksson L. 2001. PLS-regression: a basic tool of chemometrics. Chemom Intell Lab Syst. 58:109–130. doi: 10.1016/S0169-7439(01)00155-1