
ABSTRACT
Taxonomic and functional patterns of macroinvertebrate communities were investigated to reveal the importance of different habitat units within a marsh system in maintaining its macroinvertebrate diversity. Hydrogeomorphic units based on their functional characteristics were used to distinguish 3 types of aquatic habitats within the marsh system: (1) Core Unit (CU), a permanent inundation of a wetland in the central position of a marsh system; (2) Transitional Unit (TU), a seasonal to intermittent inundation of a wetland, with seasonal saturation; and (3) Satellite Unit (SU), seasonal depression wetlands with ephemeral to intermittent saturation. We hypothesized that communities in each Unit would have specific taxonomic and functional features. Species richness was highest in the TU, with unique community composition in the SU, and moderately high species richness characterized by a stable community with high taxonomic distinctness in the CU. The metacommunity of the entire marsh was nearly random with a substantial equilibrium between beta-diversity features: replacement and dissimilarity. Our results suggest that the combination of directly connected or isolated waterbodies in close proximity to a large core waterbody is likely to maintain the highest level of diversity. Each Unit has unique characteristics and provides habitats for species with different ecological traits; thus, different aquatic habitats of a marsh system should be considered together as one meaningful ecological entity.
Introduction
Inland wetlands are important landscape features that substantially contribute to regional biodiversity (Biggs et al. Citation2005, Scheffer et al. Citation2006, Thiere et al. Citation2009). The ecological and conservational roles of these wetlands are crucial because they often host rare, protected, and endemic species (Oertli et al. Citation2005, Nicolet et al. Citation2007, Davies et al. Citation2008, Downing Citation2010, De Marco et al. Citation2014) and could be viewed as biodiversity hotspots within the landscape (Céréginho et al. Citation2014).
The continuously changing boundaries of marshes create a unique landscape structure characterized by a core habitat surrounded by further dispersed aquatic habitats. The composition and structure of macroinvertebrate communities are determined by both the characteristics of the available habitats and the functional traits of the species. Little is known, however, about the underlying processes and relationships within marsh systems. In addition to the importance of large core habitats (major open water habitat), the significance of smaller adjacent habitats has also been recognized (European Pond Conservation Network Citation2015). Nevertheless, the biodiversity of these adjacent habitats has been separately studied in most cases (Boix et al. Citation2001, Williams et al. Citation2001); thus, our knowledge of their contributions to the species richness of the freshwater marsh system as a whole is limited (Martínez-Sanz et al. Citation2012).
The shallow nature and relatively small size of marshes usually create a large littoral zone, providing diverse habitats for macroinvertebrates with low densities of vertebrate predators (Wood et al. Citation2001, Søndergaard et al. Citation2005). Aquatic macroinvertebrates have a wide range of environmental preferences and represent a diverse group that integrates ecosystem changes over time. Moreover, they are frequently used in biodiversity studies because of their high taxonomic heterogeneity. Even though the characteristics of a macroinvertebrate community can be described by diversity metrics, the functional composition (i.e., the proportion of different traits) may give more powerful insight into processes that generate diversity patterns. Therefore, simultaneously considering both taxonomic and functional viewpoints provides an opportunity to better understand the structure and function of a permanent freshwater marsh ecosystem (Statzner et al. Citation2004, Gallardo et al. Citation2011, Sartori et al. Citation2015)
A crucial step toward effective conservation of a complex marsh ecosystem is to have relevant knowledge on the biota (including macroinvertebrates), of not only the core but also of related habitats. Both scientific studies and management activities need to focus on all aquatic patches in the landscape and, in turn, identify and understand the linkages between them (Sayer Citation2014). Here we provide a broad view of species richness, taxonomic distinctness, and trait characteristics among macroinvertebrate communities of a marsh system. We presumed that, in addition to the core habitat, related habitats would also have unique communities with specific taxonomic and functional features. We conclude by highlighting the importance of related satellite habitats and their remarkable contributions to the high biodiversity and great value of the marsh ecosystem as a whole.
Materials and methods
Description and characterization of the study area
The Biharugra marsh system is located in the Kis-Sárrét, one of the most diversified and valuable areas of the Körös–Maros National Park in southeast Hungary. Before the 20th century, the Kis-Sárrét was regularly flooded by water from the Körös River, forming a huge marshland that decreased in size because of channelization activities of the 1860s. Thus, the remaining marsh patches are an endangered remnant of the primeval landscape with high conservation value.
The Biharugra marsh system, including the surrounding aquatic habitats, covers ∼1.5 km2 (47°33′29″N, 20°55′29″E; 10 × 10 km UTM grid code: ET 40; ). It lies in a semiarid–semihumid climatic region where the average annual air temperature is 10–11 °C and the average annual precipitation is 520–550 mm, most of which occurs in spring and autumn. The Biharugra marsh system is a permanent freshwater marsh based on the Ramsar Classification System published by Ramsar Convention Secretariat (Citation2013).
Figure 1. Orthophoto of the Biharugra marsh system (top). The red dot in the inset marks the location of the study site in Hungary. Schematic map of the study site (middle) with unit types: Satellite Unit (green), Transitional Unit (blue), and Core Unit (red). The schematic vertical section of the Biharugra marsh system (bottom) with the hydrologic and hydraulic connections between the Units.
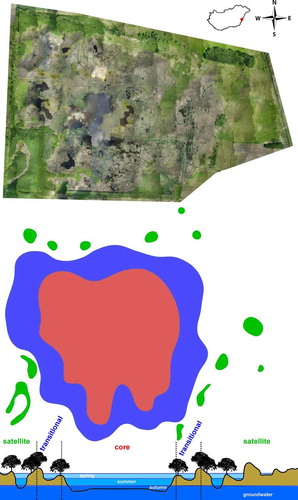
Hydrogeomorphic units based on their functional characteristics were used to distinguish 3 types of aquatic habitats within the marsh system: (1) Core Unit (CU), a permanent inundation of a wetland in the central position of the Biharugra marsh system; (2) Transitional Unit (TU), a seasonal to intermittent inundation of a wetland, with seasonal saturation; and (3) Satellite Unit (SU), seasonal depression wetlands with seasonal to intermittent saturation. Although the hydrologic and hydraulic connections via groundwater are more or less permanent among the 3 Units, only the CU and TU are connected for at least 2 months of the year via surface water and are separated from the SU.
The CU has relatively stable hydrologic features, has a water depth between 30 and 100 cm, and is characterized by diverse and extremely patchy vegetation (i.e., Phragmites australis, Ceratophyllum spp., Lemna spp., Typha spp., Trapa natans, Stratiotes aloides, and Hydrocharis morsus-ranae) and relatively large open-water areas (a single large and several smaller bodies of water, together covering >8 ha). During the sampling period, the water level of the CU was not constant, but it never dried because of repeated rainfalls of varying intensity, artificial inundation, and water retention. The TU, which includes habitats located between the permanently wet and dry zones of the marsh system (e.g., shallow ditches with macrophytes alongside the marsh, dystrophic puddles under alder tree groves, overflow ditches with macrophytes, willow shrubs near the shoreline, alder swamps, small ponds, and residual shoreline puddles), is directly connected to the CU via surface water for at least 2 months of the year. The SU includes isolated and discrete intermittent wet habitats (e.g., temporary ponds, puddles, temporary alder swamps, and older drying oxbows), which were never connected to the CU via surface water.
Sampling methods
Faunistic sampling was conducted during spring (24–27 Mar 2012), summer (30 Jul to 1 Aug 2012) and autumn (20–21 Oct 2012) at 42 sampling sites across the 3 Units (CU: 15; TU: 14; SU: 13). Samples were collected by sweeping 3 × 10 times per sampling site by 3 people with standard pond nets (mesh sizes of 250 and 500 μm). Thus, one sample consisted of 30 net sweepings from all available habitat types of the sampling site: the open water column, the surface and the upper layer of the sediment, and the edge and middle of the vegetation beds. Distribution of the number of sweeps among habitats was approximately the same as the spatial proportion of the open and vegetated habitats. Macroinvertebrates were picked directly from the nets (fast-moving insects), and trays were also used for a thorough inspection of the sample to collect further invertebrates, including those associated with collected aquatic vegetation. During this process we tried to gather all morphotypes in sufficient numbers to record all species from the site. Together, the sampling procedure (sweeping and sorting) was conducted for a 3 × 30 min parallel for 3 people at each sampling site.
Statistical analysis
We used Hill numbers to quantify taxonomic diversity of an assemblage and to compare diversity among sampling Units. Hill numbers are parameterized by a diversity order q, which determines the sensitivity of the measure to the relative abundance of the species. In our study, because only taxonomic samples were taken, species richness (q = 0) was used. Hill numbers have important features as they fulfil the replication principle or doubling property, which means if 2 completely distinct assemblages have identical Hill numbers of order q, then the Hill number of the same order doubles if the 2 assemblages are combined (Chao et al. Citation2014). Species accumulation curves and richness estimates (Chao 2) were made using iNEXT: an R package for the rarefaction and extrapolation of species diversity and for transforming raw incidence data into incidence frequencies (Hsieh et al. Citation2015).
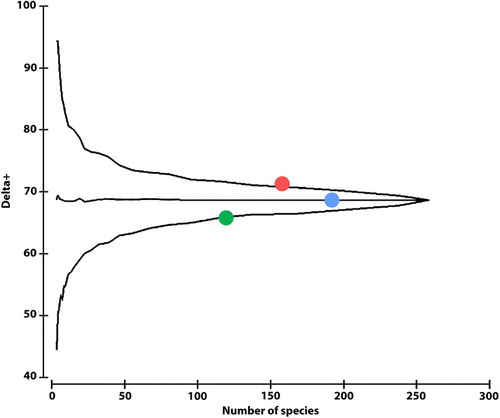
We compared the composition of species among Units using nonmetric multidimensional scaling (NMDS). Two sampling sites from the CU (CU_23, CU_32) and TU (TU_13, TU_42) were excluded from statistical analyses to avoid statistical artefacts that arise when very small numbers of species are used (n < 10). The dissimilarity of composition based on presence–absence data was quantified using the Jaccard index (Legendre and Legendre Citation1998). We used average taxonomic distinctness (delta+; i.e., the average taxonomic distance between all pairs of species) to describe the diversity of the Units. This measure is a useful tool for studying and comparing macroinvertebrate communities regardless of sample size and, to a lesser degree, the type of sampling method used (Clarke and Warwick Citation1998, Warwick and Clarke Citation1998, Baños-Picón et al. Citation2009). In addition, we calculated delta+ for each Unit based on the pooled species lists of CU, TU, and SU. The results were displayed in funnel plots, where the mean delta+ and 95% probability limits were calculated based on 999 random selections for each number of species from the total species list. To calculate taxonomic distinctness, we used the PRIMER v6 software (Clarke and Gorley Citation2006).
To evaluate the relative importance of beta-diversity, nestedness, and agreement in species richness in species composition of the Units, SDR simplex analysis was performed using MATLAB software based on the work of Podani and Schmera (Citation2011). To assess for differences in functional composition of macroinvertebrate communities of the Units, the following, presumably most relevant, traits were analyzed: life duration, number of generations per year, microhabitat/substrate preference, habitat type preference, feeding type, and locomotion type. Information from the freshwaterecology.com trait database (Schmidt-Kloiber and Hering Citation2015) was used for each species. The number of taxa that presented a certain trait was multiplied by the trait sensitivity according to the protocol by Hering et al. (Citation2009). To test species richness and trait-based compositions, analysis of variance (ANOVA) and Tukey honest significant difference (HSD) post hoc tests were used.
Results
We collected 5337 macroinvertebrates representing 259 taxa during sampling (detailed faunistic records can be found in Csabai et al. Citation2015). Of these, 8 species recorded from the marsh system are protected in Hungary and are listed on the International Union for Conservation of Nature (IUCN) Red List or are marked in the Convention on International Trade in Endangered Species of Wild Fauna and Flora (CITES) or in the Bern Convention on the Conservation of European Wildlife and Natural Habitats (for details see Csabai et al. Citation2015).
The highest number of taxa was found in TU (197), the lowest number in SU (122), and an intermediate number in CU (166). Moreover, CU and TU had the highest number of common species (41), whereas only 3 species occurred in both CU and SU. Nearly one-third of the species (29.7%) were found in all 3 Units, one-fourth (24.3%) were collected from only 2 Units, and almost half of the taxa (49.4%) exclusively inhabited a single Unit (). The estimated number of species was considerably higher than the number observed in each Unit and in the entire marsh system using the Chao estimator (). The species accumulation curves of each Unit showed monotonic increases (), indicating that the estimated species richness would likely be considerably higher than the observed level of richness; however, the observed numbers are comparable to each other as estimated numbers. The NMDS ordination () revealed a considerable overlap between species composition of the CU and TU; however, the variance in the TU was considerably higher than in the CU. Species composition of SU was different from compositions of the other Units.
Figure 2. Venn diagram showing the numbers of unique, common, and total number of species for the 3 Units. The common subset refers to the common species among Units.
Figure 3. Species accumulation curves for each Unit (red: Core Unit; blue: Transitional Unit; green: Satellite Unit). Monotonic increases of each curve confirms that estimated species richness might be considerably higher than observed richness.
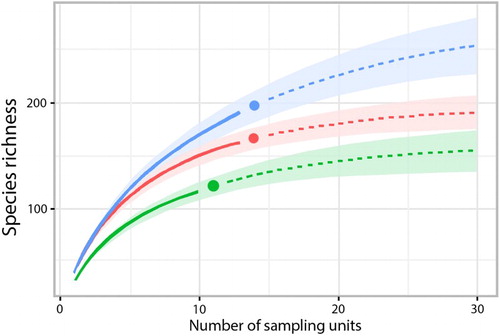
Figure 4. NMDS ordination plot of species composition in each Unit (Jaccard index, final stress = 0.1672). Red: Core Unit; blue: Transitional Unit; green: Satellite Unit. The Transitional Unit shows a much higher variance, almost completely involving the more compact convex hull of the core sites; whereas the Satellite Area has the most different faunal composition.
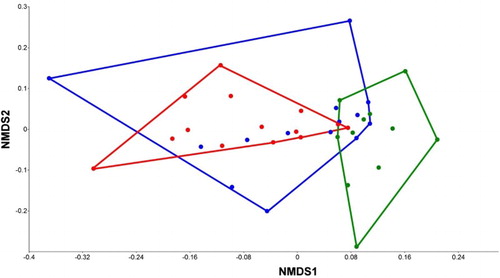
Table 1. Observed and estimated number of species using Chao 2 species richness estimator.
Based on the pooled species lists, the highest delta+ was observed in the CU (Δ+ = 71.16), whereas the lowest value was in the SU (Δ+ = 65.66). The values significantly (CU, p = 0.026) or marginally significantly (SU, p = 0.068) differed from the mean; however, they were close to the upper and lower 95% limits, respectively. The delta+ value for the TU (Δ+ = 68.60, p = 0.917) was close to the mean value (Δ+ = 68.80; ).
Figure 5. Taxonomic distinctness analyses of species composition of Units (all sampling sites were pooled for each Unit type). The Core Unit community is taxonomically more robust than in the other Units and had a higher delta+ than the average value. The Unit values did not significantly differ from the mean. Red: Core Unit; blue: Transitional Unit; green: Satellite Unit.
The metacommunity of the entire marsh (CU + TU + SU) is nearly random, with a substantial equilibrium between beta-diversity features such as replacement (R) and dissimilarity (D). When considering the Units individually, however, R was the most important component in the CU (R = 41.80) and TU (R = 58.76), while D was highest in SU (D = 43.46), and similarity (S) was the least important component in all cases, never exceeding 19% (). In pairwise comparisons, R was always the most important component, ranging from 44% to 51%, and remained as such when all sites from all 3 Units were analyzed together (49%). However, the macroinvertebrate communities of Units were not nested within one another ().
Figure 6. SDR-simplex plots of macroinvertebrate communities in each Unit (Core [CU], Transitional [TU], and Satellite [SU]). The metacommunity of the whole marsh (CU + TU + SU) is nearly random with a substantial equilibrium between beta-diversity features, such as replacement (R) and dissimilarity (D).
![Figure 6. SDR-simplex plots of macroinvertebrate communities in each Unit (Core [CU], Transitional [TU], and Satellite [SU]). The metacommunity of the whole marsh (CU + TU + SU) is nearly random with a substantial equilibrium between beta-diversity features, such as replacement (R) and dissimilarity (D).](/cms/asset/d573f263-d293-4e57-b9a6-a266d17e58f1/tinw_a_1461969_f0006_c.jpg)
Table 2. Results of the SDR simplex analysis. Mean scores of the measured similarity (S), richness difference (D), species replacement (R), beta diversity, and richness agreement among the individual sampling sites in the different Units (CU: Core Unit, TU: Transitional Unit, SU: Satellite Unit).
The mean plots of the trait-based analyses showed the number or proportions of each trait for each Unit (). Total number of species was not different among the 3 Units (a; ANOVA: F = 1.8154, p = 0.1763). The ratio of predators to nonpredators in the CU (b; ANOVA: F = 12.6912, p = 0.00006; Tukey HSD: CU vs. TU: p = 0.000282, CU vs. SU: p = 0.003591) was significantly higher than in the other Units, as was the number of passive dispersers (d; ANOVA: F = 10.3421, p = 0.0003; Tukey HSD: CU vs. TU: p = 0.016391, CU vs. SU: p = 0.000340). No differences were found among Units in the number of active dispersers (c; ANOVA: F = 0.9994, p = 0.3773). The proportion of taxa with short larval development (<1 yr) was lower in SU than in other Units (e; ANOVA: F = 6.6527, p = 0.0033; Tukey HSD: CU vs. SU: p = 0.010468, TU vs. SU: p = 0.006879), whereas the number of taxa with long larval development was highest, but not significantly, in the CU (f; ANOVA: F = 3.1379, p = 0.0545). No significant differences were found in either long-life taxa (<1 generation per year) or short-life taxa (>1 generation per year) between Units (g; ANOVA: F = 3.888, p = 0.0288; H; ANOVA: F = 0.242, p = 0.7862).
Figure 7. Traits of macroinvertebrates in each Unit. Different letters denote statistical significance (P ≤ 0.05), error bars represent standard error.
Discussion
The Biharugra marsh system deserves serious conservation attention because of its high species diversity and the presence of protected species. The species composition of macroinvertebrates was also characterized by a combination of typical lowland marshland species and acidophilic bog-dwelling taxa (for details see Csabai et al. Citation2015), which highlights the conservation importance of this system in providing a heterogeneous habitat complex for macroinvertebrates.
Our results suggest that the CU community is taxonomically robust (with a higher delta+) and more diverse than the TU and SU communities. Community characteristics suggest an advanced successional stage, most likely due to the relatively stable environment and competitive exclusion of species by the more competitive species (Ruhí et al. Citation2012). Species richness, however, was highest in the TU, where the diverse community of permanent residents that survive dry periods by aestivating in different life stages is seasonally invaded during wet periods by ephemeral residents with good dispersal capability and rapid larval development, adding new species to the community (Jocqué et al. Citation2007). Additionally, during occasional dry periods, a number of taxa leave the TU and most likely migrate to the CU where conditions are more stable, as suggested by the high number of common taxa in these Units. This information highlights the importance of the hydrologic connection between the CU and TU. If the hydroperiod is long enough, the regional fauna can recolonize TU habitats (Schneider and Frost Citation1996, Jeffries Citation2011), although the TU community is taxonomically less robust than the CU community. The disturbance caused by the periodically changing water levels in the TU might not necessarily lead to a reduction in species richness, but rather might decrease the taxonomic distinctness (Warwick and Clarke Citation1998). The SU had the lowest number of species and taxonomic distinctness, most likely due to the temporary nature of these habitats. Spencer et al. (Citation1999) found that species richness is higher in more permanent pools.
The group of species in the SU is not a subset of the more species-rich communities of the CU and TU. The CU and TU have overlapping species composition, whereas community structure of the SU is notably different from the other 2 Units ( and 6), consisting of a large number of species that can survive the rapidly changing environment because of their life cycles or dispersal strategies (Porst et al. Citation2012). Thus, the SU contributes substantially to species richness of the entire marsh system. From a conservation perspective, if the biota is not highly nested among Units, as shown by SDR simplex analysis in this study (), several small habitat patches tend to maximize the number of species in a given area (Ovaskainen Citation2002). The diverse community in the CU is associated with high ecosystem function (Hooper et al. Citation2005, Ruhi et al. Citation2012). Most of the species living in this Unit are univoltine taxa with larval development >1 year. These K-selected species can take advantage of stable or more predictable environments (i.e., CU) because they successfully compete for limited resources (Miguel-Chincilla et al. Citation2014). As a result, a more complex food web can evolve with a higher proportion of predators (b; Spencer et al. Citation1999). The high lateral connectivity of TU and CU between dry seasons may facilitate the movement and exchange of taxa between the Units (Karaus Citation2004), resulting in high similarity of their aquatic macroinvertebrate communities (). However, the number of species with traits characteristic to the CU is low in the TU, with a significantly lower proportion of predators (e.g., predators with longer life cycles, such as Anisoptera, were absent in TU). TU aquatic habitats are intermittent because of the dry period, and thus a less complex food web develops (Bilton et al. Citation2001). The community in the SU contains a high number of multivoltine species with larval development times <1 year and has the lowest proportion of passive dispersers (d). The lack of water connectivity between the Units is a major barrier to passive dispersers that must rely on various vectors to reach this satellite habitat (Bilton et al. Citation2001). By contrast, active dispersers can move among relatively close patches (c). The low proportion of predators suggests that, similar to the TU, a complex food web could not develop in the SU because of the relatively long dry periods (Schneider and Frost Citation1996, Schneider Citation1997).
Management planning for nature conservation sites has a number of aims, including maximizing the number of species that survive, the number of currently occurring species, the time to extirpation, and maximizing the metapopulation capacity. This latter aim corresponds with maximizing the occupied habitat and is related to maximizing the abundance of the species (based on Hanski and Ovaskainen Citation2000, Ovaskainen Citation2002). In our study, the CU, TU, and SU were equally important from a conservation perspective, but in different ways. The highest species richness was in the TU; the SU had a clear unique species composition; and the CU supported a moderately high number of species and a stable community with high taxonomic distinctness. Directly connected (as TU) or isolated (as SU) surface waters with a large core (as CU) waterbody might maintain higher diversity than the Units, respectively (i.e., the whole is more than the sum of its parts). Moreover, the different “parts” provide habitats for species with different ecological traits. Here we provide evidence for the importance of non-core habitat patches and provide evidence that marsh ecosystems must be viewed more holistically. Permanent or slightly changing water levels are needed during conservation activities to ensure the integrity of CU waterbodies, and efforts should also focus on maintaining the TU and SU habitats.
Similarities and differences in taxonomic and functional composition of the communities show how the different units contribute to a high biodiversity; all of the parts have special roles, hosting differently composed macroinvertebrate assemblages and functioning in more or less different ways. Accordingly, all of the aquatic habitats of a marsh system should be considered together as one meaningful ecological entity during implementation of a conservation program.
Acknowledgements
Many thanks to Tibor Danyik (Körös-Maros National Park) and Endre Bajka (MTA Centre for Ecological Research, Hungary) for their extensive help during the field work. We also thank Erika Bódis (MTA Centre for Ecological Research), Csaba Deák, Zoltán Kálmán, and Péter Mauchart (University of Pécs, Department of Hydrobiology, Hungary) for their identification work and Éva Horváth-Tihanyi (University of Pécs, Department of Hydrobiology) for the laboratory assistance. Pál Boda is grateful for the support by GINOP-2.3.2-15-2016-00019 project. Zoltán Csabai was supported by EU-funded project no. EFOP-3.6.1.-16-2016-00004 and by the Higher Education Institutional Excellence Programme of the Ministry of Human Capacities in Hungary, within the framework of the 20765-3/2018/FEKUTSTRAT “Innovation for sustainable and healthy living and environment” thematic programme of the University of Pécs. Thanks also for the valuable and constructive comments of anonymous reviwers and associate editor.
ORCID
Pál Boda http://orcid.org/0000-0001-5907-3472
Gábor Várbíró http://orcid.org/0000-0002-1825-5744
Zoltán Csabai http://orcid.org/0000-0003-1700-2574
Additional information
Funding
References
- Baños-Picón L, Asís JD, Gayubo SF, Tormos J. 2009. Analyzing insect community structure through the application of taxonomic distinctness measures. Zool Stud. 48:298–314.
- Biggs J, Williams P, Whitfield M, Nicolet P, Weatherby A. 2005. 15 years of pond assessment in Britain: results and lesson learned from the work of pond conservation. Aquat Conserv. 15:693–714. doi: 10.1002/aqc.745
- Bilton DT, Freeland, JR, Okamura B. 2001. Dispersal in freshwater invertebrates. Annu Rev Ecol Evol S. 32:159–181. doi: 10.1146/annurev.ecolsys.32.081501.114016
- Boix D, Sala J, Moreno-Amichi R. 2001. The faunal composition of Espolla pond (NE Iberian Peninsula): the neglected biodiversity of temporary waters. Wetlands. 21:577–592. doi: 10.1672/0277-5212(2001)021[0577:TFCOEP]2.0.CO;2
- Céréginho R, Boix D, Cauchie H-M, Martens K, Oertli B. 2014. The ecological role of ponds in changing world. Hydrobiologia. 723:1–6. doi: 10.1007/s10750-013-1719-y
- Chao A, Gotelli NJ, Hsieh TC, Sander EL, Ma KH, Colwell RK, Ellison AM. 2014. Rarefaction and extrapolation with Hill numbers: a framework for sampling and estimation in species diversity studies. Ecol Monogr. 84:45–67. doi: 10.1890/13-0133.1
- Clarke KR, Gorley RN. 2006. PRIMER v6: User manual/tutorial. - PRIMER-E, Plymouth.
- Clarke KR, Warwick MR. 1998. A taxonomic distinctness index and its statistical properties. J Appl Ecol. 35:523–531.
- Csabai Z, Boda P, Boda R, Bódis E, Danyik T, Deák Cs, Farkas A, Kálmán Z, Lőkkös A, Málnás K, et al. 2015. Aquatic macroinvertebrate fauna of the Kis-Sárrét Nature Protection Area with first records of five species from Hungary. Acta Biol Debrecina. 33:9–70.
- Davies B, Biggs J, Williams P, Whitfield M, Nicolet P, Sear D, Bray S, Maund S. 2008. Comparative biodiversity of aquatic habitats in the European agricultural landscape. Agr Ecosyst Environ. 125:1–8. doi: 10.1016/j.agee.2007.10.006
- De Marco P, Nogueira DS, Correa CC, Vieira TB, Silva KD, Pinto NS, Bichsel D, Hirota ASV, Vieira RRS, Carneiro FM, et al. 2014. Patterns in the organization of Cerrado pond biodiversity in Brazilian pasture landscapes. Hydrobiologia. 723:87–101. doi: 10.1007/s10750-013-1695-2
- Downing JA 2010. Emerging global role of small lakes and ponds: little things mean a lot. Limnetica. 29:9–24.
- European Pond Conservation Network. 2015. http://www.europeanponds.org/
- Gallardo B, Gascón S, Quintana X, Comín F. 2011. How to choose a biodiversity indicator - Redundancy and complementarity of biodiversity metrics in a freshwater ecosystem. Ecol Ind. 11:1177-1184. doi: 10.1016/j.ecolind.2010.12.019
- Hanski I, Ovaskainen O. 2000. The metapopulation capacity of a fragmented landscape. Nature. 404:755–758. doi: 10.1038/35008063
- Hering D, Schmidt-Kloiber A, Murphy J, Lücke S, Zamora-Munoz C, López-Rodríguez MJ, Huber T, Graf W. 2009. Potential impact of climate change on aquatic insects: a sensitivity analysis for European caddisflies (Trichoptera) based on distribution patterns and ecological preferences. Aquat Sci. 71:3–14. doi: 10.1007/s00027-009-9159-5
- Hooper DU, Chapin FS, Ewel JJ, Hector A, Inchausti P, Lavorel S, Lawton JH, Lodge DM, Loreau M, Naeem S, et al. 2005. Effects of biodiversity on ecosystem functioning: a consensus of current knowledge. Ecol Monogr. 75:3–35. doi: 10.1890/04-0922
- Hsieh TC, Ma KH, Chao A. 2015. iNEXT: an R package for interpolation and extrapolation of species diversity (Hill numbers). Methods Ecol Evol. 7:1451–1456. doi: 10.1111/2041-210X.12613
- Jeffries M. 2011. The temporal dynamics of temporary pond macroinvertebrate communities over a 10-year period. Hydrobiologia. 661:391–405. doi: 10.1007/s10750-010-0551-x
- Jocqué M, Riddoch BJ, Brendonck L. 2007. Successional phases and species replacements in freshwater rock pools: towards a biological definition of ephemeral systems. Freshwater Biol. 52:1734–1744. doi: 10.1111/j.1365-2427.2007.01802.x
- Karaus U. 2004. The ecology of lateral aquatic habitats along river corridors [dissertation]. Heidelberg (Germany): University of Heidelberg.
- Legendre P, Legendre L. 1998. Numerical ecology, 2nd English edition. Amsterdam (Netherlands): Elsevier Science BV.
- Martínez-Sanz C, Cenzano CSS, Fernández-Aláez M, García-Criado F. 2012. Relative contribution of small mountain ponds to regional richness of littoral macroinvertebrates and the implications for conservation. Aquat Conserv. 22:155–164. doi: 10.1002/aqc.2227
- Miguel-Chinchilla L, Boix D, Gascón S, Comín FA. 2014. Taxonomic and functional successional patterns in macroinvertebrates related to flying dispersal abilities: a case study from isolated manmade ponds at reclaimed opencast coal mines. Hydrobiologia. 732:111–122. doi: 10.1007/s10750-014-1851-3
- Nicolet P, Ruggiero A, Biggs J. 2007. Second European pond workshop: conservation of pond biodiversity in a changing European landscape. Ann Limnol. 43:77–80. doi: 10.1051/limn/2007019
- Oertli B, Biggs J, Céréghino R, Grillas P, Joly P, Lachavanne JB. 2005. Conservation and monitoring of pond biodiversity: introduction. Aquat Conserv. 15:535–540. doi: 10.1002/aqc.752
- Ovaskainen O. 2002. Long-term persistence of species and the SLOSS problem. J Theor Biol. 218:419–433. doi: 10.1016/S0022-5193(02)93089-4
- Podani J, Schmera D. 2011. A new conceptual and methodological framework for exploring and explaining pattern in presence-absence data. Oikos. 120:1625–1638. doi: 10.1111/j.1600-0706.2011.19451.x
- Porst G, Naughton O, Gill L, Johnston P, Irvine K. 2012. Adaptation, phenology and disturbance of macroinvertebrates in temporary water bodies. Hydrobiologia. 696:47–62. doi: 10.1007/s10750-012-1181-2
- Ramsar Convention Secretariat. 2013. The Ramsar Convention manual: a guide to the Convention on Wetlands (Ramsar, Iran, 1971), 6th ed. Gland (Switzerland): Ramsar Convention Secretariat.
- Ruhí A, Herrmann J, Gascón S, Sala J, Geijer J, Boix D. 2012. Change in biological traits and community structure of macroinvertebrates through primary succession in a man-made Swedish wetland. Freshwater Sci. 31:22–37. doi: 10.1899/11-018.1
- Sartori L, Canobbio S, Cabrini R, Fornaroli R, Mezzanotte V. 2015. Macroinvertebrate assemblages and biodiversity levels: ecological role of constructed wetlands and artificial ponds in a natural park. J Limnol. 74:335–345.
- Sayer CD. 2014. Conservation of aquatic landscapes: ponds, lakes, and rivers as integrated systems. WIREs Water. 1:573–585. doi: 10.1002/wat2.1045
- Scheffer M, van Geest GJ, Zimmer K, Jeppesen E, Søndergaard M, Butler MG, Hanson MA, Declerck S, De Meester L. 2006. Small habitat size and isolation can promote species richness: second order effects on biodiversity in shallow lakes and ponds. Oikos. 112:227–231. doi: 10.1111/j.0030-1299.2006.14145.x
- Schmidt-Kloiber A, Hering. D 2015. www.freshwaterecology.info - an online tool that unifies, standardises and codifies more than 20,000 European freshwater organisms and their ecological preferences. Ecol Indic. 53:271–282.
- Schneider DW. 1997. Predation and food web structure along a habitat duration gradient. Oecologia, 110:567–575. doi: 10.1007/s004420050197
- Schneider DW, Frost TM. 1996. Habitat duration and community structure in temporary ponds. J N Am Benthol Soc. 15:64–86.
- Søndergaard M, Jeppesen E, Jens Peder J. 2005. Pond or lake; does it make any difference. Arch Hydrobiol. 162:143–165. doi: 10.1127/0003-9136/2005/0162-0143
- Spencer M, Blaustein L, Schwartz SS, Cohen JE. 1999. Species richness and the proportion of predatory animal species in temporary freshwater pools: relationships with habitat size and permanence. Ecol Lett. 2:157–166. doi: 10.1046/j.1461-0248.1999.00062.x
- Statzner B, Doledec S, Hugueny B. 2004. Biological trait composition of European stream invertebrate communities: assessing the effects of various trait filter types. Ecography. 27:470–488. doi: 10.1111/j.0906-7590.2004.03836.x
- Thiere G, Milenkovski S, Lindgren P-E, Sahlén G, Berglund O, Weisner SE. 2009. Wetland creation in agricultural landscapes: biodiversity benefits on local and regional scales. Biol Conserv. 142:964–973. doi: 10.1016/j.biocon.2009.01.006
- Warwick RM, Clarke KR 1998. Taxonomic distinctness and environmental assessment. J Appl Ecol. 35:532–543.
- Williams P, Biggs J, Fox G, Nicolet P, Whitfield M. 2001. History, origins and importance of temporary ponds. Special topic, European temporary ponds: a threatened habitat. Freshwater Forum. 17:7–15.
- Wood PJ, Greenwood MT, Barker SA, Gunn J. 2001. The effects of amenity management for angling on the conservation value of aquatic invertebrate communities in old industrial mill ponds. Biol Conserv. 102:17–29. doi: 10.1016/S0006-3207(01)00087-8