
 ?Mathematical formulae have been encoded as MathML and are displayed in this HTML version using MathJax in order to improve their display. Uncheck the box to turn MathJax off. This feature requires Javascript. Click on a formula to zoom.
ABSTRACT
Changes in composition of phytoplankton communities cause drastic changes in functioning of aquatic ecosystems. In this study, we hypothesized that the shifts in composition of the phytoplankton community of Lake Kinneret induced notable shifts in the relationship between primary production and decomposition of organic matter in the lake ecosystem. To test this, we created an approach based on a statistical analysis of long-term dynamics of diversity indices and their relationships with potential perturbations: changes in lake water level, nutrient loads, and annual average epilimnetic temperature. Biodiversity of the algal community was estimated using Simpson’s Diversity Index and community-weighted mean trait value (functional diversity index). Specific community respiration and photosynthesis assimilation number were considered as the functional traits characterizing the role of phytoplankton in cycling organic matter. The observed temporal trends in the diversity indices provided estimates of the shift in the biotic community from large, relatively faster aerobic decomposing and slower photosynthesizing producers towards slower aerobic decomposing and faster photosynthesizing producers. These trends were confirmed by the results of direct determination of community respiration and (indirectly) by the reduced microbial activity in the epilimnetic waters of the lake.
Introduction
Freshwater ecosystems are efficient sentinels of global climate change because of their sensitivity to environmental changes and integration of changes in the watershed and atmosphere (Schindler Citation2001, Grant et al. Citation2021). The phytoplankton community is the most sensitive component in lake ecosystems to environmental perturbations. At the same time, the modification to composition of the algal community might cause drastic changes in the functioning of the entire ecosystem. The best-known example of the effect of such changes is lake eutrophication accompanied by intense blue-green algal blooms, followed by drastic changes in optical, chemical, and functional properties of the entire lake ecosystem (Chislock et al. Citation2013). The changes in the composition of an algal community and its functioning are related to multiple feedbacks, thus affecting the food web structure and the metabolism of the entire ecosystem via the major biogeochemical cycles (e.g., carbon, nitrogen [N], and phosphorus [P]). Quantification of the relationship between algal community composition and metabolism is tightly connected with the concept of biodiversity.
Biotic diversity is a pivotal concept in ecology (Litchman and Klausmeier Citation2008, Ricotta and Moretti Citation2011, Tilman Citation2015, Roselli and Litchman Citation2017). Quantification of diversity is the first step necessary to find a solution for the important task of relating ecosystem functioning to perturbations (“driving forces”) affecting ecological units and an entire ecosystem (Lepš et al. Citation2006, Tilman Citation2012). Quantification of the biotic diversity in terms of taxonomic and functional diversity could become a useful tool in predicting environmental effects and thus assessing strategies for bioconservation (Juntao et al. Citation2016, Freitas and Mantovani Citation2018, Graco-Roza et al. Citation2021).
Assessment of the relationships between the indices of biodiversity and perturbations requires the following steps: (1) quantification of biodiversity, (2) selection and quantification of parameters of community functioning (functional traits), and (3) selection and quantification of potentially major perturbations.
Traditionally, estimates of biodiversity of biotic communities were based on measures of richness, defined as a number of ecological units (populations or species) forming the biotic community; increased richness means greater biotic diversity. However, richness is not a sufficient conceptual basis for quantifying diversity (Mason et al. Citation2005, Ricotta Citation2005, Ricotta and Moretti Citation2011). Currently, several combinations of relative abundances (pi) of ecological units are applied for quantifying biotic diversity. The Simpson’s Diversity Index (SDI) is one of the commonly used indices of biotic diversity (Heip et al. Citation1998, Botta-Dukat Citation2005, Ricotta Citation2005), but it does not represent a complete description. Assume for simplicity that some algal community was initially composed from 2 subcommunities, dinoflagellates and diatoms, with relative abundances of pdino = 0.7 and pdiat = 0.3, respectively. Further assume that following a major perturbation the composition of this hypothetical community becomes cyanobacteria and chlorophytes, with relative abundances pcyano = 0.7 and pchloro = 0.3, respectively. These 2 communities will have identical values of taxonomic diversity indices. However, in this hypothetical case, a complete change in the diversity and functioning of the initial community is obvious, at least qualitatively. Quantification of these functional properties of the biotic community could be represented by means of additional parameters characterizing the functional diversity of community functional traits.
The use of functional traits has evolved over the past 2 decades. Trait-based approaches are now widely used in studies of diversity at different hierarchical levels, including the phytoplankton community (Botta-Dukat Citation2005, Litchman and Klausmeier Citation2008, Longhi and Beisner Citation2010, Roselli and Litchman Citation2017, Martini et al. Citation2021). A trait-based approach may provide advanced warning of disturbance to ecosystems (Mouillot et al. Citation2013). The relationships between the traits and the perturbations are key to better forecasting community responses to environmental impacts (Roselli and Litchman Citation2017). Basic definitions of functional traits vary widely, from “morpho-physio-phenological traits which impact fitness indirectly via their effects on growth, reproduction and survival” (Violle et al. Citation2007) to “ … species characters that are quantifiable” (Ricotta and Moretti Citation2011). No common approach exists for the selection of the functional traits suitable for estimating functional diversity (Mason et al. Citation2005, Ricotta Citation2005, Lepš et al. Citation2006, Mieleitner et al. Citation2008). Noting the insufficiency of a single-trait approach to quantification of functional diversity (Garnier et al. Citation2004, Ricotta and Moretti Citation2011), some authors suggested valuating functional diversity with a multidimensional approach (Villeger et al. Citation2008). Implementation of this approach requires a large volume of field observations, which is not always available. Nevertheless, quantification of biodiversity with a single trait is often considered the most ecologically relevant (Lepš et al. Citation2006).
The mechanisms responsible for changes in algal diversity are mostly unknown (Reynolds Citation2006). Traditionally, external nutrient loads (total N and total P) and changes to lake morphometry (lake level) are considered “driving forces” of the shifts in the phytoplankton community (Hakanson et al. Citation2000, WFD Citation2000, Adrian et al. Citation2009). Over recent decades, climate change has been considered a progressively increasing factor affecting functioning of freshwater ecosystems, especially the phytoplankton community (Adrian et al. Citation2009, Kraemer et al. Citation2017). Statistical data analysis on the dynamics of selected indicators and potential perturbations is the main tool applied to study the effect of perturbations on aquatic ecosystems. Furthermore, indicators of major shifts in ecosystems are well documented, but studies on the ecological consequences of the observed ecological shifts are less abundant.
In this study, we hypothesized that shifts in the composition of the phytoplankton community of Lake Kinneret induced notable shifts in metabolism of the entire lake ecosystem. The metabolism was characterized by primary production and decomposition of organic matter. To examine this hypothesis, we created an approach based on a statistical analysis of long-term dynamics of the diversity indices (taxonomic and functional) and their relationships with the potential perturbations, namely changes in lake water level (WL), external nutrient loads (N and P), and epilimnetic water temperature. To the best of our knowledge, our approach is the first application to a natural water resource.
Material and methods
Site description
Lake Kinneret is a subtropical lake located at about −210 m altitude (i.e., below mean sea level) in the northern part of the Dead Sea Rift Valley. The limnology of the lake is well documented (Zohary et al. Citation2014b, Berman et al. Citation2014c). The phytoplankton community is the major source of primary production (PP) while macrophyte production is negligible. Lake Kinneret is meso-eutrophic with a mean annual PP of 610 g C m−2 (Yacobi et al. Citation2014). A long-term database that includes data for an extensive range of hydrological, meteorological, and limnological variables, most of which are collected at weekly to monthly frequency from several stations and depths, has been part of an ongoing monitoring programme since 1969 (Sukenik et al. Citation2014b). The Lake Kinneret monitoring programme has generated a detailed long-term record of planktonic primary producers (Zohary et al. Citation2014a). The phytoplankton community of Lake Kinneret, which is the focus of this study, consists of 5 major taxonomic groups: Dinophyta (the dominant algae group), Chlorophyta, Cryptophyta, Bacillariophyta, and Cyanophyta. The biovolume of Dinophyta has typically been dominated by the large Peridinium gatunense (cell size range 9040–87 262 µm3) while the biovolume of Cyanophyta is much smaller (range 492–3510 µm3; Zohary et al. Citation2017). From 1969 to ∼1994, the dynamics and annual succession patterns of several phytoplankton groups were highly stable; dinoflagellates bloomed in spring each year and were the main contributors to the total phytoplankton biomass and production, with green algae, diatoms, and cyanobacteria providing secondary contributions and cryptophytes an additional minor share. Since the mid-1990s, the lake has exhibited uncharacteristic developments in the phytoplankton assemblage, including the invasion and establishment in 1994 of potentially toxic N-fixing cyanobacteria, Aphanizomenon ovalisporum, and the lack of the spring dinoflagellate bloom during most years. Since the mid-1990s, the variability in annual mean biomass of all phytoplankton groups has increased, along with a trend of declining dinoflagellate annual biomass, while that of diatoms, green algae, and especially cyanobacteria has increased (; Zohary Citation2004, Zohary et al. Citation2014c). The reasons for changes to the composition of algal community are unknown. Recently, Parparov et al. (Citation2015) developed and employed a simple statistical approach to quantify the stability of Lake Kinneret phytoplankton community. Conceptually this approach was based on the definition of the stability of an ecological unit as the inverse of the standardized Euclidean Distance between the unit’s current state and some predefined “reference” state. The structure of the Lake Kinneret phytoplankton community consisting of 5 taxonomic groups was shown to destabilize during 1983–2011 in relation to the reference period (1970–1979).
Table 1. Relative abundances of taxonomic groups of the Lake Kinneret phytoplankton.
Methodology
Ecological units under consideration
The phytoplankton community of Lake Kinneret and its structural units (subcommunities), including the 5 taxonomic groups—Bacillariophyta, Chlorophyta, Cryptophyta, Dinophyta and Cyanophyta—were the ecological units included in this study. We selected the level of taxonomic group rather than species level because (1) it is more sensitive to the structural and functional disturbances than the species level (Ives and Carpenter Citation2007), and (2) quantitative estimates of parameters selected as the functional traits (discussed later) were available for these taxonomic groups.
The data used for the current study included monthly mean wet weight biomass concentrations of each of the 5 main taxonomic groups occurring in Lake Kinneret from 1970 to 2012 (Zohary et al. Citation2014c). These data were average biomasses for the top 10 m of the pelagic water column estimated from samples collected fortnightly at a mid-lake station at 7 depths (0, 1, 2, 3, 5, 7, and 10 m) from 1 January 1970 to 31 December 2012. Detailed information on the sampling and analysis routines can be found in Zohary (Citation2004). The time step used for the calculations of the diversity indices was a full year.
Diversity indices
For the objectives of this study, the shifts in the composition of the phytoplankton community were characterized by the dynamics of a set of the diversity indices. We selected 2 widely used indices: the taxonomic index of diversity (SDI) and the index of functional diversity, the community-weighted mean trait value (CWM; Heip et al. Citation1998, Botta-Dukat Citation2005, Lepš et al. Citation2006, Ricotta and Moretti Citation2011). The CWM allows clear ecological interpretation as the weighted mean of a given functional trait within a given species assemblage (Ricotta and Moretti Citation2011). We selected the functional traits characterizing basic limnological metabolic processes: photosynthesis and aerobic decomposition of organic matter. We calculated the taxonomic SDI (sensu Heip et al. Citation1998):
(1)
(1) where DI is the Simpson’s Index of Dominance,
pi is the relative abundance of taxonomic group i, and Σpi = 1.
To evaluate functional diversity, we calculated the CWM value representing the average of the trait values weighted by the relative abundances of each taxonomic group (Garnier et al. Citation2004, Ricotta and Moretti Citation2011):
(2)
(2) where xi is the trait value for the i-th taxonomic algae group. As in equation 1, pi is the relative abundance of taxonomic group i.
The following variables characterizing the role of the algal community in photosynthetic production and decomposition of organic matter were considered the functional traits: dry-weight specific community respiration (CRsp) and phytoplankton photosynthesis assimilation number (AN; photosynthesis per unit of chlorophyll). Determination of the selected functional traits was carried out for all taxonomic groups of the Lake Kinneret phytoplankton (excluding Cryptophyta; ).
Table 2. Values (SD = standard deviation) of the functional traits (assimilation number [AN] and dry-weight specific community respiration [CRsp]) used to calculate functional diversity indices.
CRsp was estimated in experimental series with artificially increased concentrations of the dominant algae groups from the slope of linear regression of community respiration (CR) versus the concentration of the total suspended solids measured in water samples collected during periods in which the specific taxonomic group dominated the community (Parparov et al. Citation1998, Citation2014).
AN was estimated in situ by division of the hourly photosynthetic carbon uptake rate by the respective concentration of chlorophyll. Determinations of chlorophyll and photosynthetic rate for major taxonomic algae groups were recorded at the “optimal depth,” (i.e., at the depth where AN had a maximum value on any given sampling date for water samples in which a taxonomic group constituted >60% of the total phytoplankton biomass; Yacobi and Zohary Citation2010).
The values of CRsp and AN selected for the calculation of the functional diversity indices () represent integrated specific values of contrasting (though functionally interrelated) processes of photosynthetic production (AN) by the individual taxonomic groups and aerobic decomposition of organic matter (CRsp) in the biotic community. In this study, we assumed that CRsp and AN values for the individual algal groups were constant during the entire study period.
The CWM values were calculated using a single-trait approach (i.e., separately for the 2 functional traits: CWM[CRsp] for the CRsp trait, and CWM[AN] for the AN trait).
Note that CWM[AN] and CWM[CRsp] represent surrogates of PP and CR, respectively, and the ratio of CWM[AN]/CWM[CRsp] represents a surrogate of the ratio of PP/CR. A ratio of PP/CR > 1 indicates autotrophic conditions while PP/CR < 1 indicates heterotrophy (Winberg Citation1960). For sake of comparison, the values of the diversity indices were normalized to the corresponding averaged values for 1970–1979 as follows: Vinorm = Vic/Viavg, where Vinorm is the normalized value of the i-th variable (e.g., SDI or CWM), Vic is the variable value calculated from the relative abundance values, and Viavg is the arithmetic mean of the i-th variable for 1970–1979. The period from 1970 to 1979 has been previously used as a reference period for quantification of the ecological stability of Lake Kinneret (Parparov et al. Citation2015, Parparov and Gal Citation2016). One reason for selecting this reference period was that the variability of the driving and state variables during 1970–1979 was noticeably lower than during the rest of the study period.
Potential perturbations
The effect of potential perturbations on biodiversity and functioning of the phytoplankton community was examined by regressing SDI and CWM on annual mean values of lake WL, major nutrient loads (N and P, based on Rom et al. Citation2014), and epilimnetic water temperature (Tavg), which were calculated based on data retrieved from the Lake Kinneret database (Sukenik et al. Citation2014b). We assumed that water temperature at 1 m depth in the pelagic area is representative of epilimnetic waters (Adrian et al. Citation2009).
Results
Temporal dynamics of the dominant algal groups and the Simpson’s Diversity Index (SDI)
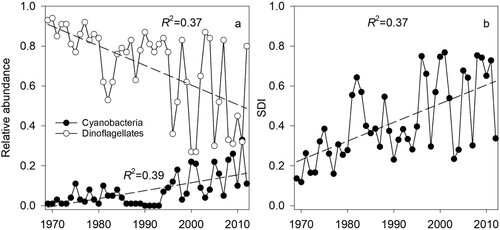
For the study period, the dominant algal taxonomic groups showed statistically significant contrasting trends in their relative abundances represented by a decrease of Dinophyta accompanied by an increase in Cyanophyta (a). The changes in relative abundances of the dominant algal groups were reflected in the increasing trend of the SDI (b). Decadal mean arithmetic average values of the SDI increased from 0.24 in 1970–1979 to 0.53 in 2003–2012. These changes in the taxonomic diversity index are an obvious consequence of the drastic drop in the relative abundance of Dinophyta and the simultaneous increase of the relative abundance of Cyanophyta ().
Figure 1. (a) Temporal dynamics of the annual mean relative abundances of Cyanophyta (Cyano) and Dinophyta (Dino) (values normalized to the average for 1970–1979), and (b) Simpson’s Diversity Index (SDI) of the Lake Kinneret phytoplankton community from 1969 to 2012.
Temporal dynamics of the functional diversity indices
The temporal dynamics of the trait-based indices of functional diversity displayed contrasting trends. The value of CWM[CRsp] exhibited a decreasing trend over time (a), indicating that the weighted average of the CRsp decreased by 14%, mainly due to a decrease in the relative biomass of Dinophyta, which has the highest CRsp value (). By contrast, the dynamics of the AN-based index (CWM[AN] displayed an increasing trend over time (a). The CWM[AN] also increased on average by 14%. These values represent the first ever quantitative estimates of the changes in the diversity indices of the algal community of Lake Kinneret over a period of more than 40 years (1969–2012). The increasing trend of the “biotic budget” (the ratio of CWM[AN]/CWM[CRsp]; b) clearly indicated a shift of the community metabolism towards autotrophy (prevailing of photosynthesis over aerobic decomposition).
Figure 2. (a) Temporal dynamics of the functional diversity indices: community-weighted mean community respiration (CWM[CRsp]) and assimilation number (CWM[AN]). (b) Temporal dynamics of the ratio of CWM[AN]/CWM[CRsp]. CWM values are normalized to the average for 1970–1979 (horizontal solid line). Linear trend lines (dashed line) and coefficients of determination are given.
![Figure 2. (a) Temporal dynamics of the functional diversity indices: community-weighted mean community respiration (CWM[CRsp]) and assimilation number (CWM[AN]). (b) Temporal dynamics of the ratio of CWM[AN]/CWM[CRsp]. CWM values are normalized to the average for 1970–1979 (horizontal solid line). Linear trend lines (dashed line) and coefficients of determination are given.](/cms/asset/07dbdb5c-76ba-4354-b460-d3a9fa534480/tinw_a_2040406_f0002_ob.jpg)
CWM values based on the CRsp and AN traits were strongly inversely intercorrelated (a; R2 = 0.84), meaning that, in Lake Kinneret, the changes to the structure of the algal community resulted in changes to community metabolism: the intensification of photosynthetic processes (estimated as CWM[AN]) accompanied by a decrease in the aerobic decomposition processes (estimated as CWM[CRsp]).
The relationships between taxonomic and functional diversity indices
The SDI was strongly correlated with the CWM. Here, too, we found a contrasting relationship: while CWM[CRsp] was negatively related with SDI, a positive relationship existed between CWM[AN] and SDI. The negative relationship between CWM[CRsp] and SDI indicates a decrease in the biotic community average specific respiration with an increase in SDI, which in turn can be associated with the decrease in Dinophyta biomass (a). The positive relationship between CWM[AN] and SDI indicates an increase in the average specific photosynthesis rate, with an increase in SDI caused by the increase in Cyanophyta abundance (b).
Figure 3. Scatter plots and best fit regression lines for the relationships between the Simpson’s Diversity Index (SDI) and the functional diversity index calculated for different functional traits: (a) CWM[CRsp] and (b) CWM[AN].
![Figure 3. Scatter plots and best fit regression lines for the relationships between the Simpson’s Diversity Index (SDI) and the functional diversity index calculated for different functional traits: (a) CWM[CRsp] and (b) CWM[AN].](/cms/asset/44fb8f01-7b26-4884-b461-088b15bab32d/tinw_a_2040406_f0003_ob.jpg)
Particularly interesting to note is the positive exponential increase in the CWM[AN]/CWM[CRsp] ratio with the increase of SDI (). The CWM[AN]/CWM[CRsp] ratio was an increasing function of the SDI, with a drastic increase of SDI values exceeding 2.5 times the average value obtained for 1970–1979.
Figure 4. Scatter plot and best fit (quadratic) regression line of the relationship between SDI and the ratio of CWM[AN]/CWM[CRsp].
![Figure 4. Scatter plot and best fit (quadratic) regression line of the relationship between SDI and the ratio of CWM[AN]/CWM[CRsp].](/cms/asset/94827169-f7b5-4023-8e21-718a8df31ea5/tinw_a_2040406_f0004_ob.jpg)
Diversity indices versus potential perturbations
The period we examined (1970–2012) had a clear trend of decreasing lake level (R = −0.66) while the epilimnetic temperature displayed a weaker trend (R = 0.38). The P load also exhibited a decreasing trend (R = −0.60) while the N load showed no obvious trend (R = 0.25). The negative, although nonsignificant, relationship between lake WL and epilimnetic temperature should also be noted (R = −0.49).
We examined the statistical relationships between the diversity indices and potential perturbations, including lake WL, nutrient (N and P) loads, and Tavg. The diversity indices (both taxonomic and functional) exhibited a statistically significant and moderate linear relationship with lake WL while the respective relationships with the nutrient loads were less pronounced, although significant (). The relationships with Tavg were characterized by a weak trend and correlation. A negative relationship between SDI and WL indicated an increase (R = 0.55) in taxonomic diversity with a reduction in lake WL. The positive, significant correlation between CWM[CRsp] and WL (R = 0.59) indicates a decline in specific respiration and hence a decline of the aerobic decomposition of the biotic community with a decrease in lake level. In contrast to CWM[CRsp], CWM[AN] decreased with an increase in lake WL, indicating a decrease in the photosynthetic capacity of the algal community with the increase in WL. The negative relationship between the ratio of CWM[AN]/CWM[CRsp] and lake WL (, ) should be especially noted because it indicates a potential shift of the biotic community towards autotrophy, (i.e., relatively higher values of the PP/CR ratio) with a drop in WL.
Figure 5. Scatter plot and linear regression line of the relationship between the lake water level and the ratio of CWM[AN]/ CWM[CRsp].
![Figure 5. Scatter plot and linear regression line of the relationship between the lake water level and the ratio of CWM[AN]/ CWM[CRsp].](/cms/asset/53fb99db-f85d-40da-a798-2cd7824886a9/tinw_a_2040406_f0005_ob.jpg)
Table 3. Coefficients of linear correlation (R) between the diversity indices and potential perturbations: water level (WL), nutrient loads (Nload and Pload), and average epilimnetic water temperature (Tavg). SDI = Simpson's Diversity Index; CWM[CRsp] = community-weighted mean community respiration; CWM[AN] = assimilation number.
Discussion
In this study, we developed an approach for quantifying the effects of the shifts in composition of phytoplankton on the relationship between PP and organic matter decomposition. This approach was applied to the ecosystem of Lake Kinneret, which underwent drastic changes to the phytoplankton community composition.
We defined and quantified taxonomic and functional diversity of the algal community of Lake Kinneret using the SDI and CWM. CWM was estimated for 2 metabolically important functional traits: specific CRsp and specific AN. Apparently, our study is the first implementation of AN and CRsp as functional traits (these parameters were not mentioned in relevant recent reviews; e.g., Litchman and Klausmeier Citation2008, Weithoff and Beisner Citation2019, Laplace-Treyture et al. Citation2021). Quantification of the ecological diversity with the taxonomic and functional diversity indices allowed us to estimate the ecological consequences associated with the shift in the algal community composition. We showed that from 1969 to 2012, the index of taxonomic diversity of the algal community of Lake Kinneret increased and was strongly correlated with the increase in the biotic budget of the community. The indices of the trait-based functional diversity indicated contrasting trends: an increase of CWM[AN] as a consequence of the increase in the relative abundance of Cyanophyta and a decrease of CWM[CRsp] due to a decrease in the relative abundance of Dinophyta. These changes in the diversity indices mirrored the shift of the algal community from a system dominated by a larger and slower photosynthesizing producer generating intensive aerobic decomposition towards a biotic community dominated by faster photosynthesizing producers with reduced rates of aerobic decomposition of organic matter. A consequence of these changes in the structure and metabolism of the algal community should affect the balance between production and decomposition of organic matter in the entire lake ecosystem towards a more positive budget of the organic matter cycle (). Specifically, it reflected a “ … definite slowing down in the rate of organic carbon cycling in the lake over the last decade” (2000–2010; Berman et al. Citation2014a). Regression analysis indicated that (unknown) processes associated with lake water level lowering rather than nutrient loads could be responsible for the shifts in the structure and the functioning of the lake algal community.
Based on the analysis of the main features and dynamics of the diversity indices we can outline the following scheme explaining the relationship between the biotic diversity and metabolism of the algal community of Lake Kinneret.
The dynamics of the diversity indices were almost completely determined by the dynamics of the dominant algal taxonomic groups ( and ): Dinophyta, with large cell size, largest specific CResp, and lowest specific photosynthesis; and Cyanophyta, with small cell size, smallest CR, and largest specific photosynthesis. The decrease in the abundance of Dinophyta accompanied by the increase in Cyanophyta (a) led to an increase in photosynthetic capacity (indicated by CWM[AN]), accompanied by a decline in aerobic decomposition capacity (as indicated by CWM[CRsp]) and thus to shifts towards increased ecosystem autotrophy (i.e., an increase in the biotic budget = CWM[AN]/CWM[CRsp]; b).
Note also that the functional diversity indices were strongly inversely intercorrelated, supporting an assumption about apparent competition, although not clear from our results is whether direct interactions, such as allelopathic relationships (Sukenik et al. Citation2002), or indirect interactions occur between the species.
The SDI does not account for functional dissimilarities between different taxonomic groups (Heip et al. Citation1998, Lepš et al. Citation2006, Violle et al. Citation2007, Ricotta and Moretti Citation2011). Nevertheless, in our case study, the SDI was closely (nonlinearly) correlated with the functional diversity indices () and their ratio (biotic budget). The close relationship between SDI and the biotic budget () clearly underscores the effects of the taxonomic diversity (as indicated by SDI) on the metabolic properties of the algal community of Lake Kinneret.
Of the potential perturbations we examined, the diversity indices showed a stronger relationship to changes in lake water level (, ). Changes in lake water level directly affect several aspects of ecosystem functioning: water salinity (due to changes in water balance), and biogeochemical cycles of seston, organic matter, and major nutrients (due to disruption of the balance between sedimentation and resuspension). The effect of water level lowering on phytoplankton composition is well known (e.g., Lake Sevan case study; Parparov Citation1990, Hakanson et al. Citation2000), and a linkage between lake level and the Lake Kinneret water quality and sustainability indices has been reported (Gilboa et al. Citation2014, Gal and Zohary Citation2017). While the mechanisms linking lake water level lowering to changes in the structure and functioning of the algal community is not clear, the relationships revealed for Lake Kinneret could be useful for predicting the ecological consequences of lake morphometry changes (e.g., water level fluctuations).
Presumably, the amplitude of changes of other potential disturbances such as epilimnetic temperature and nutrient loads were smaller than those of the water level, and therefore their effects on the algal metabolism were not clearly detectable. In addition, we have shown in the past that the external nutrient loads are within limits that allow sustaining the lake ecosystem (Parparov and Gal Citation2012, Parparov et al. Citation2015).
The impact of climate change (in this study estimated based on changes to epilimnetic temperature) is most likely more complicated. Despite the reported increase in water temperature and projected increase (Gal et al. Citation2020), no statistically significant relationship was found between Tavg and the diversity indices, with the exception of CWM[CRsp] that displayed a weak correlation (). This finding, however, should not be interpreted as absence of such an effect. The positive effect of climate-induced changes in the thermal regime on cyanobacteria dominance is relatively better investigated and has been predicted; bloom-forming cyanobacteria have a competitive advantage over other phytoplankton groups at higher temperatures (Adrian et al. Citation2009, Wagner and Adrian Citation2009, Kraemer et al. Citation2017). Also expected is that the increase in cyanobacteria abundance will be accompanied by an increase in N fixation. However, in Lake Kinneret, values of N fixation during the summer–autumn period from 2001 to 2012 ranged from 0.5 in 2003 to 123 t yr−1 in 2005; these values were not correlated with cyanobacteria abundance and water temperature (Hadas Citation2014). Weak dependence of the cyanobacteria dominating Lake Kinneret (Aphonizomenon and Microcystis) on water temperature indirectly follows from determinations of the optimal temperature for growth of cyanobacteria (Sukenik et al. Citation2014a). Maximal growth rate of cyanobacteria (0.3 d−1) was observed for a relatively wide range of water temperatures (20–35 °C). We assume that the effect of the relatively small increase in epilimnetic water temperature (on average 0.5 °C from 1970 to 2012) is not obvious because of the effects of other perturbations and overall variation in the biological indices.
How do the results of this study bear relationships to published data and direct determinations in Lake Kinneret? Three lines of evidence based on data from the lake and observed patterns in eutrophic lakes provide support for our results. Simultaneous determinations of PP and CR in Lake Kinneret were carried out from 2001 to 2011 (Berman et al. Citation2014a, Parparov and Berman Citation2014), and based on these direct determinations, contrasting relationships between CR and relative abundances of the dominant taxonomic groups Cyanophyta and Dinophyta were documented (). These data correspond well with the contrasting relationships between CWMs and relative abundances of the dominating algae groups (), thus providing an important argument for validity of the results obtained with trait-based CWM indices. Another, indirect, confirmation of a decrease in CR (and thus the increase in the biotic budget) is related with the observed significant trend of lower annual average bacterial cell counts (Berman et al. Citation2014b) during 2001–2011. The decrease in annual cell counts coincided with a significant decrease in bacterial production (Berman et al. Citation2014a). Such a decrease in the microbial activity had to result in a decrease in CR, and thus an increase of the community biotic budget.
Figure 6. Scatter plot and best fit regression lines of the relationships between community respiration (CR) and the percentages of (a) Dinophyta (%Dino) and (b) Cyanophyta (%Cyano) of total phytoplankton biomass based on annual average values for 2001–2011.
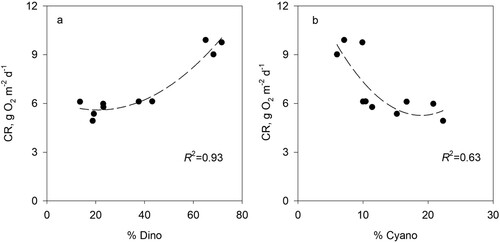
Table 4. Coefficients of linear correlation (R) between the indices of functional diversity and the relative abundances of Dinophyta (%Dino) and Cyanophyta (%Cyano). CWM[CRsp] = community-weighted mean community respiration; CWM[AN] = assimilation number.
While our results coincide with a number of indirect observations, they do suffer from weaknesses. The main weakness in our analysis is the assumption, due to insufficient data, that the functional trait values were constant over time, thus ignoring any potential interannual and intraspecific variations in trait values (Albert et al. Citation2012). In further studies, this assumption should be checked by repeatable determinations.
How do the described changes in biodiversity reflect in the structure and functioning of the entire ecosystem of Lake Kinneret? We had no tools to trace the transformation of the biogeochemical cycles caused by the shifts in the biodiversity of the algal community (e.g., transformation of the detrital food web). Therefore, we summarized the shifts observed in some compartments of the lake ecosystem simultaneously with the shifts in the algal community. Note that despite notable changes in the community structure, the total phytoplankton biomass remained relatively stable. The set of the ecosystem variables associated with the lake trophic status (Secchi depth, total N and P, and concentration of chlorophyll) remained relatively stable, indicating stability of the lake trophic status. Drastic shifts in composition of algal community (mainly the relationship between abundances of dinoflagellates and cyanobacteria) led to considerable deterioration of the lake water quality (Parparov et al. Citation2015, Parparov and Gal Citation2016).
We were unable to compare the results of our study with published results because no published data are comparable. As mentioned earlier, our study is a first example of estimating the functional diversity based on CRsp and AN as the functional traits. Further, long-term data on monitoring of CR and PP in natural lakes are rare. Nevertheless, we believe the selected approach and the results of our study provide new information on the diversity and functioning of the algal community of Lake Kinneret, which can be used to predict the likely ecological effects of major perturbations affecting lakes world-wide. Furthermore, although the relationships revealed in this study are specific to Lake Kinneret, we believe our approach and results provide new insight into limnological aspects of biotic diversity.
Conclusion
We created a methodological approach based on statistical analysis of the relationships between quantified biodiversity and potential perturbations: water level lowering, nutrient loads, and epilimnetic water temperature. This approach allowed us to estimate the ecological consequences associated with the shift in composition of the algal community of Lake Kinneret. We showed that from 1970 to 2012, the Lake Kinneret ecosystem shifted from an algal community dominated by a larger and slower photosynthesizing producer generating intense aerobic decomposition towards a biotic community dominated by faster photosynthesizing producers with reduced rates of aerobic decomposition of organic matter. These trends were confirmed by the results of the direct determinations of CR and (indirectly) by the depletion of the microbial activity in the epilimnetic waters of the lake. A consequence of these changes in the structure and metabolism of the algal community should affect the balance between production and decomposition of organic matter in the entire lake ecosystem towards a more positive budget of the organic matter cycle.
We also revealed the statistical relationships between the diversity indices and changes to lake level as a potential driving factor. The observed relationships could be interpreted as indirect confirmation of the direct or indirect role of the changes in lake water level in transforming the structure and metabolism of the algal community. These relationships also indicate the applicability of diversity indices for evaluating the effects of management measures.
We emphasize that the relationships defined for Lake Kinneret may be site specific, but the approach we presented here for quantifying biodiversity and the link to ecosystem functioning can be applied to other natural water resources.
Acknowledgements
We thank 2 anonymous reviewers for their constructive and valuable comments and Prof. C. Ricotta for a useful and constructive discussion. We used the Kinneret Limnological Laboratory database, which is a part of the Lake Kinneret ecological monitoring programme sponsored by the Israel Water Authority. Partial funding for this work was provided by a grant from the Israeli Ministry of Science and Technology (Project #3-16383).
Disclosure statement
No potential conflict of interest was reported by the authors.
Additional information
Funding
References
- Adrian R, O’Reilly CM, Zagarese H, Baines SB, Hessen DO, Keller W, Livingstone DM, Sommaruga R, Straile D, Van Donk EJ, et al. 2009. Lakes as sentinels of climate change. Limnol Oceanogr. 54(6):2283–2297.
- Albert CH, de Bello F, Boulangeat I, Pellet G. 2012. On the importance of intraspecific variability for the quantification of functional diversity. Oikos. 121:116–126.
- Berman T, Parparov A, Hadas O, Yacobi YZ, Sivan S, Ostrovsky I, Eckert W. 2014a. The fate of organic carbon. In: Zohary T, Sukenik A, Berman T, Nishri A, editors. Lake Kinneret – ecology and management. Dordrecht (Netherlands): Springer; p. 439–472.
- Berman T, Yacobi YZ, Eckert W, Ostrovsky I. 2014b. Heterotrophic and anoxygenic photosynthetic bacteria. In: Zohary T, Sukenik A, Berman T, Nishri A, editors. Lake Kinneret – ecology and management. Dordrecht (Netherlands): Springer; p. 259–271.
- Berman T, Zohary T, Nishri A, Sukenik A. 2014c. General background. In: Zohary T, Sukenik A, Berman T, Nishri A, editors. Lake Kinneret – ecology and management. Dordrecht (Netherlands): Springer; p. 1–15.
- Botta-Dukát Z. 2005. Rao's quadratic entropy as a measure of functional diversity based on multiple traits. J Veg Sci. 16:533–540.
- Chislock MF, Doster E, Zitomer RA, Wilson AE. 2013. Eutrophication: causes, consequences, and controls in aquatic ecosystems. Nat Educ Knowl. 4(4):10.
- Freitas JR, Mantovani W. 2018. An overview of the applicability of functional diversity in biological conservation. Braz J Biol. 78(3):517–524.
- Gal G, Gilboa Y, Schachar N, Estroti M, Schlabing D. 2020. Ensemble modeling of the impact of climate warming and increased frequency of extreme climatic events on the thermal characteristics of a sub-tropical lake. Water. 12:1982.
- Gal G, Zohary T. 2017. Development and application of a sustainability index for a lake ecosystem. Hydrobiologia. 800:207–223.
- Garnier E, Cortez J, Billès G, Navas ML, Roumet C, Debussche M, Alain G, Blanchard DA, Bellmann A, Cathy N, Toussaint JP. 2004. Plant functional markers capture ecosystem properties during secondary succession. Ecology. 85:2630–2637.
- Gilboa Y, Gal G, Friedler E. 2014. Defining limits to multiple and simultaneous anthropogenic stressors in a lake ecosystem – Lake Kinneret as a case study. Environ Model Softw. 61:424–432.
- Graco-Roza C, Soininen J, Corrêa G, Pacheco FS, Miranda M, Domingos M, Marinho M. 2021. Functional rather than taxonomic diversity reveals changes in the phytoplankton community of a large dammed river. Ecol Ind. 121:1–11.
- Grant L, Vanderkelen I, Gudmundsson L, Tan Z, Perroud M, Stepanenko VM, Debolskiy AV, Droppers B, Janssen ABG, Woolway RI, et al. 2021. Attribution of global lake systems change to anthropogenic forcing. Nat Geosci. 14(11):849–854.
- Hadas O. 2014. Microbial processes within the nitrogen cycle. In: Zohary T, Sukenik A, Berman T, Nishri A, editors. Lake Kinneret – ecology and management. Dordrecht (Netherlands): Springer; p. 381–396.
- Hakanson L, Parparov A, Hambright KD. 2000. Modelling the impact of water level fluctuations on water quality (suspended particulate matter) in Lake Kinneret, Israel. Ecol Modell. 128:101–125.
- Heip CHR, Herman PMJ, Soetaert K. 1998. Indices of diversity and evenness. Oceanis. 24:61–87.
- Ives AR, Carpenter S. 2007. Stability and diversity of ecosystems. Science. 317:58–62.
- Juntao Z, Lin J, Youngjan Z. 2016. Relationships between functional diversity and aboveground biomass production in the northern Tibetan alpine grasslands. Sci Rep. 6:34105.
- Kraemer BM, Mehner T, Adrian R. 2017. Reconciling the opposing effects of warming on phytoplankton biomass in 188 large lakes. Sci Rep. 7:10762.
- Laplace-Treyture C, Derot J, Prévost E, Jamoneau A. 2021. Phytoplankton morpho-functional trait dataset from French water-bodies. Sci Data. 8:40.
- Lepš J, de Bello F, Lavorel S, Berman S. 2006. Quantifying and interpreting functional diversity of natural communities: practical considerations matter. Preslia. 78:481–501.
- Litchman E, Klausmeier CA. 2008. Trait-based community ecology of phytoplankton. Annu Rev Ecol Evol. 39:615–639.
- Longhi ML, Beisner BE. 2010. Patterns in taxonomic and functional diversity of lake phytoplankton. Freshwater Biol. 55:1349–1366.
- Martini S, Larras F, Boyé A, Faure E, Aberle N, Archambault P, Bacouillard L, Beisner BE, Bittner L, Castella E, et al. 2021. Functional trait-based approaches as a common framework for aquatic ecologists. Limnol Oceanogr. 66:965–994.
- Mason NWH, Mouillot D, Lee WG, Wilson JB. 2005. Functional richness, functional evenness and functional divergence: the primary components of functional diversity. Oikos. 111:112–118.
- Mieleitner J, Borsuk M, Burgi HR, Reichert P. 2008. Identifying functional groups of phytoplankton using data from three lakes of different trophic state. Aquat Sci. 70:30–46.
- Mouillot D, Graham NAJ, Villeger S, Mason NWH, Bellwood DR. 2013. A functional approach reveals community responses to disturbances. Trends Ecol. 28:167–177.
- Parparov A, Berman T. 2014. Community respiration. In: Zohary T, Sukenik A, Berman T, Nishri A, editors. Lake Kinneret – ecology and management. Dordrecht (Netherlands): Springer; p. 447–451.
- Parparov A, Berman T, Zohary T, Gal G. 2014. Seston and organic matter. In: Zohary T, Sukenik A, Berman T, Nishri A, editors. Lake Kinneret – ecology and management. Dordrecht (Netherlands): Springer; p. 473–484.
- Parparov A, Gal G. 2012. Assessment and implementation of a methodological framework for sustainable management: Lake Kinneret as a case study. Environ Sci. 101:111–117.
- Parparov A, Gal G, Zohary T. 2015. Quantifying the ecological stability of a phytoplankton community: the Lake Kinneret case study. Ecol Ind. 56:134–144.
- Parparov A, Gal G. 2016. Quantifying ecological stability: from community to the lake ecosystem. Ecosystems. 20(5):1–14.
- Parparov AS. 1990. Some characteristics of the community of autotrophs of Lake Sevan in connection with the eutrophication. Hydrobiologia. 191:15–21.
- Parparov AS, Berman T, Grossart HP, Simon M. 1998. The metabolic activity associated with seston in Lake Kinneret. Aquat Microb Ecol. 15:77–87.
- Reynolds CS. 2006. The ecology of phytoplankton. Cambridge (UK): Cambridge University Press. 535 pp.
- Ricotta C. 2005. Through the jungle of biological diversity. Acta Biotheor. 53:29–38.
- Ricotta C, Moretti M. 2011. CWM and Rao’s quadratic diversity: a unified framework for functional ecology. Oecologia. 167:181–188.
- Rom M, Berger D, Teltsch B, Markel D. 2014. Material loads from the Jordan River. In: Zohary T, Sukenik A, Berman T, Nishri A, editors. Lake Kinneret – ecology and management. Dordrecht (Netherlands): Springer; p. 309–327.
- Roselli L, Litchman E. 2017. Contribution to the themed section: phytoplankton traits, functional groups and community organization. Introduction. J Plankton Res. 39:491–493.
- Schindler DW. 2001. The cumulative effects of climate warming and other human stresses on Canadian freshwaters in the new millennium. Can J Fish Aquat Sci. 58:18–29.
- Sukenik A, Eshkol R, Livne A, Hadas O, Rom M, Tchernov D, Vardi A, Kaplan A. 2002. Inhibition of growth and photosynthesis of the dinoflagellate Peridinium gatunense by Microcystis sp. (Cyanobacteria): a novel allelopathic mechanism. Limno Oceanogr. 47:1656–1663.
- Sukenik A, Hadas O, Kaplan A. 2014a. Cyanobacteria. In: Zohary T, Sukenik A, Berman T, Nishri A, editors. Lake Kinneret – ecology and management. Dordrecht (Netherlands): Springer; p. 213–226.
- Sukenik A, Zohary T, Markel D. 2014b. The monitoring program. In: Zohary T, Sukenik A, Berman T, Nishri A, editors. Lake Kinneret – ecology and management. Dordrecht (Netherlands): Springer; p. 561–575.
- Tilman D. 2012. Biodiversity and environmental sustainability amid human domination of global ecosystems. Daedalus. 141:108–120.
- Tilman D. 2015. Biodiversity: from evolutionary origins to ecosystem functioning. Contrib Sci. 11:11–20.
- Villeger SE, Mason WH, Mouillotti D. 2008. New multidimensional functional diversity indices for a multifaceted framework in functional ecology. Ecology. 89:2290–2301.
- Violle C, Navas ML, Vile V, Kazakou E, Fortunel C, Hummel I, Garnier E. 2007. Let the concept of trait be functional! Oikos. 116:882–892.
- Wagner C, Adrian R. 2009. Cyanobacteria dominance: quantifying the effects of climate change. Limnol Oceanogr. 54:2460–2468.
- Weithoff G, Beisner BE. 2019. Measures and approaches in trait-based phytoplankton community ecology – from freshwater to marine ecosystems. Front Mar Sci. 6:40.
- [WFD] Water Framework Directive. 2000. Official text published on 22 December 2000. Official Journal of the European Countries.
- Winberg GG. 1960. Pervichnaya produktsiya vodoyomov [Primary production of water bodies]. Academy of Science USSR: Minsk.
- Yacobi YZ, Erez J, Hadas O. 2014. Primary production. In: Zohary T, Sukenik A, Berman T, Nishri A, editors. Lake Kinneret – ecology and management. Dordrecht (Netherlands): Springer; p. 417–438.
- Yacobi YZ, Zohary T. 2010. Carbon: chlorophyll a ratio, assimilation numbers and turnover times in Lake Kinneret phytoplankton. Hydrobiologia. 639:185–196.
- Zohary T. 2004. Changes to the phytoplankton assemblage of Lake Kinneret after decades of a predictable, repetitive pattern. Freshwater Biol. 49:1355–1371.
- Zohary T, Fishbein T, Shlichter M, Naselli-Flores L. 2017. Larger cell or colony size in winter, smaller in summer – a pattern shared by many species of Lake Kinneret phytoplankton. Inland Waters. 7:200–209.
- Zohary T, Sukenik A, Berman T, Nishri A, editors. 2014a. Lake Kinneret – ecology and management. Dordrecht (Netherlands): Springer. 683 pp.
- Zohary T, Sukenik A, Nishri A. 2014b. Lake Kinneret: current understanding and future perspectives. In: Zohary T, Sukenik A, Berman T, Nishri A, editors. Lake Kinneret – ecology and management. Dordrecht (Netherlands): Springer; p. 657–671.
- Zohary T, Yacobi YZ, Alster A, Fishbein T, Sh L, Tibor G. 2014c. Phytoplankton. In: Zohary T, Sukenik A, Berman T, Nishri A, editors. Lake Kinneret – ecology and management. Dordrecht (Netherlands): Springer; p. 161–190.