
ABSTRACT
Lake–atmosphere carbon exchanges can be significantly affected by photochemical dissolved organic matter (DOM) mineralization. However, our understanding of how increasing allochthonous organic carbon input affects the photoreactivity of DOM per unit of absorbed incoming light is incomplete. Here, we measured the absorption of ultraviolet (UV) light and subsequent photochemical DOM decay in 148 lakes within the subarctic region of Abisko, Sweden. These lakes range from brown-water lakes with allochthonous input from mires to tundra clear-water lakes with relatively more autochthonous input. We used fluorescence excitation–emission matrix analysis to assess the DOM chemical composition to determine how increasing colored DOM (CDOM) affects photomineralization. We found that the photo decay rates in absolute values were positively correlated to CDOM. However, the photo decay per unit of absorbed light energy did not increase with increasing CDOM; rather, it showed a weak decreasing trend. Fluorescence analyses helped explain these patterns; humic-like fluorescent DOM, presumably of terrestrial origin, was associated with high absolute photo decay rates, but not generally with higher photoreactivity per unit of absorbed light energy than other types of DOM. The results suggest that even though increasing inputs of terrestrial substances lead to a higher abundance of photodegradable materials, CO2 emissions do not necessarily increase in lakes where browning limits the ability of light to penetrate deeper water.
Introduction
Dissolved organic matter (DOM) links the terrestrial and aquatic environments and represents a major mobile fraction of carbon in the landscape (Hedges et al. Citation1997, Benner et al. Citation2004, Du et al. Citation2016). Based on its source, DOM can be categorized as allochthonous (external origin; produced in terrestrial environments) and autochthonous (internal origin; produced within the aquatic environment by algae; Castillo et al. Citation2010, Romera-Castillo et al. Citation2011, Du et al. Citation2016). Mineralization of allochthonous DOM to CO2 contributes to making inland waters a key component in the global carbon cycle, emitting greenhouse gases to the atmosphere at a rate of at least 1–2 Pg C per year, despite their relatively small coverage of the Earth’s surface (Cole et al. Citation2007, Battin et al. Citation2008, Tranvik et al. Citation2009, Raymond et al. Citation2013, Du et al. Citation2016).
DOM in aquatic systems is mineralized partly through microbial processes and partly through photochemical reactions (Salonen and Vähätalo Citation1994). Although microbial mineralization tends to dominate, photochemical reactions are particularly important for the decay of DOM in clearwater lakes (Molot and Dillon Citation1997). Approximately 12% of the CO2 emissions from Swedish lakes and up to 10% of the global CO2 emissions from lakes are sunlight induced (Koehler et al. Citation2014). Solar radiation transforms the structure, molecular weight, and optical properties of humic substances, particularly in the ultraviolet (UV) range (Strome and Miller Citation1978, Dehaan and Deboer Citation1991, Allard et al. Citation1994, Kulovaara Citation1996, Bertilsson and Tranvik Citation2000). Thus, photochemical decomposition of DOM can significantly impact aquatic carbon biochemistry and the landscape–atmosphere carbon exchange.
The component of total DOM that absorbs visible and UV wavelength light in the aquatic environment is known as colored or chromophoric dissolved organic matter (CDOM; Coble Citation2007). In general, the more terrestrial input the water receives, the browner the water and the higher the CDOM content (Coble Citation2007). On average, 93% of the DOM has been found to be of terrestrial origin in arctic and subarctic regions influenced by permafrost thawing (Wauthy et al. Citation2018). The increased terrestrial DOM input that results from increasing rainfall and extreme weather events could lead to increasing browning in northern freshwaters (Wauthy et al. Citation2018). However, little is known about how increasing CDOM (brownification) affects the amount of photochemically released CO2 in the water, especially in the understudied arctic and subarctic regions. Lakes absorb a similar amount of the incoming solar radiation, regardless of their characteristics, but light is absorbed at different depths according to the water transparency (Koehler et al. Citation2014). Thus, the key to total CO2 emissions is—in addition to the amount of incoming solar radiation—the CO2 photodegradation per unit of absorbed light energy, which remains a major knowledge gap for subarctic lakes.
There is no scientific consensus that brown-water lakes with a humic DOM character produce greater amounts of CO2 per unit of total absorbed UV light energy (in the water column) than clear-water lakes dominated by nonhumic DOM, despite the theoretical connection between the colored nature of DOM and its photoreactivity (Koehler et al. Citation2014). Therefore, this work aimed to address whether a positive connection exists between CDOM and CO2 production per unit of light absorbed in the water. To address this possible connection, we conducted photochemical degradation experiments to explore the correlations between CDOM and photo decay in 148 subarctic lakes from northern Sweden using an artificial UV light source. We considered the photo decay both in absolute rates of CO2 produced per volume water at a given irradiation level, and relative CO2 produced per unit of absorbed light energy. We further determined the composition of DOM using a fluorescence excitation–emission matrix and parallel factor (EEM-PARAFAC) analysis and explored the links between photoreactivity, DOM composition, and site characteristics such as lake size.
Materials and methods
Study site and sampling
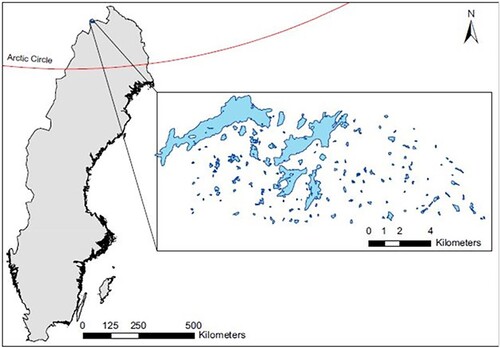
Water samples were collected from 148 lakes situated along an environmental gradient in the subarctic Abisko region in Sweden, ranging from brown-water lakes surrounded by birch forest and small mires to high alpine clear-water lakes. Sampling was conducted on 20 September 2017 by a helicopter survey in a subarctic mountainous plateau in Northern Sweden (), an area composed of oroarctic tundra (Virtanen et al. Citation2016) representing a mix of nordic mountain birch forest and tundra ecotones (Wielgolaski Citation2005). Upon landing on the water surface, samples were collected at 1 m depth using a UWITEC 1.5 L water sampler (UWITEC, Mondsee, Austria), poured into 700 mL acid-washed polycarbonate corning bottles, and immediately stored cold until subsampling in the laboratory. Subsamples of water for analyses of absorbance, fluorescence, and DOM decay were filtered using precombusted (4 h at 500 °C) glass fiber filters (Whatman GF/F, Buckinghamshire, UK) and stored cold in 250 mL acid-washed Nalgene bottles until analysis. Subsamples were taken for total phosphorus (TP) and total nitrogen (TN) from unfiltered water and then frozen at −20 °C until analysis. Samples for dissolved organic carbon (DOC) analysis were filtered (Whatman GF/F) and acidified with hydrochloric acid (HCl) to pH 2.
Incubation and photochemical degradation
Photochemical degradation incubations were performed in a temperature-controlled UV light chamber using 20 mL custom quartz cylindrical vials (inner diameter 1.7 cm) filled with 10 mL filtered sample water. The remaining 10 mL headspace volume was flushed with standard synthetic air before tightening the vials using butyl rubber septa. In total, 4 vials were filled for each sample: 2 dark and 2 irradiated. Every incubation batch in the UV light chamber consisted of 24 irradiated + 24 dark (aluminum foil-covered) control samples placed on a rotating spinner for 24 h to maintain equal exposure to UV light across irradiated samples.
Figure 1. Geographical distribution of the 148 lakes within the subarctic region of Abisko, Sweden.
We assumed all incoming light was roughly from above only and not from side scattering because the long quartz vials were placed horizontally on the spinner, making the surface area large from above but small from the sides. The light samples were placed on a spinning disk at ∼40 cm below five 18-watt UV light lamps. Because the spinner was rotating constantly during the incubation, we assumed all samples received an equal light dose. The UV light irradiation received by the spinning samples (6.4 W m−2) was similar to the average daytime radiation during the summer season in Sweden (Dahlén et al. Citation1996).
Irradiated and dark control samples were injected with 0.5 ml of 10% (v/w) HCl to convert all inorganic carbon into CO2 and then shaken for almost a minute to achieve headspace equilibration. The headspace CO2 was then measured by duplicate injections of ∼5 mL of headspace gas into an EGM-5 infrared gas analyzer (PP Systems, Amesbury, MA, USA), and the total dissolved inorganic carbon (DIC, mg C L−1) was calculated according to Henry’s law and the general gas law (Åberg and Wallin Citation2014). Total photochemical mineralization was calculated as the difference in DIC between the UV irradiated samples and the dark control samples.
DOM photoreaction rates were normalized for the total amount of absorbed radiation energy (Ew) during irradiation between 300 and 450 nm (Supplemental Table S1), where the most photo degradation occurs (Bertilsson and Tranvik Citation2000, Vähätalo Citation2000, Panneer Selvam et al. Citation2016). The total absorbed energy (Ew; W m−2) was calculated according to Bertilsson and Tranvik (Citation2000), based on the known absorption coefficients, light path lengths, and irradiance spectrum of the light source (measured with a radiometer, International Light Inc., Peabody, MA, USA). Detailed calculations have been explained elsewhere (Bertilsson and Tranvik Citation2000, Panneer Selvam et al. Citation2016). DOM consumed during the 24 h of incubation was calculated as the difference in total DIC (released as CO2) between the UV treated samples and the dark samples for duplicate samples.
Optical DOM characterization
Water samples were analyzed before and after the UV light experiments using a Horiba Aqualog (www.horbila.com), the only instrument to simultaneously measure absorbance spectra and fluorescence excitation–emission matrices (EEMs). We used EEMs with emission data from 260 to 600 nm by increments of 2 nm, together with excitation wavelengths from 230 to 450 nm by 5 nm increments. The EEMs were corrected for instrument-specific biases and inner filter effect, and the fluorescent dissolved organic matter (FDOM)-correct toolbox for Matlab was then used to normalize EEM readings to Raman area units. Absorbance was scanned from 200 to 800 nm. The CDOM was calculated based on the absorbance at 440 nm, corrected for turbidity by subtracting the absorbance at 690 nm, and converted to Naperian units through division by cuvette length in meters and multiplying with a correction factor of 2.303 (i.e., ln[10], which converts a decadic coefficient into a Naperian). The corrected EEMs were modeled using PARAFAC analysis according to the toolbox and procedure presented by Murphy et al. (Citation2013). PARAFAC is a method of choice for 3-way data, widely used to decompose fluorescence EEMs to identify and characterize independent underlying chemical components (Murphy et al. Citation2013). Spilt-half validation core consistency diagnostic and a visual inspection of the residuals were used to validate the PARAFAC (Supplemental Fig S2).
Six distinct fluorescence components were generated by PARAFAC to provide a robust description of the DOM fluorescence in our samples. The components were then compared to available previous studies in the OpenFluor database (Murphy et al. Citation2014). The 6 components (referred to as C1–C6 throughout the text; Supplemental Figs S2–S3) are C1 and C3 (visible humic-like components; ex/em = 336/460 and 265–390/510 nm, respectively), C2 and C5 (UV humic-like components; ex/em = <250/446 nm and 255/438 nm, respectively), C4 (microbial humic-like component; ex/em = <250–305/406 nm), and C6 (tryptophan-like component; ex/em = 280/326) nm. The PARAFAC components were expressed both in percentage of the total fluorescence and in standardized Raman area units (R.U.).
Statistical analyses and calculations
We calculated absorbed energy (Ew) and DOM photo decay (PD) values and then normalized PD for the total amount of absorbed radiation energy. Because all lakes in the region receive and absorb a similar amount of total incoming radiation, the PD/Ew ratio in the whole water column is assumed to reflect variations in the overall photo-induced CO2 emissions from the lakes per unit surface area. Lakes with PD/Ew extreme outliers that deviated >3 standard deviations from the mean value were removed to avoid disproportionate influence on the results. In cases where the measured photomineralization rates overlapped with 0 between the replicates, or if the values were slightly negative, we considered the PD to be below the detection limit. However, in linear correlations, these cases of nondetected decay were assigned the value 0.
Pearson correlation coefficient (Pearson r) analysis was used to analyze the strength and significance of the linear correlations between the different measured variables (). Strongly positively skewed (Fisher’s skewness >2) variables were log-transformed prior to correlation analysis.
Table 1. Pearson r correlation between the different measured variables in 148 subarctic lakes in northern Sweden, sampled in 2017.
Results
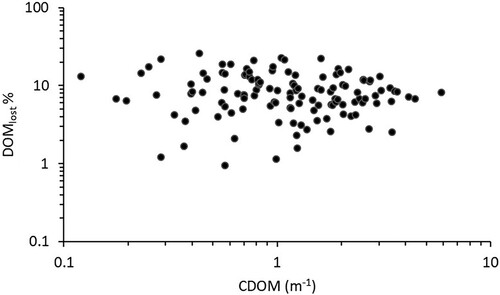
The DOM as well as its optically active fractions (CDOM and FDOM) decreased during the irradiation experiment (). The photo decay corresponded to ∼10% of the initial DOC, on average. This percentage of DOM loss showed no pattern with CDOM concentrations but was relatively evenly distributed along the gradient from clear- to brown-water lakes (). However, in individual cases, the PD varied substantially, from below detection to 1.0 mg C L−1, excluding an extreme outlier value of 5.5 mg C L−1 (Supplementary Table S1). The mean colored CDOM decreased by 9.6%, from 1.35 to 1.22 m−1, as result of the experimental irradiation. The total fluorescent fraction of the DOM decreased 26.5% during 24 h of incubation, from 3.77 to 2.78 R.U. Moreover, the ratio between the mean CDOM and mean DOM slightly increased 1.13 times while the ratio between the mean FDOM and mean DOM decreased 1.15 times (). However, whereas the change from initial to final CDOM:DOM ratios was only marignally significant (Student t-test for samples with unequal variance, 2-tail p ≈ 0.10, t = −1.66, n = 145), there was a significant 2-tail p value (<0.05) for the corresponding difference between initial and final FDOM:DOM (student t-test for samples with unequal variance, t = 2.62, n = 145).
Figure 2. Initial and final incubation values for the dissolved organic matter (DOM) in mg C per L (DOC), colored dissolved organic matter (CDOM), fluorescent dissolved organic matter (FDOM), and ratios between them during 24 h of laboratory UV light exposure of water from 148 subarctic lakes. Note that only initial DOC was measured directly, whereas final DOC was calculated by subtracting the measured photo decay from the initial DOC.
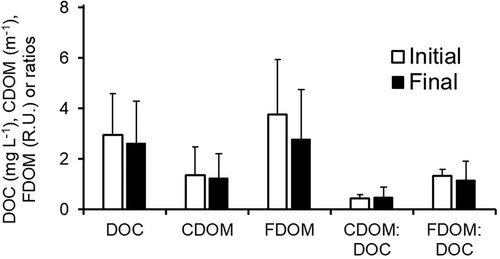
Figure 3. The percentage of the photodegraded DOM (DOMlost) plotted against CDOM on a log-log scale (n = 146).
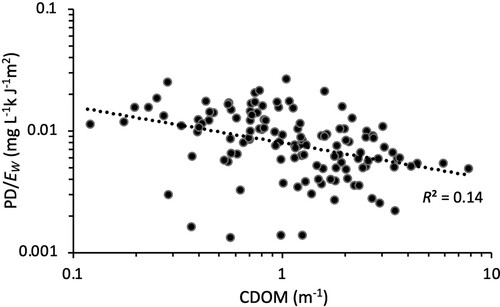
Our results showed a significant positive correlation between the absolute PD rate and CDOM in the 148 study lakes (), implying an increased total abundance of photodegradable materials with water browning. However, when expressing this photodegradation as a ratio of the total absorbed light energy, the correlation with CDOM changed from positive to slightly negative ().
Figure 4. The relationship between the photo decay in absolute values and the CDOM of subarctic lakes near Abisko, northern Sweden (n = 146).
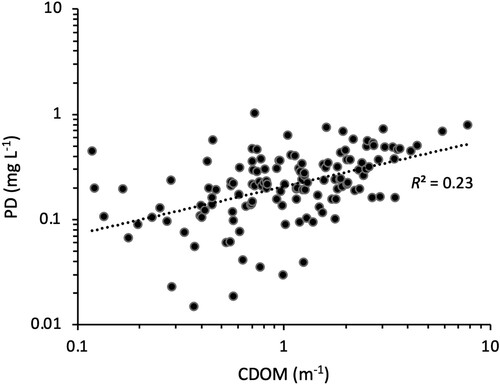
Figure 5. The relationship between the photo decay rate per absorbed energy and CDOM (n = 144).
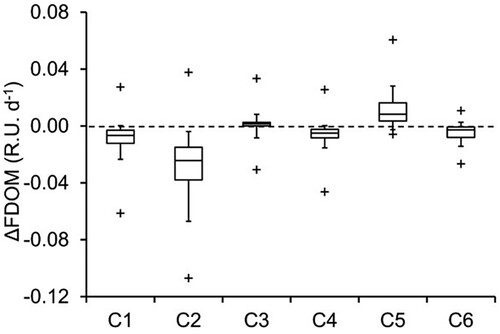
In terms of fluorescence response to irradiation, only component C5 of the 6 FDOM components identified by PARAFAC was significantly produced (on average by 0.011 R.U. d-1), while C3 was almost unchanged, and the other 4 components (C1, C2, C4, and C6) were lost at different rates. C2 was the most lost component of the FDOM (). The production rate of C5 (i.e., ΔC5 = C5 after the incubation − initial C5 before the incubation) had a strong significant positive correlation (p < 0.0001) with CDOM (i.e., it was produced mainly in brown lakes; ). However, a highly significant negative correlation was found between ΔC2 and CDOM (p < 0.0001), indicating that component C2 was mainly lost in response to irradiation in brown lakes ().
Figure 6. The change rate of 6 different fluorescence components (identified by PARAFAC analysis) in response to 24 h simulated sunlight irradiation. All components except C3 are significantly different from 0 according to Student 2-tailed t-test for 2 samples with unequal variance (n = 145–146).
Production of the humic-like component C5 (i.e., ΔC5), showed a weak but significant positive relationship with the percentage DOM lost (R2 = 0.05, p < 0.01). The significant negative correlation between ΔFDOM and CDOM (R2 = 0.17, p < 0.0001) demonstrated that increasing water brownness was accompanied by higher concentrations of FDOM fractions with the potential to be photochemically removed from the water.
Discussion
Because of the intensive solar irradiation at higher altitudes with many hours of daily sunlight in summer above the arctic circle (Sommaruga Citation2001), photochemical transformations are expected to represent a key degradation pathway for terrestrial DOM in the subalpine subarctic lakes of the study region in summer. However, whether this pathway would become more important in response to increased CDOM concentrations is uncertain, mainly because how browning (increasing CDOM) affects the photo reactivity of DOM per unit absorbed light in the water is unknown.
A similar concept known as apparent quantum yield (AQY) is an approach to quantify PD in relation to light absorption at given specific wavelengths. Therefore, AQY closely resembles the metric we measured. The most extensive review performed to date on AQY and water browning (Koehler et al. Citation2016) indicates a positive correlation between AQY at 300 nm and absorbance (water brownness) at 420 nm, but their results also showed inconsistent and greatly variable results between studies. In general, fresh aromatic DOM from terrestrial sources results in higher AQY compared to photobleached, clearer DOM containing a higher proportion of newly generated compounds (Bertilsson and Tranvik Citation2000, Johannessen and Miller Citation2001, Johannessen et al. Citation2007, Koehler et al. Citation2016). However, clear-water lakes occasionally demonstrate comparable or even elevated AQY compared to lakes with a high content of aromatic terrestrial compounds in their DOM (Johannessen and Miller Citation2001, Reader and Miller Citation2012, Powers and Miller Citation2015).
However, browning is not the only role player. Extrinsic factors such as iron concentrations and pH define how light interacts with DOM (Doane and Horwáth Citation2010, Poulin et al. Citation2014). Thus, whether DOM per unit absorbed light generally increases or decreases with water browning remains an open question.
The cumulative amounts of PD observed in this study during 24 h (0–1 mg L−1, mean 0.25 mg L−1) indicate a relatively low PD potential in the study lakes. For example, the experiments performed by Granéli et al. (Citation1998) and Bertilsson and Tranvik (Citation2000) in temperate and other lakes required only 6–8 h of solar irradiation to yield a similar amount of mineralization as that observed by us during 24 h, despite a relatively strong UV light source used in this study, but this difference was probably caused by our relatively lower CDOM concentrations and light absorption. When normalizing the photo decay to the absorbed light energy, the PD/EW values were more than twice as high in this study compared with Bertilsson and Tranvik (Citation2000).
Similarly high PD/EW has previously been reported from relatively clear waters with high pH and high autochthonous DOC input (Selvam et al. Citation2019). However, even higher PD/EW values were found for soil water samples by Panneer Selvam et al. (Citation2016), with results at least 1.5 times higher than this study and 4 times higher than the results of Bertilsson and Tranvik (Citation2000), probably because the photodegradable DOC is protected from UV irradiation more in soils than in lakes; hence the photodegradation potential of such source water is kept high (Panneer Selvam et al. Citation2016).
Our results showed a significant positive correlation between CDOM and the absolute PD rate in the 148 study lakes (), implying an increased total abundance of photodegradable materials with water browning. These photoreactive materials are expected to degrade at a rate proportional to the incoming solar UV irradiation, which in turn is affected by changes in ozone layer thickness or cloud patterns (Hengeveld Citation1991). However, when expressing the measured photodegradation as a ratio of the total absorbed light energy, the correlation with CDOM changed from positive to negative (). The DOM in clear and brown water perhaps absorbs almost the same total amount of light per square meter of lake area, only at different depths; light is absorbed across much of the whole water column for the clearest lakes but absorbed only in the surface layers of brown lakes (Koehler et al. Citation2014). Under this assumption, our results suggest decreased rather than increased photochemical CO2 emissions with increasing CDOM because we found that PD per unit absorbed light energy decreased with more CDOM. Thus, unless browning would cause a higher total light energy absorption in the lakes, higher CDOM concentrations are not leading to greater photochemical CO2 production rates and emissions. Similar to our results, Panneer Selvam et al. (Citation2016) reported no decreasing trend in PD/Ew with increasing CDOM, attributed to an overriding importance of other (extrinsic) factors such as pH.
The assumption of similar total light absorption in the water column of clear and brown lakes, respectively, is valid only if the lakes are sufficiently deep and/or brown to prevent the light from reaching the bottom. Generally, the UV fraction of sunlight is lost particularly fast in the water column, from a few centimeters or decimeters in the brownest and most DOM-rich lakes to a couple of meters at most in the clearest lakes (Williamson et al. Citation1996, Smith et al. Citation2004). Most lakes in this study are clear, and therefore the light may hit the bottom of the lakes before it is completely absorbed, at least in the shallows near the shore. In such cases, any increase in CDOM will lead to more UV light absorption in the water column and less light hitting the bottom, resulting in more photodecayed DOM and thus more CO2 degassing. However, overall, we realistically assume that increased CDOM in the study lakes will only lead to a higher total light absorption by DOM in shallow littoral zones of the clearest lakes in the landscape. In our case, the Naperian UV light absorbance coefficient was higher than 4.6 m−1 at 254 nm (not shown) even in the clearest lakes, which corresponds to only 0.01 (1%) transmittance per meter according to the the Beer-Lambert law. Thus, 99% of this light was absorbed in the first meter, implying that a negligible amount of UV light reached the bottom in our study lakes.
The FDOM fraction of the DOM was mostly lost (∼30%) during the incubation (), but the response to the light treatment in each component was variable, ranging from high loss rates (C2) to significant production rates (C5). With the exception of component 5, the fluorescence analyses showed that humic-like FDOM of presumable terrestrial origin was generally photoreactive, whereas microbial-like (C4) and protein-like (C6) fuorescence showed no or little photoreactivity. This result agrees with past studies indicating high photoreactivity of humic-like DOM relative to other types of DOM in absolute units (Koehler et al. Citation2014).
An interesting outcome of the OpenFluor matching of these components (Supplemental Table S2) is that, in many studies, components C2 and C5 were matched with the same component that had a terrestrial humic-like character (Kothawala et al. Citation2012, Shutova et al. Citation2014, Osburn et al. Citation2016, Andersson et al. Citation2018, Podgorski et al. Citation2018). The resemblance between the 2 components on spectral characteristics is clear (Supplemental Fig. S2–S3), yet these components showed completely different behaviors in our experiment. Component C2 decreased in response to UV light, whereas component C5 increased, suggesting that the DOM was shifted/transformed by one light form to another slightly different form.
Also possible is that bacteria contributed to an altered DOM pool by selective processing of the photochemically produced substances (Boyd and Osburn Citation2004, Berggren and del Giorgio Citation2015, Rowe et al. Citation2018). The increasing C5 () could potentially be due to the microbial degradation processes (Lapierre Citation2008). This produced component is consistent with the hypothesis that FDOM is net produced by bacterioplankton in the natural clear-water of subarctic tundra lakes (Berggren et al. Citation2020). However, when considering the sum of all the different humic-like components, the general pattern was a strong decrease in response to UV light, and this photochemical fluorescence consumtion generally increased with higher CDOM concentrations.
Conclusion
Few studies have characterized the photoreactivity of CDOM in a changing landscape. In many arctic and subarctic lakes, CDOM is increasing, but we do not know how it will affect greenhouse gases emissions due to the photochemical reactions. In this study, the PD in absolute values increased with increasing CDOM, which was an expected result. By contrast, however, increasing CDOM was accompanied by a slightly decreasing trend in PD/Ew (PD per unit absorbed light energy), suggesting less photoreaction and CO2 emissions per unit of incoming solar radiation. Moreover, we found that terrestrial humic-like components of the DOM fluorescence generally were not more correlated to photo decay rates per unit absorbed energy than other components such as micobial- or protein-like components. Terrestrial DOM input increases the amount of materials potentially degradable by photoreactions, yet limits the ability of light to penetrate the deeper water layers. Overall, our study suggests that browning of subarctic lakes would not increase total photomineralization rates.
Supplemental Material
Download MS Word (634.6 KB)Acknowledgement
We thank Francois Guillemette for doing the PARAFAC modeling, and Cristian Gudasz for field work coordination, basic water chemistry measurements and for the map in .
Disclosure statement
No potential conflict of interest was reported by the author(s).
Additional information
Funding
References
- Åberg J, Wallin B. 2014. Evaluating a fast headspace method for measuring DIC and subsequent calculation of pCO2 in freshwater systems. Inland Waters. 4(2):157–166.
- Allard B, Boren H, Pettersson CaZ G. 1994. Degradation of humic substances by UV irradiation. Environ Int. 20(1):97–101.
- Andersson MG, Catalán N, Rahman Z, Tranvik LJ, Lindström ES. 2018. Effects of sterilization on dissolved organic carbon (DOC) composition and bacterial utilization of DOC from lakes. Aquat Microb Ecol. 82(2):199–208.
- Battin TJ, Kaplan LA, Findlay S, Hopkinson CS, Marti E, Packman AI, Newbold JD, Sabater F. 2008. Biophysical controls on organic carbon fluxes in fluvial networks. Nat Geosci. 1(2):95.
- Benner R, Benitez-Nelson B, Kaiser K, Amon RM. 2004. Export of young terrigenous dissolved organic carbon from rivers to the Arctic Ocean. Geophys Res Lett. 31(5):LO5303.
- Berggren M, del Giorgio PA. 2015. Distinct patterns of microbial metabolism associated to riverine dissolved organic carbon of different source and quality. J Geophys Res Biogeosci. 120(6):989–999.
- Berggren M, Gudasz C, Guillemette F, Hensgens G, Ye L, Karlsson J. 2020. Systematic microbial production of optically active dissolved organic matter in subarctic lake water. Limnol Oceanogr. 65(5):951–961.
- Bertilsson S, Tranvik LJ. 2000. Photochemical transformation of dissolved organic matter in lakes. Limnol Oceanogr. 45(4):753–762.
- Boyd TJ, Osburn CL. 2004. Changes in CDOM fluorescence from allochthonous and autochthonous sources during tidal mixing and bacterial degradation in two coastal estuaries. Mar Chem. 89(1–4):189–210.
- Castillo CR, Sarmento H, Alvarez-Salgado XA, Gasol JM, Marraséa C. 2010. Production of chromophoric dissolved organic matter by marine phytoplankton. Limnol Oceanogr. 55(1):446–454.
- Coble PG. 2007. Marine optical biogeochemistry: the chemistry of ocean color. Chem Rev. 107(2):402–418.
- Cole JJ, Prairie YT, Caraco NF, McDowell WH, Tranvik LJ, Striegl RG, Duarte CM, Kortelainen P, Downing JA, Middelburg JJ, Melack J. 2007. Plumbing the global carbon cycle: integrating inland waters into the terrestrial carbon budget. Ecosystems. 10(1):171–184.
- Dahlén J, Bertilsson S, Pettersson C. 1996. Effects of UV-A irradiation on dissolved organic matter in humic surface waters. Environ Int. 22(5):501–506.
- Dehaan H, Deboer T. 1991. UV-degradation of aquatic humic substances. Finnish Humus News. 3(3):177–182.
- Doane TA, Horwáth WR. 2010. Eliminating interference from iron (III) for ultraviolet absorbance measurements of dissolved organic matter. Chemosphere. 78(11):1409–1415.
- Du Y, Zhang Y, Chen F, Chang Y, Liu Z. 2016. Photochemical reactivities of dissolved organic matter (DOM) in a sub-alpine lake revealed by EEM-PARAFAC: an insight into the fate of allochthonous DOM in alpine lakes affected by climate change. Sci Total Environ. 568:216–225.
- Granéli W, Lindell M, De Faria BM, de Assis Esteves F. 1998. Photoproduction of dissolved inorganic carbon in temperate and tropical lakes – dependence on wavelength band and dissolved organic carbon concentration. Biogeochemistry. 43(2):175–195.
- Hedges JI, Keil RG, Benner R. 1997. What happens to terrestrial organic matter in the ocean? Org Geochem. 27(5-6):195–212.
- Hengeveld H. 1991. Understanding atmospheric change: a survey of the background science and implications of climate change and ozone depletion (No. 91). Collingdale (PA): DIANE Publishing.
- Johannessen SC, Miller WL. 2001. Quantum yield for the photochemical production of dissolved inorganic carbon in seawater. Mar Chem. 41(1–3):229–238.
- Johannessen SC, Peña MA, Quenneville ML. 2007. Photochemical production of carbon dioxide during a coastal phytoplankton bloom. Estuar Coastal Shelf Sci. 73(1-2):236–242.
- Koehler B, Broman E, Tranvik LJ. 2016. Apparent quantum yield of photochemical dissolved organic carbon mineralization in lakes. Limnol Oceanogr. 61(6):2207–2221.
- Koehler MJ, Mishra P, Kereluik K, Shin TS, Graham CR. 2014. The technological pedagogical content knowledge framework. In: Bishop MJ, Boling E, Elen J, Svihla V, editors. Handbook of research on educational communications and technology. New York (NY): Springer; p. 101–111.
- Kothawala DN, von Wachenfeldt E, Koehler B, Tranvik LJ. 2012. Selective loss and preservation of lake water dissolved organic matter fluorescence during long-term dark incubations. Sci Total Environ. 433:238–246.
- Kulovaara M. 1996. Light-induced degradation of aquatic humic substances by simulated sunlight. Int J Environ Anal Chem. 62(2):85–95.
- Lapierre JF. 2008. Advection of freshwater phytoplankton in the St. Lawrence river estuarine turbidity maximum as revealed by sulfur-stable isotopes. Mar Ecol Prog Ser. 372:19–29.
- Molot LA, Dillon PJ. 1997. Photolytic regulation of dissolved organic carbon in northern lakes. Global Biogeochem Cycles. 11(3):357–365.
- Murphy KR, Stedmon CA, Graeber D, Bro R. 2013. Fluorescence spectroscopy and multi-way techniques. PARAFAC Analytical Methods. 5(23):6557–6566.
- Murphy KR, Stedmon CA, Wenig P, Bro R. 2014. OpenFluor—an online spectral library of auto-fluorescence by organic compounds in the environment. Analytical Methods. 6(3):658–661.
- Osburn CL, Boyd TJ, Montgomery MT, Bianchi TS, Coffin RB, Paerl HW. 2016. Optical proxies for terrestrial dissolved organic matter in estuaries and coastal waters. Front Mar Sci. 2:127.
- Panneer Selvam B, Laudon H, Guillemette F, Berggren M. 2016. Influence of soil frost on the character and degradability of dissolved organic carbon in boreal forest soils. J Geophys Res Biogeosci. 121(3):829–840.
- Podgorski DC, Zito P, McGuire JT, Martinovic-Weigelt D, Cozzarelli IM, Bekins BA, Spencer RGM. 2018. Examining natural attenuation and acute toxicity of petroleum-derived dissolved organic matter with optical spectroscopy. Environ Sci Technol. 52(11):6157–6166.
- Poulin BA, Ryan JN, Aiken GR. 2014. Effects of iron on optical properties of dissolved organic matter. Environ Sci Technol. 48(17):10098–10106.
- Powers LC, Miller WL. 2015. Hydrogen peroxide and superoxide photoproduction in diverse marine waters: a simple proxy for estimating direct CO2 photochemical fluxes. Geophys Res Lett. 42(18):7696–7704.
- Raymond PA, Hartmann J, Lauerwald R, Sobek S, McDonald C, Hoover M, Butman D, Striegl R, Mayorga E, Humborg C, Kortelainen P. 2013. Global carbon dioxide emissions from inland waters. Nature. 503(7476):355–359.
- Reader HE, Miller WL. 2012. Variability of carbon monoxide and carbon dioxide apparent quantum yield spectra in three coastal estuaries of the South Atlantic Bight. Biogeosciences. 9(11):4279–4294.
- Romera-Castillo C, Sarmento H, Álvarez-Salgado XA, Gasol JM, Marrasé C. 2011. Net production/consumption of fluorescent coloured dissolved organic matter by natural bacterial assemblages growing on marine phytoplankton exudates. Appl Environ Microbiol. 77(21):7490–7498.
- Rowe OF, Dinasquet J, Paczkowska J, Figueroa D, Riemann L, Andersson A. 2018. Major differences in dissolved organic matter characteristics and bacterial processing over an extensive brackish water gradient, the baltic Sea. Mar Chem. 202:27–36.
- Salonen K, Vähätalo A. 1994. Photochemical mineralisation of dissolved organic matter in Lake Skjervatjern. Environ Int. 20(3):307–312.
- Selvam BP, Lapierre JF, Soares AR, Bastviken D, Karlsson J, Berggren M. 2019. Photo-reactivity of dissolved organic carbon in the freshwater continuum. Aquat Sci. 81(4):57.
- Shutova Y, Baker A, Bridgeman J, Henderson RK. 2014. Spectroscopic characterisation of dissolved organic matter changes in drinking water treatment: from PARAFAC analysis to online monitoring wavelengths. Water Res. 54(14):159–169.
- Smith RE, Allen CD, Charlton MN. 2004. Dissolved organic matter and ultraviolet radiation penetration in the Laurentian Great Lakes and tributary waters. J Great Lakes Res. 30(3):367–380.
- Sommaruga R. 2001. The role of solar UV radiation in the ecology of alpine lakes. J Photochem Photobiol B. 62(1–2):35–42.
- Strome DJ, Miller MC. 1978. Photolytic changes in dissolved humic substances. Int Verein Theor Angew Limnol Verh. 20(2):1248–1254.
- Tranvik LJ, Downing JA, Cotner JB, Loiselle SA, Striegl RG, Ballatore TJ, Dillon P, Finlay K, Fortino K, Knoll LB, Kortelainen PL. 2009. Lakes and reservoirs as regulators of carbon cycling and climate. Limnol Oceanogr. 54(6 part 2):2298–2314.
- Vähätalo A. 2000. Role of photochemical reactions in the biogeochemical cycling of detrital carbon in aquatic environments (dissertation). Helsinki (Finland): Univerisity of Helsinki.
- Virtanen R, Oksanen L, Oksanen T, Cohen J, Forbes BC, Johansen B, Käyhkö J, Olofsson J, Pulliainen J, Tømmervik H. 2016. Where do the treeless tundra areas of northern highlands fit in the global biome system: toward an ecologically natural subdivision of the tundra biome. Ecol Evol. 6(1):143–158.
- Wauthy M, Rautio M, Christoffersen KS, Forsström L, Laurion I, Mariash HL, Peura S, Vincent WF. 2018. Increasing dominance of terrigenous organic matter in circumpolar freshwaters due to permafrost thaw. Limnol Oceanogr Lett. 3(3):186–198.
- Wielgolaski FE. 2005. History and environment of the Nordic mountain birch. In: Wielgolaski FE, editor. Plant ecology, herbivory, and human impact in nordic mountain birch forests. Berlin, Heidelberg (Germany): Springer; p. 3–18.
- Williamson CE, Stemberger RS, Morris DP, Frost TM, Paulsen SG. 1996. Ultraviolet radiation in North American lakes: attenuation estimates from DOC measurements and implications for plankton communities. Limnol Oceanogr. 41:1024–1034.