
ABSTRACT
People’s belief that one or more environmentally friendly items that are added to a set of conventional items can reduce the total environmental impact of these items (the negative footprint illusion) could lead to unwanted environmental consequences. An averaging bias seems to underpin this illusion: people make their estimates based on the average of the environmental impact produced by the items rather than the accumulated sum. We report four studies that used various priming manipulations to explore whether people’s preoccupation to think in terms of an average can be eliminated by fostering a summative mindset. The results demonstrate that participants avoid succumbing to the negative footprint illusion when the critical judgment task is preceded by tasks that engender a summation judgment. Our evidence indicates that the negative footprint illusion can be tempered when a primed concept (summation) is used adaptively on subsequent judgments, thereby correcting for bias in environmental judgments.
The scientific community agrees that human activity is one of the main contributors to climate change and the negative consequences that arise from this (IPCC, Citation2015; Oreskes, Citation2004). Despite people generally being aware of the ways in which human activity can influence climate change (Halady & Rao, Citation2010), many individuals continue to make decisions that harm their environment (Sörqvist & Langeborg, Citation2019). Psychological science has provided some key insights into why people make biased decisions that can impact negatively on the environment (Gifford, Citation2011; Sörqvist, Citation2016). However, more research is urgently required to determine the amenability of thought processes to change (e.g. the correction of biases) as evidence suggests that the acceleration of climate change can be reinforced by a collection of different psychological phenomena, including the single action bias (Weber, Citation1997), optimism bias (Beattie et al., Citation2017), moral licensing effects (Klöckner et al., Citation2013), rebound effects (Binswanger, Citation2001) and the negative footprint illusion (Gorissen & Weijters, Citation2016; Holmgren et al., Citation2018b; Kabanshi, Citation2020).
The negative footprint illusion, which is the focus of the present research, occurs when people incorrectly estimate that a combined set of conventional items and environmentally friendly items has a lower environmental impact compared to the conventional items alone (i.e. A + B < A). This illusion is thought to be underpinned by an averaging bias, that is, people make their estimates based on the average environmental impact of the items rather than on the accumulated sum of the environmental impact of the items (Holmgren et al., Citation2019; Holmgren et al., Citation2018a; Sörqvist et al., Citation2020). For example, in one study, Holmgren et al. (Citation2018a) showed that people’s estimates of the environmental impact of a set of conventional buildings were higher, compared to a set containing the same number of conventional buildings in addition to a number of “green” (energy efficient) buildings. Clearly, then, the judgment tasks that give rise to the negative footprint illusion such as the one used by Holmgren et al. (Citation2018a) warrant the need for people to invoke a different mindset to that which they currently deploy when thinking about the environmental impact of objects. To this end, the current study set out to explore whether the negative footprint illusion can be tempered, or even eliminated, by a manipulation that engenders, and primes, a different concept (summation) when participants undertake environmental impact judgments.
Cognitive biases in the environmental domain
A number of systematic biases can be observed with experimental tasks that explore how people reason about the environment (Engler et al., Citation2019; van den Broek & Walker, Citation2019). For example, climate change beliefs are influenced by irrelevant information, such as knowledge of today’s particular temperature (Zaval et al., Citation2014), the framing of questions in terms of whether the wording refers to “global warming” or “climate change” (Schuldt et al., Citation2011) and whether temperature scales are in Celsius or Fahrenheit (Chan, Citation2018). In addition, climate change beliefs are susceptible to anchoring effects, such as having first been primed with heat-related words (Joireman et al., Citation2010).
One reason for these aforementioned biases appears to relate to the process of “attribute substitution” (e.g. Gilovich et al., Citation2002), which is the idea that “when confronted with a difficult question people often answer an easier one instead, usually without being aware of the substitution” (Kahneman & Frederick, Citation2002, p. 53). For example, when asked to judge the energy consumption of appliances such as a fridge or a kettle people overestimate the energy consumption of large appliances (Cowen & Gatersleben, Citation2017), underestimate the energy consumption of small appliances (Baird & Brier, Citation1981) and associate a long duration of use with higher energy consumption (Chisik, Citation2011, september). In these cases, the target attribute that is central to the difficult question being asked by the experimenter relates to how much energy an appliance consumes, whereas the heuristic attribute that is implicitly “substituted” into an easier question that is formulated by the participant relates to appliance size or duration of appliance use. As the target attribute and the heuristic attribute are different, the process whereby the participant substitutes one for the other will – inevitably – lead to systematic biases (Gilovich et al., Citation2002). Being susceptible to these biases may have negative consequences for the environment, for example, potentially leading people to overuse products with a high energy demand because of their small size or to drive for longer distances because they own a car that is environmentally friendly.
The latter examples resemble what is called “negative spillover”. This has been observed in environmental research and can be defined – in the environmental domain – as when a pro-environmental act decreases the likelihood of additional pro-environmental behaviours (Truelove et al., Citation2014). Negative spillover effects have been widely found in environmental research. For example, fuel efficiency is related to increased driving distance (Matiaske et al., Citation2012), decreased water use can result in increased electricity use (Tiefenbeck et al., Citation2013) and electric car owners tend to act in a less environmental friendly manner with respect to other environmental decisions compared with conventional car owners (Klöckner et al., Citation2013). The foregoing examples are related to moral licensing (i.e. acting immorally after establishing moral credentials; Sachdeva et al., Citation2009) and compensatory green beliefs (e.g. “Not driving a car compensates for flying on holiday”; Kaklamanou et al., Citation2015, p. 190).
The negative footprint illusion (Gorissen & Weijters, Citation2016), seems to be comparable to moral licensing and compensatory green beliefs in certain respects. As noted, the negative footprint illusion occurs when people estimate that the environmental impact of conventional objects is greater compared to the same objects together with environmentally friendly items (i.e. A + B < A; Holmgren et al., Citation2018a). The illusion has been shown with buildings (Holmgren et al., Citation2018a, Citation2018b), food products (Gorissen & Weijters, Citation2016), cars (Kim & Schuldt, Citation2018) and with different time periods of emission rates (Holmgren et al., Citation2019). Empirical evidence suggests that the phenomenon is robust, being immune to both the expertise of the decision maker (e.g. energy-systems experts also fall prey to the illusion; Holmgren et al., Citation2018b) and occurring both in within-participants designs (e.g. Holmgren et al., Citation2018b) and between-participants designs (e.g. Gorissen & Weijters, Citation2016).
In terms of explanations for the negative footprint illusion, one study has proposed that compensatory green beliefs (e.g. “I recycle, therefore I can drive my car to work”) are a key predictor of the illusion (MacCutcheon et al., Citation2020), and evidence gleaned from two other studies suggest that it is underpinned by an averaging bias (Holmgren et al., Citation2018a; Holmgren et al., Citation2019). More specifically, instead of considering each item’s individual environmental impact and making an estimate based on the aggregated sum, people seem to make a vice/virtue categorisation of each item (e.g. good vs. bad; green vs. conventional) and subsequently make their overall estimates using the average environmental impact of the items. The averaging bias also appears to underpin several other effects found in the psychological literature. For example, people believe that: (i) when a healthy side dish is added to a meal, the overall perceived calorie content decreases (Chernev & Gal, Citation2010); (ii) when adding a weak argument to a strong argument the persuasiveness of the overall message decreases (Weaver et al., Citation2016); and (iii) when adding a low risk stock to a high risk stock the overall risk decreases (Kunz et al., Citation2017).
We view it as possible that many of the effects that occur in environmental decision making that we have outlined, such as the negative footprint illusion, moral licensing and the existence of compensatory green beliefs, have a basis in a common, underpinning cognitive mechanism that reflects people’s tendency to privilege an averaging process over a summation process, whether this occurs when considering the environmental impact of a set of presented items (as in the negative footprint illusion) or when estimating the environmental impact of one’s own actions (as in moral licensing). Erroneous reasoning based on an averaging bias appears to be a fundamental thought pattern that arises across species (e.g. with monkeys [Kralik et al., Citation2012] and dogs [Pattison & Zentall, Citation2014]). Moreover, some work has argued that a bias to engage in an averaging process may have led to beneficial effects during human evolution. For example, Sörqvist and Langeborg (Citation2019) argue that the averaging bias may have social origins that relate to the evolution of cooperative behaviours for ensuring the restoration of balance in interpersonal relationships (i.e. having done something hurtful to a conspecific, one can restore the balance by doing something virtuous). On the other hand, when this thought pattern is applied to address problems that humans are not adapted to solve (e.g. judgments relating to climate change), then detrimental consequences may occur. As the negative footprint illusion seems to be a robust phenomenon (see ), potentially influencing decisions that can cause harm to the environment, it is important to explore the boundary conditions for the occurrence of the illusion as well as ways to mitigate its occurrence.
Table 1. A summary of studies that have investigated the existence of a negative footprint illusion, indicating that the illusion is robust across most judgment tasks, dependent measures and study designs.
Notwithstanding our proposal that an averaging bias may form the basis of various effects arising in people’s environment-related judgments, we concede that it is challenging to determine whether the cognitive mechanisms that underpin such biases operate at a more implicit, heuristic and non-conscious level or at a more explicit, analytic and conscious level. We allude here to the fundamental dual-process distinction that pervades much contemporary reasoning research (e.g. see Evans, Citation2018, for discussion of Type 1 vs. Type 2 thinking; see also De Neys, Citation2017; Evans & Stanovich, Citation2013a, Citation2013b). The current literature on judgmental biases in environmental reasoning does not provide clear-cut evidence on the Type 1 or Type 2 basis of reasoning biases and has, instead, produced conflicting findings. In the case of moral licensing, for example, some studies point to a conscious, motivational precursor to the effect (Krischer et al., Citation2010), whereas other research suggests that moral licensing largely operates beneath people’s conscious awareness (Khan & Dhar, Citation2006). Our research does not tackle this contested issue, although we are aware that it is a potentially important topic for further investigation. Instead, the research that we report here is concerned with the issue of whether a priming manipulation (whether operating at a Type 1 or Type 2 level) can mitigate the occurrence of the negative footprint illusion.
If the negative footprint illusion is underpinned by an averaging bias, then we propose that it should be possible to eliminate the effect by first priming a summative concept. One way to do this, as examined in the present research, is to ask participants to undertake an initial judgment task that taps summation prior to them then tackling the critical judgment task that typically gives rise to the negative footprint illusion that is believed to stem from an averaging process. To clarify, the purpose of the research reported here was to investigate whether it is possible to eliminate the negative footprint illusion by giving participants a preceding judgment task in which they make a summative judgment (resulting in A + B > A) to see whether the resulting summative mindset can then facilitate correct performance for a subsequent judgment that involves estimating the environmental impact of a set of conventional objects after environmentally friendly objects have been added to the set. Throughout this paper we chose petrol and electric cars as the stimulus material in the critical judgment task (i.e. the task in which a negative footprint illusion is usually found) as electric cars are generally good options in terms of climate change impacts (Cox et al., Citation2020).
Experiment 1
There is a substantial literature on concept priming within the context of problem solving, wherein the concept or principle that is used to solve one task influences performance on a subsequent task, even if participants do not spontaneously make analogies between the tasks (e.g. Mayer & Wittrock, Citation1996; Schunn & Dunbar, Citation1996). For example, in one study where participants were asked to generate “novel” creatures (e.g. aliens), the creatures generated had more hostile features when participants had been primed with the concept of “hostility” (see Marsh et al., Citation1999). Given this literature base, we expected such concept priming to be possible in the context of the negative footprint illusion. In Experiment 1, we expected that a summation concept used to make a decision in one judgment task would be primed and thereby available to influence performance on a subsequent judgment task (i.e. the critical judgment task in which a negative footprint illusion is usually found).
Method
Participants
Participants were 60 students (63% female) who were recruited by email from various disciplines at a Swedish university (mean age = 28.52 years, SD = 10.04). All participants received a small honorarium (i.e. a cinema voucher) for their participation.
Design
A between-participants design was employed with the summation concept-priming manipulation as the independent variable with two levels (with vs. without). The dependent variables were carbon dioxide emission estimates and carbon footprint estimates (−10, very low carbon dioxide emission/footprint; +10, very high carbon dioxide emission/footprint). The reason why we used carbon dioxide emission estimates as an additional independent variable to the more usual carbon footprint estimates was to explore whether or not the negative footprint illusion is sensitive to different dependent measures of environmental impact. The statistical software used for the analyses was IBM SPSS Statistics 24. The dataset for Experiment 1 is provided as supplementary material.
Materials and procedure
A paper-pencil questionnaire was used to obtain data. All participants read a short introduction to the study stating that it was comprised of questions regarding the carbon footprint of cars. They were then given the information that the higher the carbon footprint, the higher the impact on the environment and vice versa. Half of the participants (N = 30) were allocated to the control condition and were presented with three cars with the appurtenant information, stating: “These three blue cars represent a company’s fleet of cars. Suppose that the total carbon footprint (due to usage and production) of the cars is 0 on the scale below”. Participants were given a reference point of zero on a scale ranging from –10 to +10 and subsequently presented with the question:
Imagine that an electric car is added to the company’s fleet of cars, so that the car fleet now contains three petrol cars and one electric car. What is the total carbon footprint (due to usage and production) for the four cars together, given this information?
Priming Task: The second half of the participants (N = 30) were allocated to the experimental condition and received the same information and questions as the first half of participants. However, before making the same judgments as the first half of the participants they were given two additional judgment tasks, stating: “These three electric cars represent a company’s fleet of cars. Suppose that the total carbon footprint (due to usage and production) of the cars is 0 on the scale below”. Participants were then given a reference point of zero on a scale ranging from –10 to +10 and thereafter were presented with the question:
Imagine that a petrol car is added to the company’s fleet of cars, so that the car fleet now contains three electric cars and one petrol car. What is the total carbon footprint (due to usage and production) for the four cars together, given this information?
The second judgment task consisted of the same question but with carbon dioxide emission as the dependent measure instead of carbon footprint. The type of question was counterbalanced between participants. More specifically, half of the participants started with estimating the carbon dioxide emissions and the other half started with estimating the carbon footprint.
This additional task was given to the second half of the participants to prime a summative concept in advance of them undertaking the second, critical judgment task for which the averaging bias invariably manifests. We assumed that this priming task would result in a higher estimate based on a summation solution principle (the appropriate method of estimation), since adding additional conventional items to an existing set has been shown to increase the estimated environmental impact in previous studies (Gorissen & Weijters, Citation2016; Kim & Schuldt, Citation2018; Kusch & Fiebelkorn, Citation2019).
Results and discussion
For all t-tests reported in the results sections of the current paper, we additionally report the JZS Bayes factor. This compares the degree to which the data support the alternative hypothesis (the standardised differences in the means is not zero and is distributed as a t with 1 degree of freedom) versus the null hypothesis (there is no difference between the means). For each comparison, the JZS Bayes Factor was computed from the t-value using an online calculator (available: http://pcl.missouri.edu/bayesfactor). Unless stated, the JZS Bayes Factor reported is in favour of the alternative hypothesis (H1), as opposed to the null hypothesis (H0).
Priming manipulation
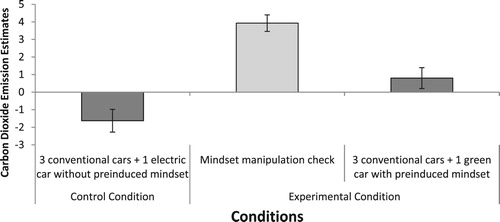
As can be seen in and , the ratings within the priming phase (i.e. adding a petrol car to electric cars) were higher than zero for both carbon footprint estimates (M = 3.33, SEM = .69), t(29) = 4.81, p < .001, BF = 557.52, and for carbon dioxide emission estimates (M = 3.93, SEM = .47), t(29) = 8.38, p < .001, BF = 3914252. These results were as expected from previous research (Gorissen & Weijters, Citation2016; Kim & Schuldt, Citation2018), which has shown that adding conventional items to an existing set leads to an increase in the estimated environmental impact of the total set. Importantly, the priming manipulation in Experiment 1 appears to have been successful in terms of inducing an estimate of environmental impact that is presumably based on an appropriate, summative method.
Figure 1. Carbon footprint estimates given by the participants in the control condition and experimental condition. Error bars represent the standard error of the mean.
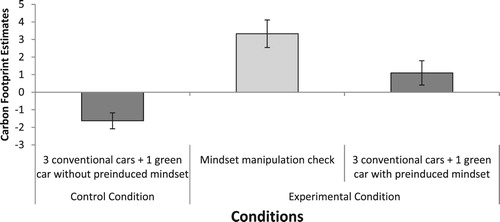
Figure 2. Carbon dioxide emission estimates given by the participants in the control condition and experimental condition. Error bars represent the standard error of the mean.
Carbon footprint estimates
As can be seen in , the carbon footprint estimate in the control condition was significantly lower than zero, as confirmed by a one-sample t-test (M = −1.63, SEM = .79), t(29) = −2.08, p = .047, BF = 1.27, replicating the negative footprint illusion. In contrast, the carbon footprint estimate in the condition following summative concept priming was higher than zero, but this difference was not statistically significant with the conventional alpha threshold (M = 1.10, SEM = .62), t(29) = 1.77, p = .087, BF = 1.29 (in favour of H0). Nevertheless, the observation that the carbon footprint estimate in this condition was higher than zero indicates that the negative footprint illusion was eliminated. It is worth noting, too, that the direction of the means suggests that participants in this latter condition were making their estimate using a summation operation. The estimate in the control condition (M = −1.63, SEM = .79) was significantly lower than the estimate in the experimental (primed) condition (M = 1.10, SEM = .62), as confirmed by an independent sample t-test, t(58) = 2.73, p = .008, η2 = .12, BF = 4.10.
Carbon dioxide emission estimates
The results with the carbon footprint estimates were replicated with the carbon dioxide emissions estimates as the dependent variable, as can be seen in . The carbon dioxide emissions estimate in the control condition was significantly lower than zero (M = −1.63, SEM = .65), as confirmed by a one-sample t-test, t(29) = −2.53, p = .017, BF = 2.87 (replicating the negative footprint illusion), and lower than the carbon dioxide emissions estimate in the experimental (primed) condition (M = 0.80, SEM = .59), as confirmed by an independent sample t-test, t(58) = 2.77, p = .007, η2 = .12, BF = 4.51. The carbon dioxide emissions estimate in the experimental condition did not differ significantly from zero (M = 0.80, SEM = .59), t(29) = 1.35, p = .188, BF = 2.26 (in favour of H0), again indicating that the negative footprint illusion was eliminated.
Experiment 2
Experiment 1 has some methodological idiosyncrasies that may obscure the conclusions that might be drawn from it. First, it is possible that the task that was supposed to induce a summative mindset can be attributed to the averaging account as well. That is, in the priming task, the average environmental impact does, in fact, increase when one petrol car is added to three “green” cars. As such, it is unclear whether the priming task in Experiment 1 genuinely resulted in a summative mindset. Rather, the priming task could simply have created an averaging mindset in the opposite direction. Just as the addition of an environmentally friendly item to a set of conventional items might result in a lower estimate (i.e. “downward averaging”), the addition of a conventional item to a set of environmentally friendly items might simply result in a higher estimate (i.e. “upward averaging”).
Second, in the control condition respondents learn that the total carbon footprint of three petrol cars equals zero on the scale provided. Thus, it is possible that respondents conceive of zero as the “average” point when considering carbon impact on the environment. If participants learn that three petrol cars is already zero on the scale, if they are later asked what it would mean if an electric car was to be added to the fleet, the carbon footprint could be considered reduced since an electric car should be lower than zero. Even though one could make the counter-argument that an averaging account of the manipulation would not readily explain the observed findings on the critical judgment task and that prior studies (Gorissen & Weijters, Citation2016; Kim & Schuldt, Citation2018; Kusch & Fiebelkorn, Citation2019) demonstrate an increase of environmental impact estimates when a conventional item is added to an existing set, the aforementioned uncertainties arising from the methodology adopted in Experiment 1 nevertheless need to be addressed empirically, which was a key motivation for the design of Experiment 2.
Before explaining the methodological refinements that we introduced into Experiment 2 we note a further concern with Experiment 1, which is that the dependent measures (i.e. carbon footprint and carbon dioxide emissions) for the priming task were the same as those for the critical judgment task. Therefore, it is possible that the “domain-specific” overlap between the measures for the two tasks may have been influential in driving the priming effect, potentially diminishing the value of this finding for theoretical advancement. To avoid this issue of domain specificity and to address the domain-general nature of a priming effect, the dependent measure for the priming tasks in Experiment 2 was changed to that of fuel cost, with requested judgments being, for example, whether the fuel cost for a car fleet consisting of three petrol cars will increase when an electric car is added to the fleet. It should also be mentioned that it was deemed sufficient in Experiment 2 (and the experiments reported subsequently) to request only carbon footprint estimates as the dependent measure in relation to the critical judgment task, as the negative footprint illusion was observed for both carbon dioxide emissions and carbon footprint judgments in Experiment 1.
In Experiment 2 we also wanted to explore whether the priming effect transcends the types of objects used in the critical judgment task (i.e. to-be-estimated items). To this end, in the priming tasks in Experiment 2 we employed houses (i.e. existing houses in a residential area and additions of new houses to the residential area) as well as cars (petrol and electric) because robust negative footprint illusions have been previously observed using both types of items (e.g. Holmgren et al., Citation2018a).
Furthermore, a second priming condition was added to Experiment 2, which used the same to-be-estimated items (i.e. either cars or houses) and the same dependent measure (i.e. fuel cost). However, instead of asking participants to compute the sum of the fuel cost when an electric car (or a new house) was added to conventional items, we asked them to estimate the average fuel cost when an electric car (or a new house) was added to the petrol cars or the existing houses. This new priming condition involving averaging was included to address the possibility that a priming condition consisting of any mathematical task relating to how fuel cost will change might, by itself, be enough to eliminate the negative footprint illusion.
Moreover, to increase the likelihood that priming occurs, we employed six summative priming tasks in the conditions wherein participants were asked to make summative fuel cost judgments with cars (hereinafter known as the “cars summation priming condition”) and houses (hereinafter known as the “houses summation priming condition”), and six averaging priming tasks in the conditions wherein participants were asked to make average fuel cost judgments with cars (hereinafter known as the “cars averaging priming condition”), and houses (hereinafter known as the “houses averaging priming condition”). This is a key difference from Experiment 1, where only one priming task was used. Finally, to address the potential problems that we identified with the nature of the judgment scale, in particular, that existing objects were marked at the zero point on the scale, the mid-point of the scale was now labelled “current fuel cost” instead of zero and the scale was shaded from light to dark to represent the fact that the middle of the scale had an associated carbon footprint.
We hypothesised that the negative footprint illusion would be eliminated in the summative priming condition and that the negative footprint illusion would be present in the averaging priming condition, because adding a lower value to a set would decrease the average value. For example, if one were to add an object (e.g. a car) with a value of 5 on a scale (e.g. fuel cost for that car) to an existing object (e.g. car) with a value of 10 on the scale (e.g. fuel cost for that car), the average would be 7.5, whereas the correct summation response would be 15 (i.e. 10 + 5, rather than 10 + 5/2). In each priming condition we also gave the participants numeric information associated with fuel cost (e.g. £33) to increase the possibility that they would make a correct estimate, if they chose to do the calculations demonstrated above.
Method
Participants
A total of 265 participants (67.2% female; mean age = 34.54, SD = 11.74) took part in Experiment 2 (see for the different age and gender statistics across conditions). They all received a small monetary honorarium for their participation. No participant had taken part in Experiment 1.
Table 2. Mean age in years (and SD) of the participants in each condition in Experiment 2, also showing the percentage of female participants across conditions.
Design
A between-participants design was employed with the independent variable being the type of priming with two levels (i.e. averaging vs. summation). The dependent variable in the critical judgment task was the estimate of the carbon footprint of the total set of presented items. The data were collected by using the Prolific Academic crowdsourcing platform to run the online questionnaire that presented the priming tasks and the critical judgment task. Key inclusion criteria concerned the need for participants to have been born and be living in the U.K., have English as their first language and have no literacy difficulties. Another inclusion criterion related to the requirement for the participant to provide a correct answer to each priming task in each condition. The rationale for this was that we wanted to explore whether a summation concept (or an averaging concept, depending on the condition) that was used to make a decision in one judgment task could be primed and thereby available to influence performance on a subsequent judgment task (i.e. the critical judgment task in which a negative footprint illusion is usually found). We note that 56 participants failed to give a correct judgment in the priming tasks and were therefore excluded from the analyses. The full dataset for Experiment 2 is provided as supplementary material, with the excluded participants clearly identified. The statistical software used for the analyses was IBM SPSS Statistics 24.
Materials and Procedure
Critical judgment task. Before describing the different priming tasks, we will describe the critical judgment task used in all experiments and conditions hereafter. For the critical judgment tasks participants first read information stating:
In this section you will see pictures that represent a company’s car pool. Your task is to estimate how the total carbon footprint changes when more cars has been added the company car fleet. Read the information carefully before making your estimates.
Imagine that an electric car is added to the company’s fleet of cars, so that the car fleet now contains three petrol cars and one electric car. How does the total carbon footprint (due to usage and production) of the car fleet change when the electric car has been added?
The cars summation priming condition. Before receiving the critical judgment task described above, the participants in the cars summation priming condition read a short introduction to the study stating:
In this section you will see pictures that represent a company’s car pool. Your task is to estimate how the total fuel cost changes when more cars have been added to the company car fleet. Read the information carefully before making your estimates.
Figure 3. The graphic used to depict a single petrol car. The number of cars displayed to participants corresponded with the information described in each method section.

Participants were then presented with this information and question:
Imagine that 1 electric car is added to the existing car fleet so that the car fleet now consists of 3 petrol cars and 1 electric car. The monthly fuel cost for one electric car is £33. How does the total monthly fuel cost of the car fleet change when the electric car has been added?
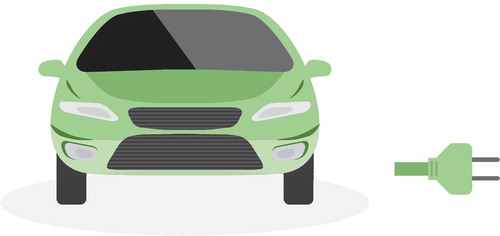
This text was accompanied by a picture with three blue petrol cars (see ) together with a green electric car (see ). The participants were also presented with an information box, which provided them with the specific fuel cost for one electric car and for one petrol car. Then they were asked to make their estimate on a scale labelled on the left as “very large decrease in total” and on the right as “very high increase in total”. The reference point was from the centre of the scale indicating “current fuel cost”.
Figure 4. The graphic used to depict a single electric car. The number of cars displayed to participants corresponded with the information described in each method section.
Participants were then asked to respond to five more priming tasks, with the only thing changing from the one above being the number of cars and their appurtenant current fuel cost (see ; the order of the priming tasks was randomised between participants). After responding to the priming tasks participants were then asked to respond to the critical judgment task.
Table 3. The number of petrol cars and electric cars in the six priming tasks across conditions.
The cars averaging priming condition. The questionnaire used in the cars averaging priming condition was identical to that used in the cars summation priming condition, with the following exception: before receiving the critical judgment task, the participants who were responding to the priming tasks in this condition were asked to estimate the change of the average fuel cost per car instead of the total fuel cost of all the cars in the car fleet.
The houses summation priming condition. Before receiving the critical judgment task, the participants in the houses summation priming condition read a short introduction to the study stating: “In this section you will see pictures that represent a residential area. Your task is to estimate how the total monthly fuel costs changes when new families have moved in. Read the information carefully before making your estimates”. When they had read this statement, they continued to the first priming task. The priming tasks first gave the participants the information:
The 3 blue houses represent the current inhabited households in a residential area. The total monthly fuel cost (by fuel cost we mean costs as a result of heating, electricity and gas etc.) of the 3 current households is £315 and is marked on the scale below as ‘current total fuel cost’.
Figure 5. The graphic used to depict a single existing house in the residential area. The number of houses displayed to participants corresponded with the information described in each method section.

Participants were then presented with this information and question:
Imagine that 1 new family is moving into the residential area so that the residential area now consists of 3 old households and 1 new household. The total monthly fuel costs of 1 new household is £80. How does the monthly fuel costs change in total in the residential area when 1 new family has moved in?
Figure 6. The graphic used to depict a single new additional house in the residential area. The number of houses displayed to participants corresponded with the information described in each method section.

Participants were then asked to respond to five more priming tasks, with the only thing changing from the one above being the number of houses and their appurtenant current fuel cost (see ; the order of the priming tasks was randomised between participants). After responding to all six of the priming tasks, participants were asked to respond to the critical judgment task.
Table 4. The number of existing houses and additional new houses in the six priming tasks across conditions.
The houses averaging priming condition. The questionnaire used in the houses averaging priming condition was identical to that used in the houses summation priming condition, with the following exception: before receiving the critical judgment task, the participants who were responding to the priming tasks in this condition were asked to estimate the change of the average fuel cost per house instead of the total fuel cost of all the houses in the residential area.
Results and discussion
Priming manipulation
As can be seen in , the responses in the priming phase of each condition were significantly different from zero, as shown by one-sample t-tests. More specifically, participants in the cars (and houses) summation priming condition estimated that adding one or several electric car/s (or new additional house/s) would increase the current fuel cost in total. In contrast, the participants in the cars (and houses) averaging priming condition estimated that adding one or several electric car/s (or an new additional house/s) would decrease the current fuel cost on average, per car (or house). These responses suggest that the priming manipulation in Experiment 2 successfully induced an appropriate method of calculation: either summation or averaging.
Table 5. Manipulation check for each priming condition in Experiment 2, showing the mean response (and SE) when fuel cost is the dependent measure.
Carbon footprint estimates
A univariate analysis of variance was conducted with type of priming (summation vs. averaging) as the independent variable. The analysis revealed a significant difference between conditions, F(3,205) = 11.57, p < .001, ηp2 = .15 (see ).
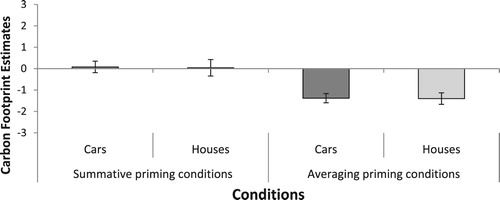
Figure 7. Carbon footprint estimates for all priming conditions in Experiment 2. Error bars represent the standard error of the mean.
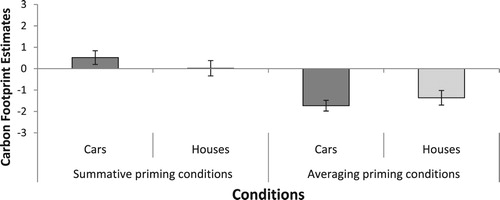
Post hoc one-sample t-tests revealed that carbon footprint estimates for the critical judgment task in both the cars (M = 0.52, SEM = .32) and houses (M = 0.02, SEM = .32) summation priming conditions did not differ significantly from zero, t(49) = 1.61, p = .113, BF = 1.95 (in favour of H0) and t(49) = 0.06, p = .955, BF = 6.49 (in favour of H0), respectively. As such, these summation priming conditions did not give rise to a negative footprint illusion, which we contend is evidence that summation priming can eliminate the bias to use an averaging approach in generating a carbon footprint estimate on the critical judgment task. We acknowledge that summation priming did not engender normatively “correct” responding, which would have been demonstrated convincingly had carbon footprint estimates been significantly greater than zero. Nevertheless, we would argue that although participants were not making strictly accurate estimates on the critical judgment task it is still the case that the typical negative footprint illusion was eliminated.
With respect to participants’ carbon footprint ratings after responding to the averaging priming tasks, post hoc one-sample t-tests revealed that these judgments were significantly lower than zero, indicating the presence of a negative footprint illusion. This was true both for the cars averaging priming condition (M = −1.73, SEM = .25), t(55) = 6.99, p < .001, BF = 3019563 and for the houses averaging priming condition (M = −1.36, SEM = .34), t(52) = 3.95, p < .001, BF = 102.87. These later results suggest that priming an averaging mindset aligns with people’s standard bias to use an averaging approach in generating a carbon footprint estimate on the critical judgment task.
It is worth noting, too, that the direction of the means when comparing the summation priming conditions to the averaging priming conditions further supports the view that participants were, indeed, making their estimates using a summation operation in the former conditions whereas they were using averaging in the latter conditions. We finally note that the comparable estimates that arose in the critical judgment tasks for the two summation priming conditions that used very different priming items (i.e. houses vs. cars). This similarity in performance irrespective of the nature of the priming items is suggestive of a domain-general priming effect. This proposal is likewise supported by the very similar estimates that arose in the critical judgment tasks for the two averaging priming conditions that also used distinct items (i.e. houses vs. cars).
Experiment 3
Experiment 2 successfully addressed some of the methodological issues that arose in the context of Experiment 1, including: (1) the concern that the priming task in Experiment 1 could have been tackled using an averaging process rather than the intended summation process; (2) the worry that the scale that was used for the critical judgment task in Experiment 1 was centred to zero; and (3) the possibility that there may have been a domain-specific element to any priming effects observed in Experiment 1 given that cars were the items used in both the priming manipulation and in the critical judgment task. Despite these strengths of Experiment 2, however, we note a further methodological issue that related to the fact that the dependent measure used in the priming tasks was that of fuel cost. It is possible that fuel cost might be perceived to be in the same “domain” as carbon footprint, since fuel is intrinsically related to carbon footprint. As such, Experiment 2 may not have fully eradicated a domain-specific component to the priming effects observed such that it is not possible to be totally confident that the priming manipulation operates in a fully domain-general manner.
To address this latter issue, the present experiment was aimed at replicating Experiment 2, but this time using “income” as the dependent measure in the priming tasks instead of fuel cost. We hypothesised that the negative footprint illusion would, once again, be eliminated in the summative priming conditions but that the illusion would still be present in the averaging priming conditions.
Method
Participants
A total of 319 participants (67.4% female; mean age = 34.98, SD = 12.39) took part in Experiment 3 (see for the different age and gender statistics across conditions). They all received a small monetary honorarium for their participation. No participant had taken part in Experiment 1 or Experiment 2.
Table 6. Mean age in years (including SD) of the participants in each condition in Experiment 3, also showing the percentage of female participants across conditions.
Design
The design of the experiment was identical in all respects to that employed in Experiment 2 and involved a between-participants manipulation that reflected type of priming with two levels (i.e. averaging vs. summation). The dependent variable in the critical judgment task was again the estimate of the carbon footprint of the total set of presented items. Data were collected through an online questionnaire via Prolific Academic and equivalent exclusion criteria were employed to those in Experiment 2. We note that 116 participants failed to give a correct judgment in the priming tasks and were therefore excluded from the analyses. The full dataset for Experiment 3 is provided as supplementary material, with the excluded participants clearly identified. The dataset for Experiment 3 is provided as supplementary material. The statistical software used for the analyses was IBM SPSS Statistics 24.
Materials and procedure
Critical judgment task. The critical judgment task was identical to that used in Experiment 2.
The cars summation priming condition. Before receiving the critical judgment task, the participants in the cars summation priming condition first read a short introduction to the study stating:
In this section you will see pictures that represent a company’s car pool. Your task is to estimate how the total income of the company changes when more cars have been added to the company’s car fleet. Read the information carefully before making your estimates.
Participants were then presented with this information and question:
Imagine that 1 electric car is added to the company’s existing car fleet so that the car fleet now consists of 3 petrol cars and 1 electric car. The total monthly income for 1 electric car in the rental company is £920. How does the company’s monthly income change in total when 1 new electric car has been added?
This text was accompanied by a picture with three blue petrol cars (see ) together with a green electric car (see ). The participants were also presented with an information box, which provided them with the specific income generated by one electric car and by one petrol car. Then they were asked to make their estimate on a scale labelled on the left as “very large decrease in total” and on the right as a “very high increase in total”. The reference point was from the centre of the scale indicating “current income in total”.
Participants were then asked to respond to five more priming tasks, with the only thing changing from the one above being the number of cars and their appurtenant current income (the order of the priming tasks was randomised between participants). After responding to all six of the priming tasks, participants were then asked to respond to the critical judgment task.
The cars averaging priming condition. The questionnaire used in the cars averaging priming condition was the same as the cars summation priming condition with one exception: before receiving the critical judgment task, the participants in the priming tasks were asked to estimate the change of the average income per car instead of the total income of all the cars in the car fleet.
The houses summation priming condition. Before receiving the critical judgment task, the participants in the houses summation priming condition read a short introduction to the study stating: “In this section you will see pictures that represent a residential area. Your task is to estimate how the total monthly income changes when new families have moved in. Read the information carefully before making your estimates”. When they had read this statement, they continued to the first priming task. The priming tasks first gave the participants the information: “The 3 blue houses represent the current inhabited households in a residential area. The total monthly income of the 3 current households is £7,350 and is marked on the scale below as ‘current income in total’”. This text was accompanied by a picture with three blue conventional houses (see ), and a centred marking on a scale labelled “current income in total”.
Participants were then presented with this information and question:
Imagine that 1 new family is moving into the residential area so that the residential area now consists of 3 old households and 1 new household. The monthly income of the one new household is £1,862. How does the monthly income change in total in the residential area when the new family has moved in?
Participants were then asked to respond to five more priming tasks, the only thing changing from the one above was the number of houses and their appurtenant current income (the order of the priming tasks were randomised between participants). After responding to all six of the priming tasks, participants were asked to respond to the critical judgment task.
The houses averaging priming condition. The questionnaire used in the houses averaging priming condition was identical to that used in the houses summation priming condition, with the following exception: before receiving the critical judgment task, the participants who were responding to the priming tasks in this condition were asked to estimate the change of the average income per house instead of the total income of all the houses in the residential area.
Results and discussion
Priming manipulation
As can be seen in , the responses in the priming phase of each condition were significantly different from zero, as shown by one-sample t-tests. More specifically, participants in the cars (and houses) summation priming condition estimated that adding one or several electric car/s (or new additional house/s) would increase the current income in total. In contrast, the participants in the cars (and houses) averaging priming condition estimated that adding one or several electric car/s (or new additional house/s) would decrease the current average income, per car (or house). These responses suggest that the priming manipulation in Experiment 3 successfully induced an appropriate method of calculation, that is, either summation or averaging.
Table 7. Manipulation check for each priming condition in Experiment 3, showing the mean response (and SE) when income is the dependent measure.
Carbon footprint estimates
A univariate analysis of variance was conducted with type of priming (summation vs. averaging) as the independent variable. The analysis revealed a significant difference between conditions, F(3,199) = 8.25, p < .001, ηp2 = .11 (see ).
Figure 8. Carbon footprint estimates for all priming conditions in Experiment 3. Error bars represent the standard error of the mean.
Post hoc one-sample t-tests revealed that carbon footprint estimates for the critical judgment task in both the cars (M = 0.08, SEM = .27) and houses (M = 0.04, SEM = .39) summation priming conditions did not differ significantly from zero, t(49) = 0.30, p = .768, BF = 6.23 (in favour of H0) and t(50) = 0.10, p = .920, BF = 6.53 (in favour of H0), respectively. These results replicate what was observed in Experiment 2 for these conditions. We again suggest that the absence of a negative footprint in the summation priming conditions can be taken as evidence that the illusion was eliminated, albeit with the participants still failing to make a strictly correct response.
With respect to participants’ carbon footprint ratings after responding to the averaging priming tasks, post hoc one-sample t-tests replicated what was observed in Experiment 2, with these judgments being significantly lower than zero, indicating the presence of a negative footprint illusion. This was the case for both for the cars averaging priming condition (M = −1.38, SEM = .22), t(51) = 6.45, p < .001, BF = 334915.4, and for the houses averaging priming condition (M = −1.40, SEM = .27), t(49) = 5.19, p < .001, BF = 4466.95.
In sum, the results of Experiment 3 fully replicate what was observed in Experiment 2, despite the use of a domain-general dependent measure in the priming tasks (i.e. income) that did not overlap with the dependent measure used in the critical judgment tasks (i.e. carbon footprint). As such, the findings in Experiment 3 appear to lend good support for a domain-general account of the value of summative priming for the elimination of the negative footprint illusion.
Experiment 4
Experiments 1–3 used “active” priming conditions in that participants were required to undertake specific summation or averaging operations to promote a corresponding summation or averaging mindset. It is possible, however, that merely requesting participants to engage in any kind of active thinking activity prior to making a critical judgment could bias reasoning performance. To this end, a neutral priming task was adopted in Experiment 4 to rule out the possibility that engaging in any kind of active thinking could impact responses on the critical judgment task.
This new priming task used in Experiment 4 was fashioned on the assumption that although it involved active thinking it would be unlikely to evoke any kind of mathematical reasoning and associated mindset. Therefore, engaging with the task should have no influence over the carbon footprint estimates on the critical judgment task wherein the negative footprint illusion typically occurs. The neutral priming task deployed involved participants making a decision concerning the colour of presented cars (hereinafter known as the “neutral cars condition”) or houses (hereinafter known as the “neutral houses condition”). As this type of task (e.g. deciding the colours of cars or houses) does not, arguably, evoke any kind of mathematical mindset, we hypothesised that the negative footprint illusion would persist in both the neutral houses and neutral cars conditions.
Method
Participants
A total of 102 participants (62% female; mean age = 31.56, SD = 11.05) took part in Experiment 4 (see for the different age and gender statistics across the two conditions). They all received a small monetary honorarium for their participation. No participant had taken part in Experiment 1, Experiment 2 or Experiment 3.
Table 8. Mean age in years (including SD) of the participants in the two condition in Experiment 4, also showing the percentage of female participants across conditions.
Design
The design of the experiment was very similar to that of Experiments 2 and 3 and involved a between participants manipulation that reflected two levels of neutral priming that either related to the colour of cars or the colour of houses. The dependent variable in the critical judgment task was again the estimate of the carbon footprint of the total set of presented items. Data were collected through an online questionnaire via Prolific Academic and equivalent exclusion criteria were employed to those in Experiment 2 and Experiment 3. Note that the participants in this experiment could not give an incorrect response. Therefore, none of the participants were excluded from the analysis. The statistical software used for the analyses was IBM SPSS Statistics 24.
Materials and procedure
Critical judgment task. The critical judgment task was identical to that used in Experiments 2 and 3.
The neutral cars priming condition. Before receiving the critical judgment task, the participants in the neutral cars priming condition first read a short introduction to the study stating: “In this section you will see pictures that represent a company’s car pool. Your task is to decide the color of new cars added to the company’s car pool. Read the information carefully before making your estimates”. When they had read this statement, they continued to the first priming task. The priming tasks first gave the participants the information: “The 3 blue cars represent the cars in an existing carpool. The current blue colour of the cars is centered on the scale below”. This text was accompanied with a picture with three blue petrol cars (see ), and a centred marking on a scale labelled “current blue colour”. Then they were presented with this information and question:
Imagine that 1 electric car is added to the existing car fleet so that the car fleet now consists of 3 petrol cars and 1 electric car. An advertising company has come up with different colour alternatives for the electric car. For the physical appearance of the car fleet, what do you think the colour of the new car should be?
The neutral houses priming condition. The questionnaire used in the neutral houses priming condition was the same as for the neutral cars priming condition, with the only exception being that before receiving the critical judgment task the participants in the priming tasks were asked to decide the colour of houses in a residential area.
Results and discussion
Carbon footprint estimates
The participants were susceptible to the negative footprint illusion both after responding to the priming tasks in the neutral cars condition (M = −1.37, SEM = .42), t(51) = 3.23, p = .002, BF = 14.10, and in the neutral houses condition (M = −1.12, SEM = .41), t(49) = 2.71, p = .009, BF = 4.02, as demonstrated by one-sample t-tests.
The results arising in Experiment 4 indicate that the negative footprint illusion is robust for priming tasks that involve actively thinking about identical objects and arrays to those used in Experiments 2 and 3, but which do not involve any mathematical reasoning. Further, the results suggest that responding to any judgment task prior to responding to the critical judgment task in which the negative footprint illusion is usually found is not enough to eliminate or even temper the illusion.Footnote1 The findings further reinforce the argument that the summative and averaging priming conditions in Experiment 2 and 3 successfully induced summative and averaging mindsets.
General discussion
When viewed together, the series of experiments reported in this paper demonstrate that the negative footprint illusion can be eliminated when the primed concept of summation is used adaptively on subsequent judgments, thereby correcting for biased judgments in environmental reasoning. Furthermore, the reported studies also: (1) replicate the existence of a negative footprint illusion with conventional and electric cars as the items on which judgments are made (Experiment 1–4); (2) demonstrates that the illusion is insensitive to different dependent measures of environmental impact (i.e. carbon footprint estimates vs. carbon dioxide emissions estimates; Experiment 1); and (3) suggest that the illusion still arises when participants are able explicitly to compare the set of only conventional items with the combined set of “green” and conventional objects (Experiments 1–4).
The negative footprint illusion can accelerate climate change as people think that green objects can compensate for conventional objects (Holmgren et al., Citation2018b; Sörqvist & Langeborg, Citation2019), for example, by adding green products to one’s shopping basket to compensate for the conventional products. In extant research on the negative footprint illusion, only one out of eleven experiments have failed to demonstrate the illusion (Gorissen & Weijters, Citation2016, Study 4), suggesting that it is a highly robust phenomenon (see ). This warrants the need for further studies to explore the boundary conditions for the emergence of illusion. The current studies constitute an attempt to address this gap in the literature.
In the current research, we report the elimination of the negative footprint illusion following exposure to a problem for which a summative concept is engendered. One possible explanation for the eradication of the negative footprint illusion in this setting is that of problem-solving transfer, which occurs when “a person uses previous problem solving experience to devise a solution for a new problem” (Mayer & Wittrock, Citation1996, p. 47). Mayer and Wittrock (Citation1996) make a distinction between two types of problem-solving transfer, a low and a high road. The latter is conscious, controlled and effortful, whereas the former is non-conscious, automatic, and effortless. If the high road was at work in the present experiments then the participants in the priming conditions would consciously use the information or processes employed in the preceding judgment task to make the correct estimate (i.e. A + B > A). In contrast, if the low road underpinned the correct judgment, the process would be non-conscious and automatic. This corresponds with Wertheimer’s (Citation1945/Citation1959) view of the generality of transfer, which specifies that people who have solved a specific problem can use the same principle (e.g. A + B > A) on a different problem. This, particularly, chimes with the cars and houses summation priming conditions in Experiment 2 and Experiment 3 as the dependent measures in the priming tasks that were used in those experiments differed from the dependent measure used in the critical judgment task.
The different types of problem-solving transfer that we have described correspond to the view that there are two “families” of cognitive operations (e.g. Gilbert, Citation1999), which were traditionally referred to as “intuition” and “reason”, but which are designated as being “Type 1” and “Type 2” processes in contemporary dual-process theories (e.g. Evans, Citation2018; Evans & Stanovich, Citation2013a, Citation2013b). According to Evans and Stanovich’s (Citation2013a, Citation2013b) framework, Type 1 processes that are intuitive, heuristic and associative are defined in terms of being relatively undemanding of working-memory resources and autonomous, running to completion whenever a relevant cue triggers them. In contrast, Type 2 processes are deliberative, analytic and controlled and defined in terms of requiring working-memory resources and being focused on hypothetical thinking. Type 2 processes also tend to be slow, capacity limited, conscious and serial.
Furthermore, it is generally accepted that Type 1 processes are more prone to biases compared to Type 2 processes, although the latter are by no means immune to such biases, which can arise from a variety of factors, including the application of defective analytic operations (e.g. Evans, Citation2018; Evans & Stanovich, Citation2013a, Citation2013b). As such, whilst it is entirely possible that Type 1 intuitive processes underpin the negative footprint illusion and that Type 2 analytic processes underpin correct judgments, it is far too premature to make a definitive assessment in this respect. One strength of our priming manipulations (particularly the “summative mindset” one) is that it could be conceived of as training the Type 1 system to engage in the “right” kind of processing from the outset. Thus, there is no need to trigger a potentially error-prone Type 2 analytic system. The priming manipulations here align closely with those observed in “nudge theory” whereby cues (typically within the environment) are provided to unconsciously drive decisions (e.g. Linder et al., Citation2018; Rosenthal & Linder, Citation2021). Decisive evidence on the role of Type 1 and Type 2 processes in driving reasoning biases underpinning the genesis of the negative footprint illusion remains an important area for further investigation, as does the exploration of alternative ways to eliminate the negative footprint illusion from people’s estimates in relation to environmental impacts.
One explanation for the negative footprint illusion that has been suggested in previous research is that it might arise as a result of positive reactions to environmentally friendly stimuli, which in turn spill over on subsequent judgment tasks (Kim & Schuldt, Citation2018). This explanation is closely related to the “affect heuristic” (i.e. making a judgment based on the overall affect that the stimulus produces; Slovic et al., Citation2007), and such an explanation might seem reasonable as a preference bias exists for eco-friendly products (e.g. Sörqvist et al., Citation2013). However, the results presented in the current paper suggest that an averaging bias is a more fitting explanation of the illusion. If the negative footprint illusion was due to positive reactions to environmentally friendly stimuli, then there is reason to believe that the priming manipulations (especially in Experiments 2 and 3) would be ineffective. More specifically, when arriving at the critical judgment task (i.e. the carbon footprint judgment) in Experiment 2 and 3, the environmentally friendly stimulus (i.e. the electric car) should still elicit positive reactions. Furthermore, previous research suggests that the affect heuristic may contribute to the negative footprint illusion, although independently from processes that can be ascribed to “cold cognition” (Holmgren et al., Citation2019). This, together with previous research on the negative footprint illusion (Holmgren et al., Citation2018a; Holmgren et al., Citation2019) as well as research showing similar effects to the illusion (e.g. Chernev & Gal, Citation2010; Seta & Seta, Citation2020), argues for the mechanism that underpins the illusion as being one that involves an averaging bias. It should also be mentioned that people rate environmentally friendly objects as having a greater carbon footprint compared to zero impact objects, so the effect cannot arise simply because they think the “green” objects have no net effect on the environment (Andersson et al., Citationsubmitted).
One shortcoming of the present research is that the summative priming tasks did not help the participants to make normatively correct responses on the critical judgment tasks. To be clear, the correct response to the addition of an electric car to three petrol cars would be a significant increase in the total carbon footprint of the set of objects. As the negative footprint illusion is characterised by a significant negative difference from zero, we argue that this particular illusion was eliminated. However, as the responses in the summative priming conditions were not significantly different from zero (in either a positive or negative direction) then a “zero footprint illusion” appears to have prevailed. Therefore, as can be seen in , it is not unreasonable to assume that such a zero footprint illusion manifests when a higher proportion of people correctly use summation and a lower proportion of people incorrectly use averaging, compared to when people respond to the critical judgment task without or with neutral priming. It should also be mentioned that it seems that the summation priming conditions in both Experiment 2 and 3 made people more susceptible to the zero footprint illusion. Thus, a more cautious interpretation of our results might be that the summative priming conditions demoted the negative footprint illusion to a zero footprint illusion.
Table 9. Percentages of participants susceptible to the negative footprint illusion and the zero footprint illusion and percentage of participants that was not susceptible to either illusion (i.e. responding correctly).
Furthermore, in the present paper we used summation and averaging as the concepts for priming the critical judgment task, as well as using a neutral priming concept in Experiment 4. Summation arguably eliminated the negative footprint illusion, whereas the averaging priming conditions demonstrated a negative footprint illusion, suggesting that the illusion cannot be eliminated by a mathematical task per se. However, as the illusion is suggested to be underpinned by an averaging bias, which is the outcome of a vice/virtue categorisation process, a key direction for future research is to explore whether making vices and virtues more salient influences the magnitude of the illusion. If, for example, participants engaged in a task that either involved listing the virtues of an eco-friendly building, or the vices of a conventional building, then it is possible that evaluative priming effects could be observed on the negative footprint illusion if it indeed is underpinned by a vice/virtue categorisation process. In other words, increasing the salience of the virtues of eco-friendly buildings should increase the magnitude of the negative footprint illusion, while increasing the salience of the vices of conventional buildings should diminish, or possibly reverse, the illusion.
In conclusion, converging evidence points to averaging as the mechanism underpinning the negative footprint illusion, resulting in a persuasive bias that impairs people’s ratings of environmental impact. Importantly, we demonstrate here that this averaging bias is not inviolable. More specifically, we propose that summative priming can mitigate the negative footprint illusion. One shortcoming of the present research should, however, be noted: the negative footprint illusion was eliminated but the participants were still overall prone to a zero footprint illusion. That is, although the direction of the means suggests that participants in the summative priming were more likely to make a summative operation for the critical judgment, this was not significant at the group level. Nevertheless, we contend that the current research has the potential to influence and guide future work aiming to clarify the ways in which biases in environmental thinking and decision making can be mitigated by means of training or instructional interventions.
Supplemental Material
Download (1.7 KB)Supplemental Material
Download (5.7 KB)Supplemental Material
Download (5.6 KB)Supplemental Material
Download (1.3 KB)Acknowledgements
The authors would like to thank Johan Stockselius for his help with creating the stimulus-material.
Disclosure statement
No potential conflict of interest was reported by the authors.
Notes
1 To make sure the participants were not biased to respond on the left side of the scale, we recruited 20 participants (who had not participated in Experiment 1, 2, 3 or 4) to complete the “cars averaging priming condition” (with car fuel cost as the dependent measure), but with the scale reversed for the critical judgment task (i.e. the right side indicated a decrease of carbon footprint and the left side indicated an increase). The results demonstrating the presence of a significant negative footprint illusion were replicated (p < .001), indicating that participants had read and understood the task.
References
- Andersson, H., Holmgren, M., Sörqvist, P., Threadgold, E., Beaman, P., Ball, L. J., & Marsh, J. E. (submitted). Too much of a good thing? The negative footprint illusion is exacerbated by the quantity of environmentally friendly additions.
- Baird, J. C., & Brier, J. M. (1981). Perceptual awareness of energy requirements of familiar objects. Journal of Applied Psychology, 66(1), 90–96. https://doi.org/10.1037/0021-9010.66.1.90
- Beattie, G., Marselle, M., McGuire, L., & Litchfield, D. (2017). Staying over-optimistic about the future: Uncovering attentional biases to climate change messages. Semiotica, 2017(218), 21–64. https://doi.org/10.1515/sem-2016-0074
- Binswanger, M. (2001). Technological progress and sustainable development: What about the rebound effect? Ecological Economics, 36(1), 119–132. https://doi.org/10.1016/S0921-8009(00)00214-7
- Chan, E. Y. (2018). Climate change is the world’s greatest threat – in Celsius or Fahrenheit? Journal of Environmental Psychology, 60, 21–26. https://doi.org/10.1016/j.jenvp.2018.09.002
- Chernev, A., & Gal, D. (2010). Categorization effects in value judgments: Averaging bias in evaluating combinations of vices and virtues. Journal of Marketing Research, 47(4), 738–747. https://doi.org/10.1509/jmkr.47.4.738
- Chisik, Y. (2011, September). An image of electricity: Towards an understanding of how people perceive electricity. In P. Campos, N. Graham, J. Jorge, N. Nunes, P. Palanque, & M. Winckler (Eds.), Human-computer interaction – INTERACT 2011. Lecture Notes in Computer Science, (Vol. 6949). Springer. https://doi.org/10.1007/978-3-642-23768-3_9
- Cowen, L., & Gatersleben, B. (2017). Testing for the size heuristic in householders’ perceptions of energy consumption. Journal of Environmental Psychology, 54, 103–115. https://doi.org/10.1016/j.jenvp.2017.10.002
- Cox, B., Bauer, C., Beltran, A. M., van Vuuren, D. P., & Mutel, C. L. (2020). Life cycle environmental and cost comparison of current and future passenger cars under different energy scenarios. Applied Energy, 269, 1–13. https://doi.org/10.1016/j.apenergy.2020.115021
- De Neys, W. (Ed.). (2017). Dual process theory 2.0. Routledge.
- Engler, J. O., Abson, D. J., & von Wehrden, H. (2019). Navigating cognition biases in the search of sustainability. Ambio, 48(6), 605–618. https://doi.org/10.1007/s13280-018-1100-5
- Evans, J. S. B. T. (2018). Dual-process theories. In L. J. Ball, & V. A. Thompson (Eds.), The Routledge international handbook of thinking and reasoning (pp. 151–166). Routledge.
- Evans, J. S. B. T., & Stanovich, K. E. (2013a). Dual-process theories of higher cognition: Advancing the debate. Perspectives on Psychological Science, 8(3), 223–241. https://doi.org/10.1177/1745691612460685
- Evans, J. S. B. T., & Stanovich, K. E. (2013b). Theory and metatheory in the study of dual processing: Reply to comments. Perspectives on Psychological Science, 8(3), 263–271. https://doi.org/10.1177/1745691613483774
- Gifford, R. (2011). The dragons of inaction: Psychological barriers that limit climate change mitigation and adaptation. American Psychologist, 66(4), 290–302. https://doi.org/10.1037/a0023566
- Gilbert, D. T. (1999). What the mind’s not. In S. Chaiken, & Y. Trope (Eds.), Dual process theories in social psychology (pp. 3–11). Guilford.
- Gilovich, T., Griffin, D., & Kahneman, D. (Eds.). (2002). Heuristics and biases: The psychology of intuitive judgment. Cambridge University Press.
- Gorissen, K., & Weijters, B. (2016). The negative footprint illusion: Perceptual bias in sustainable food consumption. Journal of Environmental Psychology, 45, 50–65. https://doi.org/10.1016/j.jenvp.2015.11.009
- Halady, I. R., & Rao, P. H. (2010). Does awareness to climate change lead to behavioral change? International Journal of Climate Change Strategies and Management, 2(1), 6–22. https://doi.org/10.1108/17568691011020229
- Holmgren, M., Andersson, H., & Sörqvist, P. (2018a). Averaging bias in environmental impact estimates: Evidence from the negative footprint illusion. Journal of Environmental Psychology, 55, 48–52. https://doi.org/10.1016/j.jenvp.2017.12.005
- Holmgren, M., Kabanshi, A., Langeborg, L., Barthel, S., Colding, J., Eriksson, O., & Sörqvist, P. (2019). Deceptive sustainability: Cognitive bias in people’s judgment of the benefits of CO2 emission cuts. Journal of Environmental Psychology, 64, 48–55. https://doi.org/10.1016/j.jenvp.2019.05.005
- Holmgren, M., Kabanshi, A., Marsh, J. E., & Sörqvist, P. (2018b). When A+B<A: Cognitive bias in experts’ judgment of environmental impact. Frontiers in Psychology, 9(823), 1–6. https://doi.org/10.3389/fpsyg.2018.00823
- IPCC. (2015). Climate change 2014: Synthesis report. Contribution of working groups I, II and III to the fifth assessment report of the Intergovernmental Panel on Climate Change (R. K. Pachauri & L. Maeyer, Eds). Cambridge University Press.
- Joireman, J., Truelove, H. B., & Duell, B. (2010). Effect of outdoor temperature, heat primes and anchoring on belief in global warming. Journal of Environmental Psychology, 30(4), 358–367. https://doi.org/10.1016/j.jenvp.2010.03.004
- Kabanshi, A. (2020). Are we overestimating the benefits of emission reduction measures? Sustainability, 12(808), 1–9. https://doi.org/10.3390/su12030808
- Kahneman, D., & Frederick, S. (2002). Representativeness revisited: Attribute substitution in intuitive judgment. In T. Gilovich, D. Griffin, & D. Kahneman (Eds.), Heuristics and biases: The psychology of intuitive judgment (pp. 49–81). Cambridge University Press.
- Kaklamanou, D., Jones, C. R., Webb, T. L., & Walker, S. R. (2015). Using public transport can make up for flying abroad on holiday: Compensatory green beliefs and environmentally significant behavior. Environment and Behavior, 47(2), 184–204. https://doi.org/10.1177/0013916513488784
- Khan, U., & Dhar, R. (2006). Licensing effect in consumer choice. Journal of Marketing Research, 43(2), 259–266. https://doi.org/10.1509/jmkr.43.2.259
- Kim, B., & Schuldt, J. P. (2018). Judging the environmental impact of green consumption: Evidence of quantity insensitivity. Journal of Environmental Psychology, 60, 122–127. https://doi.org/10.1016/j.jenvp.2018.10.005
- Klöckner, C. A., Nayum, A., & Mehmetoglu, M. (2013). Positive and negative spillover effects from electric car purchase to car use. Transportation Research Part D: Transport & Environment, 21, 32–38. https://doi.org/10.1016/j.trd.2013.02.007
- Kralik, J. D., Xu, E. R., Knight, E. J., Khan, S. A., & Levine, W. J. (2012). When less is more: Evolutionary origins of the affect heuristic. PLOS ONE, 7(10), e46240, 1–10. https://doi.org/10.1371/journal.pone.0046240
- Krischer, M. M., Penney, L. M., & Hunter, E. M. (2010). Can counterproductive work behaviors be productive? CWB as emotion-focused coping. Journal of Occupational Health Psychology, 15(2), 154–166. https://doi.org/10.1037/a0018349
- Kunz, A. H., Messner, C., & Wallmeier, M. (2017). Investors’ risk perceptions of structured financial products with worst-of payout characteristics. Journal of Behavioral and Experimental Finance, 15, 66–73. https://doi.org/10.1016/j.jbef.2017.07.005
- Kusch, S., & Fiebelkorn, F. (2019). Environmental impact judgments of meat, vegetarian, and insect burgers: Unifying the negative footprint illusion and quantity insensitivity. Food Quality and Preference, 78, 103731, 1–10. https://doi.org/10.1016/j.foodqual.2019.103731
- Linder, N., Lindahl, T., & Borgström, S. (2018). Using behavioural insights to promote food waste recycling in urban households: Evidence from a longitudinal field experiment. Frontiers in Psychology, 9, 352, 1–13. https://doi.org/10.3389/fpsyg.2018.00352
- MacCutcheon, D., Holmgren, M., & Haga, A. (2020). Assuming the best: Individual differences in compensatory “green” beliefs predict susceptibility to the negative footprint illusion. Sustainability, 12(8), 3414, 1–19. https://doi.org/10.3390/su12083414
- Marsh, R. L., Bink, M. L., & Hicks, J. L. (1999). Conceptual priming in a generative problem-solving task. Memory & Cognition, 27(2), 355–363. https://doi.org/10.3758/BF03211419
- Matiaske, W., Menges, R., & Spiess, M. (2012). Modifying the rebound: It depends! Explaining mobility behavior on the basis of the German socio-economic panel. Energy Policy, 41, 29–35. https://doi.org/10.1016/j.enpol.2010.11.044
- Mayer, R. E., & Wittrock, M. C. (1996). Problem-solving transfer. In D. C. Berliner, & R. C. Calfee (Eds.), Handbook of educational psychology (pp. 47–62). Prentice Hall International.
- Oreskes, N. (2004). The scientific consensus on climate change. Science, 306(5702), 1686–1686. https://doi.org/10.1126/science.1103618
- Pattison, K. F., & Zentall, T. R. (2014). Suboptimal choice by dogs: When less is better than more. Animal Cognition, 17(4), 1019–1022. https://doi.org/10.1007/s10071-014-0735-2
- Rosenthal, S., & Linder, N. (2021). Effects of bin proximity and informational prompts on recycling and contamination. Resources, Conservation and Recycling, 168, 105430. https://doi.org/10.1016/j.resconrec.2021.105430
- Sachdeva, S., Iliev, R., & Medin, D. L. (2009). Sinning saints and saintly sinners: The paradox of moral self-regulation. Psychological Science, 20(4), 523–528. https://doi.org/10.1111/j.1467-9280.2009.02326.x
- Schuldt, J. P., Konrath, S. H., & Schwarz, N. (2011). “Global warming” or “climate change”? Whether the planet is warming depends on question wording. Public Opinion Quarterly, 75(1), 115–124. https://doi.org/10.1093/poq/nfq073
- Schunn, C. D., & Dunbar, K. (1996). Priming, analogy, and awareness in complex reasoning. Memory & Cognition, 24(3), 271–284. https://doi.org/10.3758/BF03213292
- Seta, J. J., & Seta, C. E. (2020). Sensitivity to the average and summative impact of multiple events: When “more is more” and when “more is less”. Review of General Psychology, 24(1), 75–93. https://doi.org/10.1177/1089268019887716
- Slovic, P., Finucane, M. L., Peters, E., & MacGregor, D. G. (2007). The affect heuristic. European Journal of Operational Research, 177(3), 1333–1352. https://doi.org/10.1016/j.ejor.2005.04.006
- Sörqvist, P. (2016). Grand challenges in environmental psychology. Frontiers in Psychology, 7(583), 1–3. https://doi.org/10.3389/fpsyg.2016.00583
- Sörqvist, P., Colding, J., & Marsh, J. E. (2020). Psychological obstacles to the efficacy of environmental footprint tools. Environmental Research Letters, 15(9), 091001, 1–4. https://doi.org/10.1088/1748-9326/ab9968
- Sörqvist, P., Hedblom, D., Holmgren, M., Haga, A., Langeborg, L., Nöstl, A., & Kågström, J. (2013). Who needs cream and sugar when there is eco-labeling? Taste and willingness to pay for “eco-friendly” coffee. PLOS ONE, 8(12), e80719, 1–9. https://doi.org/10.1371/journal.pone.0080719
- Sörqvist, P., & Langeborg, L. (2019). Why people harm the environment although they try to treat it well: An evolutionary-cognitive perspective on climate compensation. Frontiers in Psychology, 10, 348, 1–5. https://doi.org/10.3389/fpsyg.2019.00348
- Tiefenbeck, V., Staake, T., Roth, K., & Sachs, O. (2013). For better or for worse? Empirical evidence of moral licensing in a behavioral energy conservation campaign. Energy Policy, 57, 160–171. https://doi.org/10.1016/j.enpol.2013.01.021
- Truelove, H. B., Carrico, A. R., Weber, E. U., Raimi, K. T., & Vandenbergh, M. P. (2014). Positive and negative spillover of pro-environmental behavior: An integrative review and theoretical framework. Global Environmental Change, 29, 127–138. https://doi.org/10.1016/j.gloenvcha.2014.09.004
- van den Broek, K. L., & Walker, I. (2019). Heuristics in energy judgement tasks. Journal of Environmental Psychology, 62, 95–104. https://doi.org/10.1016/j.jenvp.2019.02.008
- Weaver, K., Hock, S. J., & Garcia, S. M. (2016). “Top 10” reasons: When adding persuasive arguments reduces persuasion. Marketing Letters, 27(1), 27–38. https://doi.org/10.1007/s11002-014-9286-1
- Weber, E. U. (1997). Perception and expectation of climate change: Precondition for economic and technological adaptation. In M. H. Bazerman, D. M. Messick, A. E. Tenbrunsel, & K. A. Wade-Benzoni (Eds.), Environment, ethics, and behavior: The psychology of environmental valuation and degradation (pp. 314–341). The New Lexington Press.
- Wertheimer, M. (1945/1959). Productive thinking. Harper & Row.
- Zaval, L., Keenan, E. A., Johnson, E. J., & Weber, E. U. (2014). How warm days increase belief in global warming. Nature Climate Change, 4(2), 143–147. https://doi.org/10.1038/nclimate2093