
 ?Mathematical formulae have been encoded as MathML and are displayed in this HTML version using MathJax in order to improve their display. Uncheck the box to turn MathJax off. This feature requires Javascript. Click on a formula to zoom.
ABSTRACT
While research in Cognitive Psychology has investigated people’s ability to use feedback to pursue a single goal, little research has addressed their ability to use feedback to pursue multiple goals. We investigated the reasons for the sequential goal pursuit observed in previous research using a multiple-cue-probability learning task aiming at teaching energy efficiency, specifically, if it derives from cognitive constraints. The task was to balance utility (comfort) against cost, with an explicit budget for both variables (Experiment 1); with utility expressed in an accessible unit (Experiment 2); and with utility represented by a linear function (Experiment 3). The results suggest that the sequential goal pursuit behaviour is driven by limits on cognitive capacity that are little affected by training and goal phrasing. One cognitive constraint was the difficulty with interpreting the effect of actions on the nonlinear utility, which reinforced an initial priority assigned to actions on the linear cost.
Introduction
In many situations, people must deal with conflicting goals, each constituted by continuous attributes that must be balanced. Take the example of being on a diet, where one goal is to lose weight, where each dish, exercise, drink, transport, must be considered in terms of its calories, at the same time as these activities have an internal utility. Cutting calories to a minimum is not a solution, because then the internal utility will become too low, and chances are that the person will abandon the weight loss scheme. Instead, the person needs to take care to obtain sufficient utility to make life bearable, at the lowest cost in terms of calories.
One potential bottleneck for performance in such optimisation tasks is limits on information processing capacity, which has been the bread and butter of cognitive psychology since its inception (Anderson et al., Citation2004; Salvucci & Taatgen, Citation2008). Most of this research on information processing constraints, however, concerns the pursuit of single goals, typically maximal accuracy or reward, in rather simple tasks. In our weight loss example, by contrast, people must learn to balance different goals, that may be competing for the same limited pool of resources in terms of attention and time; conflicting in the sense that high achievement of one goal (weight loss) implies low achievement of the other (utility); and incommensurable in the sense that that the goals may be inherently difficult to compare on a “common scale”.
In this study, we bring these issues together, situating the problem of multiple-goal pursuit in the context of people’s cognitive ability to minimise the cost of energy use while, at the same time, maximising the utility obtained from this cost. This task captures an important class of everyday situations requiring us to minimise the cost of consumption in a domain, while maximising a nonlinear utility with a diminishing marginal return. In contrast to previous studies in multi-goal pursuit (Ballard et al., Citation2016; Northcraft et al., Citation2011) this involves control of two simultaneous and continuous goals that refers to a large set of potential actions.
Research (Ballard et al., Citation2016) has documented three types of strategies for pursuing multiple goals: (i) sequential, (ii) concurrent, and (iii) simultaneous, where the latter is possible if two goals share a means (or a configuration of means) to fulfil both goals. In our task (described in detail below) with many possible actions, simultaneous goal pursuit is possible early in training by the appropriate configuration of actions, but because it is an optimisation task, it becomes increasingly difficult later in training. But the participants are also free to engage in sequential goal pursuit, first resolving one goal, then turning to the other goal, or to concurrent goal pursuit, continuously shifting between the goals over time. Previous research has addressed the architectural constraints, like the availability of multi-final means (Kruglanski et al., Citation2002) and possible consequences in the form of goal dilution (Zhang et al., Citation2007) in simpler multiple-goal pursuit tasks. Previous investigations (e.g. Ballard et al., Citation2016; Juslin et al., Citation2016) of multi-goal pursuit show that people often try to satisfy one goal, thereafter addressing the other, which raises two questions: What are the causes of this sequential goal pursuit? Does it derive from information-processing constraints or from more incidental aspects of how people interpret the task; If goals are pursued sequentially, what determines the priority assigned to the goals?
Feedback learning and the pursuit of multiple goals
Single goal pursuit. Research on feedback learning has mainly addressed the pursuit of a single hedonic or epistemic goal or has reduced multiple-goal pursuit to optimisation of a single goal function, typically in simple information processing tasks. Early research on classical conditioning (Rescorla, Citation1988), knowledge of results (Bilodeau et al., Citation1959), and operant conditioning (Skinner, Citation1938; Thorndike, Citation1927) thus typically referred to the maximisation of “reward” or minimisation of “surprise”. Present-day models of category learning (Ashby & Valentin, Citation2017) and reinforcement learning (Sutton & Barto, Citation2018) likewise emphasise accuracy or minimisation of the “reward prediction error”, often viewed as an interplay between model-based and model-free processes (Daw et al., Citation2011). A more complex task, though still emphasising a single goal, is multiple-cue-probability learning (MCPL). On each trial, the participants use metric cues to estimate a metric criterion and receive outcome feedback on the correct criterion. The goal is to minimise the prediction error between the estimates and the criterion. Learning tends to be slow (Brehmer, Citation1994), especially if the feedback is frequent and probabilistic or if the cues combine non-linearly (Slovic, Citation1974), and people often integrate a few of the cues in an inconsistent manner (Brehmer, Citation1994). Furthermore, regardless of the true functional relationship between the cues and the criterion, people often tend to engage in linear and additive cue integration (Juslin et al., Citation2008; Karelaia & Hogarth, Citation2008).
The area apparently relating most strongly to conflicting goals is decision making, where different outcomes are weighted against each other (Keeney & Raiffa, Citation1993). However, most of this research has been concerned with feedforwardFootnote1 optimisation of a single utility or expected utility (goal) function (Newell et al., Citation2015). Despite the obvious analytic convenience of a single goal function, it also threatens to trivialise the real challenge involved in negotiating multiple incommensurable goals. Only recently there has been a resurgence of interest in feedback learning in decision making with the arrival of the decisions from experience paradigm (Hertwig & Erev, Citation2009), although still concerned with the goal of maximising a single net return.
Multi-goal pursuit. Research in social psychology has arguably put more emphasis on pursuit of qualitatively distinct goals. Goal-system theory (Kopetz et al., Citation2012; Kruglanski et al., Citation2002), for example, highlights the importance of the architecture of the goal system. Sometimes multiple goals may be associated with a single means, allowing for simultaneous goal pursuit: Eating vegetarian food satisfies both a sustainability goal and a health goal. However, multi-final means are also often associated with goal-dilution (Zhang et al., Citation2007), leading to attenuated relationships between the means and each of the goals.
When the task does not allow for simultaneous goal pursuit people may engage in sequential goal pursuit. In goal-shielding (Lindenberg & Steg, Citation2007; Shah et al., Citation2002) one focal goal inhibits the activation of the other goal(s), as when a person may choose to focus on the family while inhibiting professional goals (Kopetz et al., Citation2012). Also here, however, alternative goals may intrude, leading to lower attention on the focal goal and to poorer performance (Orehek & Vazeou-Nieuwenhuis, Citation2013). When perceiving progress, people may either increase activation of the alternative goal (Fishbach et al., Citation2006) or increase activation of the focal goal (Fishbach & Labroo, Citation2007). Goals that conflict, as when a teenager is given extra homework at the same time as her swim coach wants her to increase her weekly training, often leads to poorer performance (Locke, et al., Citation1994). In addition, research has found that when the dual-task expectancy is high, the goal with the larger discrepancy is prioritised, and, conversely, when the dual-task expectancy is low, the goal with the least discrepancy is prioritised (Schmidt & Dolis, Citation2009). Finally, Northcraft et al. (Citation2011) investigated multi-goal pursuit with a college schedule task, where participants were given five rules to construct as many college schedules as possible during a pre-defined time period. Results showed that performance was best when the feedback was timely and specific and that allocation of time was driven by the same feedback.
Ballard et al. (Citation2016) used a sequential sampling model (MGPM*) to investigate how people pursued multiple goals during approach and avoidance goals with or without time pressure. The participants performed an air-traffic control task in which they had to choose either the upper or the lower route to avoid the intersection of a military aircraft. Results showed that those with a high time sensitivity used a sequential goal strategy, beginning with the goal with the highest probability of fulfilment. Those with a low time sensitivity used a concurrent goal strategy, constantly switching between the goals across the successive trials.
I sum: when multi-final means are available, goals can be pursued simultaneously, leading to improvement of both goals with the same actions. However, multi-final means are often associated with goal-dilution leading to attenuation of the strength of the relationship between the means and the goals. For this reason—or because the task does not allow for simultaneous goal pursuit—people often turn either to sequential goal pursuit, first resolving one goal, then turning to the other goal, or to concurrent goal pursuit, continuously shifting from trial to trial between actions that pursue either of the goals over time, depending on contextual factors.
A multi-goal pursuit paradigm. In the present study, we use an energy-consumption paradigm which expands on previous studies on multiple-goal pursuit in four ways: (i) There are more potential actions (cues), in total 18 appliances (temperature, lightning, etc.), whose precise effects on the goals have to be learned from the outcome feedback, thus a multiple-cue probability learning task. (ii) The participant must balance two goals (cost & utility) that compete for time and attention; partially are in conflict (increased utility often comes at an increased cost), and are expressed on different scales. (iii) It takes into account that, whereas the external cost signal is typically on a linear scale, the utility (or benefit) of consumption is typically nonlinear with a diminishing marginal return. (iv) The participants not only have to learn to predict but also to control the system with their configuration of actions.
Previous research with this paradigm (Guath et al., Citation2015; Juslin et al., Citation2016) replicated several results reviewed above: First, as suggested by research on multiple-cue judgment (Brehmer, Citation1994), the participants had difficulty with interpreting frequent feedback with random noise in the feedback (Juslin et al., Citation2016) and goal attainment therefore improved when feedback was aggregated across time (see also Lurie & Swaminathan, Citation2009). Second, the participants with initial feedforward training showed significantly less variability in their goal attainment (Guath et al., Citation2015) than those without training, presumably, because feedforward training led to more clearly formulated goals (Locke et al., Citation1989). Third, because there were 18 different appliances that could be used, at least initially the participants could engage in simultaneous goal pursuit, implementing actions on the same trial that both decrease the total cost and increase the total utility. The participants, however, primarily adopted a sequential strategy as suggested in previous research on multiple-goal pursuit (e.g. Ballard et al., Citation2016).
The present study
The energy consumption task (Juslin et al., Citation2016) is representative of a wide set of cost-benefit optimisation tasks that we encounter in our everyday life, and the results may, therefore, potentially, have broad implications. We use the paradigm to investigate the reasons for the observed sequentiality that has often been observed in the previous studies (e.g. Ballard et al., Citation2016; Juslin et al., Citation2016), that is, what factors invite a sequential strategy and what determines how people prioritise their goals. In addition, it complements previous research by combining a multiple-cue (or action) task with a multi-goal task. In Northcraft et al. (Citation2011), for example, only one goal was considered at the time (one of four college schedules) and in Ballard et al. (Citation2016) the goals are dichotomous (choosing a route that does not conflict with other airline routes).
In Experiment 1, we investigated the cause of the sequential goal pursuit. One possibility is that the participants in previous studies, accidentally, came to interpret the instructions as implying a prioritisation of cost, but that they would have been capable to pursue both goals if the task and the instruction had only encouraged them more to do so (a “Task Interpretation Hypothesis”). A second possibility is that, although simultaneous goal pursuit is a viable and effective strategy, because of individual differences in working memory people are differently able to effectively pursue two goals simultaneously (a “Working Memory Hypothesis”). A third alternative is that simultaneous goal pursuit is inherently futile, and that the other strategies—apparently often sequential but, in principle, possibly also the concurrent strategy—are in practice the only effective adaptions to the task (“Task Adaptation Hypothesis”). Also with this hypothesis, information-processing constraints are relevant in the species-general sense that the computations required for successful implementation may be beyond the abilities of any human, with the implication is that all participants have to adapt to the task by other strategies.
Specifically, in Experiment 1 we defined explicit budgets both for the cost and the utility, thus equating the specificity and salience of the two goals. To test if cognitive limitations explain the inclination for sequential goal pursuit, we added a working memory task (Unsworth et al., Citation2005; Unsworth & Engle, Citation2008) prior to the simulated household task. The Working Memory Hypothesis predicts (i) a positive correlation between working memory capacity and goal attainment. This correlation should, in turn, be mediated by (ii) a positive correlation between working memory capacity and simultaneous goal pursuit and between (iii) simultaneous goal pursuit and goal attainment. This pattern of correlations would indicate that simultaneous goal pursuit is a good strategy, although people often fall short of using it because of their limited working memory capacity. An alternative is that simultaneous goal pursuit is not a viable strategy and that it does not mediate or predict successful goal attainment of the task.
In Experiment 2, we investigated why the participants in previous experiments seemed to prioritise to reduce the cost initially, before they started to increase the utility. Was this an arbitrary adaptation to the task and the instructions or does it reflect some more general property of these cost-utility optimisation tasks? Specifically, we reframed the feedback for both cost and utility in terms of the same common metric (money). We predicted that the utility would now be easier to evaluate and, as a consequence, that it would receive more initial attention (Hsee & Zhang, Citation2010).
Finally, in Experiment 3 we investigated if transforming the non-linear utility function to a linear function made it easier to attend equally to both cost and utility. In this study, we investigated the reasons why people pursue multiple goals sequentially and what determines their goal prioritisation, by making the goals as equal in salience as possible in three experiments, and by measuring both the goal attainment and the multi-goal pursuit strategy.
Experiment 1: budgets both for cost and utility
In Experiment 1, we investigated the reasons for sequential goal pursuit by defining explicit budgets for both cost and utility and adding a working memory task. In the Focus Cost Condition, cost minimisation was highlighted by an explicit budget for the maximal cost expended. In the Focus Utility Condition, utility maximisation was highlighted by an explicit budget for the minimal utility that must be obtained. In the Focus Both Condition, participants received the budgets for both cost and utility. The Task Interpretation Hypothesis predicts that with Focus Both the participants should have a little problem with shifting to simultaneous goal pursuit, once that the budget and instructions assign equal importance to both goals.
The Working Memory Hypotheses predicts that goal attainment in Focus Both is correlated with working memory capacity. The Task Adaptation Hypothesis predicts that there is no correlation between simultaneous goal pursuit and goal attainment in Focus Both—because simultaneous goal pursuit is inherently futile and ineffective—and the participants are thus forced to engage in other strategies to master the task. Because the latter two hypotheses both emphasise cognitive limitations they both predict that, although both goals attainment may improve somewhat with Focus Both, there is a price of attending to both goals. Focus Both will therefore exhibit a poorer cost goal achievement than participants with Focus Cost and a poorer utility goal achievement than participants with Focus Utility. Previous research (Ballard et al., Citation2016) shows that formulation of deadlines may affect whether people engage in sequential or concurrent goal pursuit. We thus also investigated if a deadline would change the goal pursuit by telling half of the participants in each condition, on each trial, about the number of remaining trials they were allowed to train, while the other half received no such information.
Method
Participants. One-hundred students at Uppsala University volunteered to participate and were compensated with a cinema ticket (worth approximately $10) or by course credit. The sample consisted of 76 women and 24 men, with mean age 24.1 years (SD = 5.4).
Design. The experiment was a 3 × 2 × 28 mixed factorial design with Goal Focus and Explicit Limit on the training trials or not as between-subjects’ variables, and Trial (simulated day) as within-subjects’ variable. Henceforth, the group with a specific goal for cost and an unspecific for utility is called Focus Cost, the group with a specific goal for utility and an unspecific for cost is called Focus Utility, and finally, the group with specific goals for both utility and cost is called Focus Both. In each group, the limit on number of trials was specified for half of the participants, that is 28 days. Dependent measures were Aospan, ability to satisfy the cost goal, the utility goal, and both goals, and the trajectory in the cost-utility space (see below for more details).
Material and procedure. The experiment consisted of two parts, first a working memory test and then an outcome feedback training phase in the simulated household for 28 simulated days.
Aospan. Working memory capacity was measured with the Automated Operation Span test (Unsworth & Engle, Citation2008). The practice session was divided into three parts: a letter span recognition task, a math operation task, and a combined letter and math task. After the practice, the real trials were presented: 75 letters and 75 math problems were randomly presented for each participant. The programme computed five scores for each participant, and we used the Ospan score (all perfectly recalled sets) as a dependent measure for working memory.Footnote2
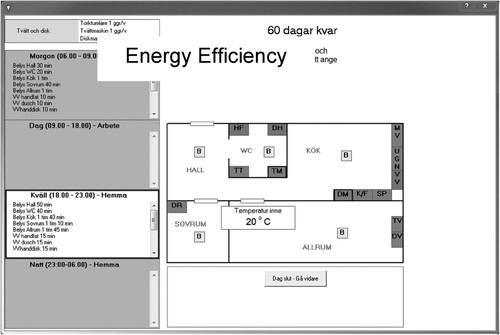
Simulated household task. To test and train participants to regulate their electricity consumption in a fictive household we used previously developed software (see ). The object of inquiry is the cognitive ability to balance the cost of the electricity consumption against its “utility” under conditions that approximate those relevant with an IHD (In-Home-Display). The participant determined the level of electricity consumption in the simulated home, while adhering to a budget for either the maximum cost, the minimum utility, or both for the cost and the utility. In real life, of course, the signal for the utility of consumption is “internal” and idiosyncratic to the agent. To allow us to objectively observe the balancing of cost and utility goal, the utility signal is “externalized” and provided to participants on the computer screen. In other words, the utility functions were the same for all participants and they refer to the utility (comfort) of the electricity consumption of a fictive inhabitant of the household.
The task was thus to learn efficiently to balance the cost and utility of the electricity consumption according to the instruction in each condition. For every new day, the participant decided on indoor temperature, hours of lighting in different rooms, the hot water consumption etc. The utility from each activity and the total utility that day were presented on the screen, indicating how much comfort each activity gave the fictive inhabitant. Feedback on the cost was presented after each day in terms of kWh used and cost in SEK. The participants received feedback on the cost for each of the 18 applications, in addition to the total cost expressed as the monthly cost of the current settings if this consumption was maintained for 30 days (for the cost equation see online Appendix 2). If the budget of 2000 SEK per month was exceeded, the total cost was red-lighted, if not it was green-lighted. A normally and independently distributed random error with standard deviation equal to 5% of the cost was added to the cost of each appliance to represent the irrelevant factors that may affect the feedback given at any given moment (e.g. imprecision in the feedback instrument, interactions between appliances and exogenous factors).
Figure 1. The computer display that confronted the participants in the simulated household task. On each simulated day the participant indicated the daily use of the electricity consuming applications and the fictive household inhabitant’s utility from the consumption was conveyed by horizontal bars on the right side of the display (not shown in the figure in Panel A). Feedback about the cost of electricity consumption wass presented after a simulated day in a separate display.
Goal instructions. The participants were given the same feedback on utility and cost, but the instructions differed in what goal(s) were specified. The participants received one of six instructions, adapted to each condition, about the goal(s) and explicit limit of trials/no explicit limit of trials for the task to regulate the electricity consumption for the fictive person in the simulated household. The instruction only differed on the independent variables. For instance, in the both goal no time-limit condition the feedback was described as:
After each day, you will receive a report about how satisfied Peter [the fictive inhabitant] is and how high the monthly cost would be with the current settings. The maximum monthly consumption is 2000 SEK and in order for Peter to be satisfied in the fictive small house the utility points should be at least 285 (per month).
Your task is to, before the 28 days are past, to see to that Peter keeps the stated monthly budget of 2000 SEK at the same time as the utility points are above 285.
Your task is, thus, to see to that Peter both keeps his monthly budget of 2000 SEK at the same time as he gets as much utility as possible of his electricity consumption.
Your task is to see to that Peter has at least 285 utility points at the same time as the monthly cost should be kept as low as possible.
Dependent measures. Goal attainment was analysed with survival analysis, a statistical method for binary outcomes. We used the Cox model, a proportional hazards regression model where the dependent variable is the hazard function, the number of individuals experiencing an event at time t divided by the number of individuals not experiencing the event. The output of the regression model is the proportional change in the hazard related to each explanatory variable (Walters, Citation2012). In the present context, the hazard function is defined with respect to the proportion of participants not achieving the cost and/or utility goals. The model output is the hazard ratio (HR) for each level of the independent variable. The baseline condition is given hazard ratio 1 and hazard ratios >1 indicate an increased chance of meeting the goal, whereas hazard ratios <1 indicate a decreased chance of meeting the goal. We used the survival package in R (Therneau, Citation2020) to analyse data (Bradburn et al., Citation2003). Goal achievement for cost was defined as the first trial with a cost ≤ 66.67 SEK; goal achievement for utility as the first trial with a utility ≥ .908, and goal achievement for both goals as satisfaction of both of these criteria.Footnote3
The Both Goal Score (BGS) analysed the direction of the movement in , which discloses what goal(s) are improved by the actions performed on a given trial. Movements upwards to the right in the diagram improves one goal (G = 1), utility is increased. Movements upwards to the left improve both goals (G = 2), decreased cost and increased utility. Movements downwards to the left improves one goal, cost is decreased (G = 1). Movements downwards to the right, lead to poorer achievement of both goals (G = 0). The BGS is the average number of goals (G) improved across N trials,
(1)
(1) running between 0 (no goal ever improved) to 2 (both goals always improved).
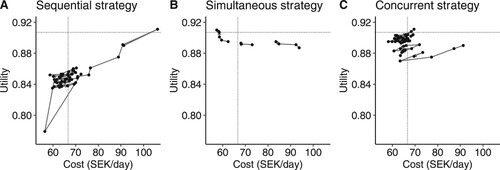
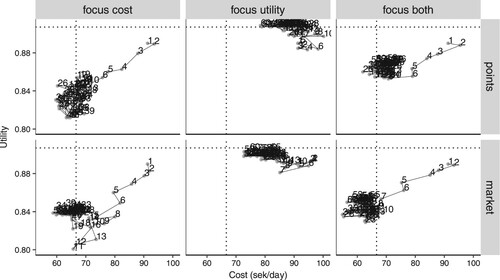
Figure 2. Example from three participants in the current study, adopting three different both goals strategies. Panel A depicts a participant from Experiment 2, adopting a sequential strategy, first satisfying the cost goal, then the utility goal. Panel B depicts a participant from Experiment 2 adopting a simultaneous strategy, moving in both directions on 10 out 21 trials before meeting both goals on trial 21. For illustrative purposes we have only plotted trials on which both goals are attended to. Panel C depicts a participant from Experiment 2, adopting a concurrent goal strategy, intermittently changing between the cost and utility goal. The vertical dotted line is the budget constraint (67 SEK/day) and the horizontal dotted line is the utility goal (0.91).
The Selective Focus Score (SFS) captures the extent to which the participants selectively prioritised one of the goals and what goal was prioritised on each trial. For each participant and trial, the trial was scored by – 1 if the participant only improved the utility goal, with 1 if the participants only improved the cost goal, and with 0 if both or none of the goals were improved. The SFS was correlated with the trial number n, where the correlation identified the goal prioritised in the sequential strategies. A negative correlation indicated a sequential strategy starting with the cost goal, a positive indicated a sequential strategy starting with the utility goal. A zero correlation indicated that the agent switched between each goal (cost & utility) on each trial, a concurrent strategy (, Panel C). Because both of the dimensions in (cost & utility) were measured on arbitrary and incommensurable scales (i.e. there is no way in which to weight a unit cost against a unit utility), these scores concentrated on the directions of movement in the space rather than their magnitudes and coded for the number of goals, zero, one or two, for which the state was improved on each trial.Footnote4
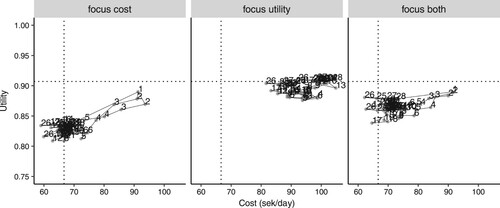
Figure 3. The mean total utility as a function of the mean total cost for each day (the numbers 1–28 in the graph) in each focus condition. The vertical dotted line depicts the maximum cost per day stipulated by the cost budget and the horizontal dotted line depicts the minimum utility per day stipulated by the utility budget.
Results and discussion
The data were aggregated into a total cost and a total utility for each of the 28 days for each participant and the means are plotted in for each focus condition.Footnote5 The participants clearly emphasise the goal that is highlighted by a budget in the instruction. In Focus Cost, they first travel down to the left to minimise the cost and then adjust the utility. In Focus Utility, they stay at high utility and do not move around a lot. In Focus Both, they make the same travel as in Focus Cost, but with a smaller angle, trying to attend more to both cost and utility. That the participants were clearly affected by the goal instruction in the intended manner serves as a manipulation check (i.e. shows that they understood and acted on the instructions).
Correlations between Aospan, goal attainment, and the both goals score (BGS). We computed the proportions of cost—utility—and both goals achievement across the 28 trials for each participant. There were low correlations between Aospan and proportion of cost goal achievement (rτ = .15, BF10 = 1.64, BF01 = 0.63)Footnote6, between Aospan and proportion of both goals achievement (r = .15, BF10 = 1.36, BF01 = 0.73), and between Aospan and proportion of utility goal achievement (r = −0.06, BF10 = 0.19, BF01 = 6.62). The correlation between Aospan and BGS was very small (r = .044, BF10 = 0.16, BF01 = 6.20), and consequently there was support for the null hypothesis (BF01 = 6.20). Thus, there was no evidence that those with large rather than small working memory capacity achieved the goals to a larger extent in a way that was mediated by a larger rate of simultaneous goal pursuit.
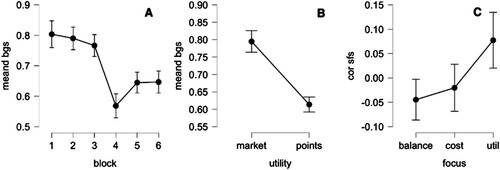
How multi-goal pursuit was affected by focus instructions and time limit. To investigate the rate of simultaneous goal pursuit—how often the actions on a trial improved both goals on the next trial—and how this was affected by the independent variables, the BGS was entered into a 3 (focus condition, between-subjects) × 2 (explicit limits on trials or not, between-subjects) × 4 (training blocks á 7 trials each) mixed factorial Bayesian ANOVA. Results (Table S1 in online Appendix 3) showed that the data supported a model including only a main effect of Training Block (BF10 = 3.54e15) with decisive evidence against the null model. To evaluate the support for the inclusion of each independent variable across all the models we computed the Bayes Factors for inclusion (BFincl) for each term.Footnote7 The results provided strong evidence in favour of including Training Block (BFincl = ∞), but evidence against including Focus (BFincl = 0.24), Time Limit (BFincl = 0.06) as well as the higher interactions (all BFincl < 0.08). The effect of Training Block is depicted in Panel A, , showing that the mean BGS gradually declined as the training progressed. The decreasing BGS as a function of the training blocks reflects that, in this optimisation task, it becomes increasingly difficult to improve further on the goals later in training.
Figure 4. Panel A: On the y-axis the mean BGS is plotted against each Training Block (x-axis), with 95% credible intervals. Panel B: On the y-axis the mean Fisher corrected correlation between day and SFS is plotted against each Focus (x-axis), with 95% credible intervals.
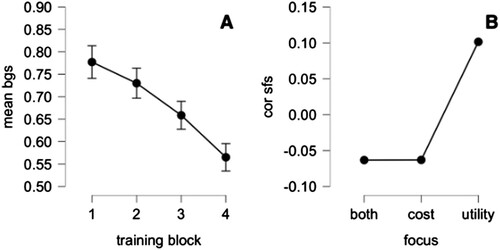
To probe for sequential strategies, the SFS was correlated with trial (day) and the Fisher-transformed correlations were entered into between-subjects Bayesian ANOVA with Time Limit or not and Goal Focus as independent variables. The model (Table S2) best supported by data was one with a main effect of Focus (BF10 = 1.44e3, BFincl = 1053.39), the effects of the goal focus are depicted in , Panel B. There was no support for including Time Limit (BF10 = 0.23), nor for the inclusion of the interaction between Focus and Time Limit (BF10 = 0.37).
Focus Both and Cost showed negative mean correlations, suggesting a sequential strategy with an initial priority on reducing cost, thereafter increasing utility. The low correlations indicate that these strategies are often interrupted by bursts of concurrent goal pursuit. For Focus Utility the mean correlation is positive, suggesting a sequential strategy, first prioritising utility, thereafter turning to the cost. Although the priority of the goals differs, the low magnitude of the correlations suggests that participants relied on a mix of sequential and concurrent strategies.
Goal attainment analysed with survival analysis. Next, we performed a survival analysis in order to capture the goal achievement. In each focus condition, three Kaplan Meyer survival functions were fitted to data, one for satisfaction of the cost goal, one for satisfaction of the utility goal, and one for satisfaction of both goals, which regress time and the binary goal achievement (0/1) variable against the goal focus.Footnote8 presents estimated proportions of participants that have not reached the goal at training trial t in each of the focus conditions, for each goal. For all three goals, there are clear differences in between the three focus conditions in the goal satisfaction. We fitted three Cox Proportional Hazard (Cox PH) models to the data. All results from the Cox regression are reported in .
Figure 5. The y-axis depicts the predicted proportion of the participants that has not yet satisfied the cost goal (left panel) the utility goal (middle panel), and both goals (right panel) in each of the focus conditions, Focus Both, Focus Cost and Focus Utility, after each of the 28 training trials t (simulated days in the household) (x-axis).
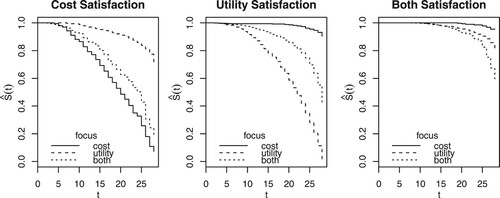
Table 1. Hazard ratios, coefficients, CIs and P-values for the cost goal satisfaction model, utility goal satisfaction model, and the both goals satisfaction model.
For each goal model (cost, utility, both goals), the corresponding goal focus condition outperformed the other conditions. Participants with focus Both (HR = 1 by default) were twice as likely as those with Focus Utility (HR = .51) and ten times (HR = .10) as likely as those with Focus Cost to achieve both of the goals. But, crucially, the participants in the Focus Cost Condition were 58% (HR = 1.58) more likely to satisfy the cost goal and the participants in the Focus Utility Condition were 262% (HR = 3.6) more likely to satisfy the utility goal than the participants in the Focus Both Condition. Crucially, increased simultaneous attention to both goals thus had a substantial negative effect on the satisfaction of the individual goals as compared to when the participants could prioritise only one of the goals to a larger extent.
To sum up, the participants adapted to the goal instructions but seem cognitively constrained in their ability to pursue both goals simultaneously, because attending to both goals had a cost in regard to achievement of the individual goals. Concerning the question why people engage in sequential goal pursuit, the Task Adaptation Hypotheses thus received the most support. The pursuit of two goals seems cognitively constrained also with instructions that emphasise both goals. Yet, the goal attainment is not mediated by working memory capacity, so successful goal attainment depends on shifting from multiple-goal pursuit to another strategy. In regard to what determines the priority of the goals, the results were more puzzling, as participants were given explicit budgets both for cost and utility, still initially prioritised the cost over the utility.
Experiment 2: cost and utility on money scales
In Experiment 2, we wanted to further investigate why, even when there was a budget both for the cost and the utility (Focus Both), actions concerned only with cost reduction were performed initially, whereas participants were relatively more concerned with utility later in the training (i.e. producing the same, first left-downwards movement, then upwards movement as for Focus Cost in ). We also wanted to explore if the limited ability to attend to two goals could be improved by giving the participants additional training trials.
In Experiment 1, the utility was unfamiliar to the participant and in arbitrary units, whereas the cost unit (SEK) was already familiar. Evaluability (Hsee & Zhang, Citation2010) refers to the extent to which a person has relevant information to evaluate a value. The larger evaluability of the cost may therefore have caused the participants to concentrate initially on the cost. To equate the goals also in this respect, we transformed utility into SEK, the same unit as for the cost. If a greater evaluability is important for attending earlier to the utility, this should result in similar initial attention to both the cost and the utility.
Method
Participants. Eighty-nine students at Uppsala University volunteered to participate and were compensated with a cinema ticket (worth approximately $10) or by course credit. The sample consisted of 56 women and 33 men, with mean age 27.9 years (SD = 12.5).
Design. The experiment was a 3 × 2 × 60 mixed design, with Goal Focus and Utility Wording as between-subjects variables, and Trial (simulated day) as within-subjects variable. All participants spent 60 days in the simulated house and were randomised to the conditions. In each group, half of the participants were informed about the utility in utility points as in Experiment 1. For the other half, the utility was transformed into money by introducing the cover story, described below. The dependent measures were the same as in Experiment 1, except for Aospan, which was not included due to evidence for a null correlation between working memory capacity and simultaneous goal pursuit in Experiment 1 (at N = 100).
Material and procedure. In the Utility Points Condition, the information about the utility was conveyed by abstract utility points, as in Experiment 1. When the utility was conveyed as market value, the participants were told that they were to act as fictive landlords, seeking to optimise the cost for renting out their small houses. On the one hand, they have an interest in minimising the monthly electricity cost for their houses, on the other hand, the potential residents must be satisfied to be willing to pay for living in the house. The utility for the residents is conceptualised as the market value of the house, with a minimum of 2850 SEK/month. The cost is the actual cost for the fictive landlord, so in order to maximise the profit, the participants should minimise the cost and maximise the market value. The utility is given as a market price and was obtained by multiplying the utility feedback in the Utility Points Condition by ten (e.g. 285 utility points become 2850 SEK in utility market). It was given, as in the Utility Points Condition, both as a monthly and daily sum, in the same way as the electricity cost for the house (also given as monthly and daily sum). In other respects, the materials and procedures were the same as in Experiment 1.
Results and discussion
As illustrated in , for both Utility Points and Utility Market the patterns for the travel in the cost-utility space reproduces those in of Experiment 1: participants emphasise the goal that is highlighted by a budget in the instruction, again validating that the participants responded to the instructions in the different conditions. However, Utility Market seems to produce lower cost in the Focus Utility and Focus Both conditions.
Figure 6. The mean total utility as a function of the mean total cost for each day (the numbers 1–28 in the graph) in each focus condition and time/no time pressure. The vertical dotted line depicts the maximum cost per day stipulated by the cost budget and the horizontal dotted line depicts the minimum utility per day stipulated by the utility budget.
How multi-goal pursuit was affected by instructions and common metric. We analysed the BGS with a 2 × 3 × 6 mixed factorial Bayesian ANOVA with Utility Wording (points/market) and Goal Focus as between-subjects variables and Block as within-subjects variable.Footnote9 The model (Table S3) best supported by data contained main effects of Training Block and Utility Condition (BF10 = 9.87e26), as depicted in , Panels A and B, with decisive evidence against the null model. The BFs for including the independent variables in the models, likewise support inclusion of Training Block (BFincl = 2.92e14) and Utility Condition (BFincl = 9.02e6), whereas there was strong evidence against including Focus (BFincl = 0.03). Although all mean BGS are distinctly below one, the expression of both goal variables in terms of money seems to have elicited somewhat more both goal pursuit. Given the generally low BGS, the dip in Block 4 may be the result of a transition from focusing on one of the goals to the other.
Figure 7. Panel A: On the y-axis the mean BGS is plotted against each Training Block (x-axis), with 95% credible intervals. Panel B: On the y-axis the mean BGS plotted against each Utility Condition (x-axis), with 95% credible intervals. Panel C: On the y-axis the mean Fisher corrected correlation between day and SFS is plotted against each Focus (x-axis), with 95% credible intervals.
A factorial 3 × 2 between-subjects Bayesian ANOVA on Fisher transformed correlations between the SFS and trial number showed that the model (Table S4) best supported by data was one with a main effect of Focus (BF10 = 24.04) depicted in , Panel C. There was support for including Focus (BFincl = 18.10) in the models, but evidence against including Utility Condition (BFincl = 0.26). The correlations followed the same pattern as in Experiment 1, except for Focus Cost, whose correlation was not distinct from 0, indicating at concurrent goal pursuit. As in Experiment 1, there is no evidence for simultaneous goal pursuit.
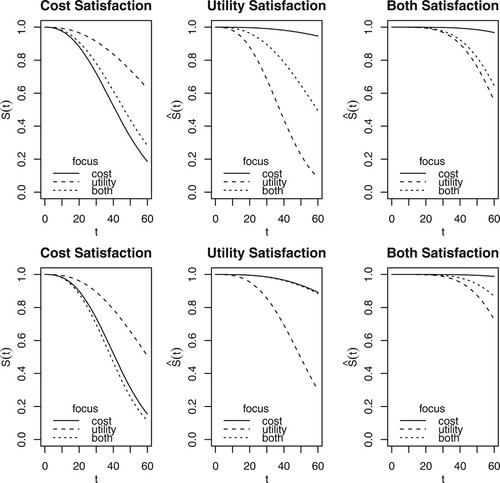
How is goal attainment affected by goal focus and a common metric? As illustrated in , in each between-subjects cell of the design, data were analysed with three survival functions, one for cost, one for utility, and one for both goals. Because data violated the proportional hazards assumed with Cox regression, we used a parametric survival analysis called Accelerated Failure Time modelsFootnote10 (AFT models) that permit the specification of a Weibull distribution, which is recommended for time-varying survival curves (Tabachnick & Fidell, Citation2013).Footnote11 We fitted three AFT models with the survival package in R (Therneau, Citation2020), one for each goal. To facilitate interpretation and comparison with the results from Experiment 1, the output from the AFT models was transformed into proportional hazard (HR) coefficients. The best-fitting model included a significant interaction between Goal Focus and Utility Wording.
Figure 8. Accelerated Failures Models with Weibull distributions for each goal (Cost, Utility, & Both), applied separately for Utility Points (upper panels) and to Market Utility (lower panels). The y-axis is the estimated proportion of the participants not reaching each goal for each day of the 60 days (x-axis), as a function of the Goal Focus and the Utility Wording conditions.
Time (60 days) and goal satisfaction (1/0) were thus regressed against Goal Focus and Utility Wording. Focus Both and Utility Points are baseline conditions with ß = 0 and HR = 1 by default. report results separately for each goal. To interpret the interactions, we also computed the effect sizes (HR) for each individual cell in the 2 × 3 experimental design (i.e. essentially the HR for main effects and interaction effects are multiplied), which are reported in online Appendix 3 (Tables C5 and C6). For visual illustration of the effects we refer to .
Table 2. Hazard ratios, coefficients, CIs and P-values for the main effects and the interactions in the cost goal satisfaction model.
Table 3. Hazard ratios, coefficients, CIs and P-values for the main effects and the interactions in the utility goal satisfaction model.
Table 4. Hazard ratios, coefficients, CIs and P-values for the main effects and the interaction in the both goal satisfaction mod.
Replicating Experiment 1, the cost model () reveals that Focus Cost (HR = 1.33) was better than Focus Both (HR = 1.00) and Focus Utility (HR = .37) was poorer than Focus Both (HR = 1.00) at satisfying the cost goal, suggesting that there is an app. 25% (.33/1.33) goal attainment price paid when attending equally to both goals as compared to when concentrating more on the cost. A significant main effect suggested that participants in the Utility Market condition displayed 61% higher cost satisfaction than Utility Points (HR = 1.61), but this effect was qualified by an interaction between Focus Cost and Utility Market.
The Focus Cost × Market interaction (left-side panels of ) amounts to an improved cost goal satisfaction when we go from Utility Points to Utility Market with Focus Both (HR goes from 1.00 to 1.60, a 60% improvement) and with Focus Utility (HR goes from .39 to .50, a 36% improvement), but not with Focus Cost (from 1.33 to 1.38, a modest 4% improvement).Footnote12 The expression of utility as money (Utility Market) thus had no effect on the participants' cost goal satisfaction when they were mainly concentrating on cost (Focus Cost) but improved the cost goal satisfaction when they partially or wholly were concentrating on utility (the Focus Both and Focus Utility conditions, respectively).
As in Experiment 1, the utility satisfaction in is much (243%) higher with Focus Utility (HR = 3.43) than with Focus Both (HR = 1.00), suggesting a large improvement when concentrating on a budget for utility as compared to attending to budgets for both goals. For Focus Cost (HR = .08), the utility satisfaction is 92% worse than for Focus Both (HR = 1.00). The third significant main effect reveals that Utility Market overall produced 84% poorer utility satisfaction than Utility Points (HR = .16). The significant interactions reveal that this negative effect only occurred with Focus Both (by 86% from 1.00 to 0.16) and with Focus Utility (by 54% from 3.43 to 1.60). With Focus Cost the utility satisfaction HR increased slightly from .08 to .15, going from Utility Points to Utility Market (Table S6).
As illustrated in , while there are clear differences between the focus conditions with Utility Points (the upper central panel), a replication of Experiment 1, the goal attainment with Utility Market (the lower central panel) is poorer and the difference between focusing on cost alone vs. on both goals almost disappears (HR = .16 vs. 15 in Table S6). Expressing utility as money (Utility Market) slightly improved the utility goal satisfaction when the participants concentrated mainly on the cost (Focus Cost) but produced poorer utility satisfaction when they concentrated partially or wholly on the utility goal.
For the both-goals model () there are three significant main effects but no significant interactions. Focus Cost produced 92% poorer both-goal satisfaction (HR = .08) than the baseline Focus Both; Focus Utility produced 35% better both-goal satisfaction (HR = 1.35) than Focus Both; and Utility Market produced 70% poorer both-goal satisfaction (HR = .30) than the baseline given by the Utility Points. In contrast to in Experiment 1, Focus Utility satisfied both of the goals somewhat better than Focus Both.
In sum: when participants concentrated on cost (Focus Cost), there is little effect of expressing utility in arbitrary units (Utility Points) or as money (Utility Market), perhaps because they payed little or no attention to the utility. When participants concentrated mainly or partially on utility (Focus Utility & Focus Both, respectively), the utility goal satisfaction is poorer when the utility is expressed as money (Utility Market), presumably because it was difficult to distinguish between the cost and the utility goals. This also accounts for the somewhat better attainment of the cost goal when participants concentrated partially or wholly on the utility goal. The difficulty to distinguish between the goals could spill over as (accidentally) better cost achievement, when the participants were really (but unsuccessfully) attempting to address the utility goal.
There was no evidence that expressing utility in the familiar unit of money (Utility Market) produced an improved ability for simultaneous goal pursuit, consistent with the Task Adaptation Hypothesis implying that the other strategies are the appropriate adaptations to the task. Relatively more initial priority was assigned still to utility rather than to cost. Finally, the increase in the training trials did not increase the rate of simultaneous goal pursuit, thus adding support for the conclusion that simultaneous goal pursuit is not viable in this task.
Experiment 3: linear vs. nonlinear function form for utility
Experiments 1 and 2 provided support for a Task Adapation Hypothesis, showing a predominantly sequential or concurrent goal pursuit in all focus conditions. In both experiments, the initial movements prioritised large reductions in cost, also when both goals are emphasised by a budget. Yet another possible explanation for this initial prioritisation of cost may be that the utility function is non-linear, whereas the cost function is linear. People, in general, find it more difficult to learn and control non-linear relationships in general (Brehmer, Citation1994; Juslin et al., Citation2008; Karelaia & Hogarth, Citation2008) and, specifically, the effects of manipulating the utility may be less salient and consistent as compared to the consistent linear effect when manipulating the cost. If people find linear cost functions easier to learn than utility functions with a diminishing return, they may be inclined to address the easier cost goal first. In Experiment 3, we thus transformed the utility function for half of the participants so that it related linearly to the consumption, whereas the other half of the participants received the same nonlinear utility functions as in Experiments 1 and 2. Will a linear function for both the cost and the utility make the participants prioritise the two goals more equally?
Method
Participants. Thirty-seven students at Uppsala University volunteered to participate and were compensated with a cinema ticket (worth approximately $10) or by course credit. The sample consisted of 26 women and 11 men, with mean age 26.6 years (SD = 9.6).
Design. The experiment involved a 2 × 60 mixed factorial design, with Utility Function (linear/non-linear) as between-subjects variables, and Trial (simulated day) as within-subjects variable. All participants spent 60 days in the simulated small house and were randomised to one of the conditions. The dependent measures were the same as in Experiments 1 and 2.
Material and procedure. The instructions were the same as in Experiments 1 and 2, except that we only included instructions for Focus Both. In order to set a utility goal for the linear utility function, we piloted the new condition on participants who were given the maximum utility valueFootnote13 as utility goal and the cost goal was set to 2000 SEK (as in the previous experiments). We then used the average utility points for the last day as utility goal for the Linear Utility ConditionFootnote14 (hence Linear Utility). The utility goal for the Non-linear Utility Condition (hence Non-linear Utility) was the same as before, 285 points and the utility goal, estimated in the pilot to be of a comparable difficulty, for the Linear Utility Condition was 168 points. The cost goal was the same for both conditions, namely 2000 SEK/month. In other respects, the material and procedure were the same as in Experiments 1 and 2.
Results and discussion
To investigate simultaneous goal pursuit, we computed a 2 × 6 mixed factorial Bayesian ANOVA on the BGS with Utility Function (linear/non-linear) as between-subjects variable and Block as within-subjects variable. The model (Table S7) best supported by data only included a main effect of Training Block (BF10 = 4.58e13). There was strong overall support for inclusion of Training Block in the model (BFincl = 3.53e13), but not for including Utility Function (BFincl = 0.24).Footnote15 There were no signs of simultaneous goal pursuit (all mean BGS < 0.9).
We computed the SFS and correlated it with trial, and computed a Bayesian t-test on the Fisher-transformed correlations. There was weak evidence of a difference between groups (BF10 = 2.48), with a slighter higher mean correlation for the linear utility function (M = .10, SD = .11) than the non-linear (M = .01, SD = .11). In contrast to Focus Both in Experiments 1 and 2, the mean correlation with Nonlinear Utility was close to zero. The SFS-correlations thus indicate that the initial focus on utility was larger in the condition with a linear utility function.
To measure goal attainment, we calculated the probability of survival for each group by a univariate Kaplan-Meier analysisFootnote16 with three survival functions in each Focus Condition, one for the cost goal, one for the utility goal, and one for the satisfaction of both goals ().
Figure 9. The y-axis depicts the proportion of the participants that have not yet satisfied the cost goal (left panel) the utility goal (middle panel), and both goals (right panel) in each of the utility function groups, Linear Utility and Non-Linear Utility, after each of the 60 training trials t (simulated days in the household) (x-axis).
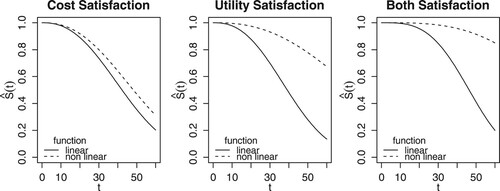
Linear Utility was better at satisfying all three goals the cost goal ((1) = 13.6, p < .001: the left panel of ), the utility goal (
(1) = 374, p < .001): the middle panel of , and both goals (
(1) = 335, p < .001): the right panel of . Indeed, illustrates that with the linear utility function the both goals satisfaction is almost as good as the single goal satisfaction, while there are larger differences with a nonlinear utility. In sum, the linear utility function facilitated the both-goals achievement and increased the initial priority assigned to utility, presumably because small adjustments now gave a clearer effect on the utility points. Notably, this was still achieved with the same mix of sequential and concurrent goal pursuit as in Experiments 1 and 2, with no evidence for simultaneous goal pursuit.
General discussion
In this study, we used an optimisation task with marginal diminishing return, representative of a wide class of everyday tasks where people have to balance the utility (benefit) of consumption against the cost of the consumption. To our knowledge, this is the first study with a task with one linear and one non-linear goal in multiple-cue-probability task. The aim was to uncover what goal strategies people use in such a task and how goal attainment is affected by the simultaneous attendance to both goals and whether the strategies differed compared to previous research results in multi-goal pursuit. Specifically, we investigated when and why participants tend to pursue goals sequentially and how goals are prioritised in such multiple-goal tasks.
In Experiments 1 and 2, the participants with two explicit goal budgets did not engage in more simultaneous goal pursuit than in the other conditions and performed worse on each separate goal alone, as compared to in the single goal conditions. Indeed, across the experiments, and although BGS = 2 were sometimes observed on individual trials early in training, showing that, in principle, simultaneous pursuit of both goals is often possible, there was a remarkable lack of consistent pursuit of this strategy. The participants rather engaged in a mix of sequential and concurrent goal pursuit and there was neither evidence that goal attainment was correlated with simultaneous goal pursuit nor that participants' working memory capacity was correlated with successful simultaneous goal pursuit. Although both goal achievement at the end of the training was improved in Experiment 3, where there was a linear rather than a nonlinear utility function, this improvement did not involve more simultaneous goal pursuit on the individual trials.
Altogether, these results suggest that the absence of simultaneous goal pursuit in previous studies is not a mere accidental aspect of how the tasks were interpreted in these studies (the “Task Interpretation Hypothesis”). Neither was there any support for the interpretation that simultaneous goal pursuit is a viable and potentially effective strategy nor are people differentially constrained in executing the strategy because of their limited working memory capacity (the “Working Memory Hypothesis”). Support was obtained for the interpretation that simultaneous goal pursuit is not a viable strategy in the task and that adaptation to the task reinforces shifts to concurrent and sequential strategies (“Task Adaption Hypothesis”).
In Experiment 1 we added a working memory task to assess the relationship between goal attainment and simultaneous goal pursuit, allowing us to evaluate The Working Memory Hypothesis. Working memory capacity is known to be related to a number of higher-level cognitive tasks, which are associated with conscious processing (e.g. Evans, Citation2007; West et al., Citation2008). However, when it comes to performance on tasks driven by automatic processes, research suggests that individual differences in working memory capacity are irrelevant (Unsworth & Engle, Citation2005). The electricity consumption task is quite complex, and hence we hypothesised that working memory would be predictive of goal attainment. Contrary to our hypothesis, however, there was no relation between either goal attainment or simultaneous goal pursuit. Rolison et al. (Citation2011) investigated whether individual differences in working memory capacity predicted performance on MCPL judgment tasks (positively, negatively, and mixed correlated cues). Results showed that negatively, but not positively (as in the present task) or mixed correlated cue tasks were associated with working memory capacity. Results also revealed that those with a higher working memory capacity showed higher levels of explicit knowledge of task performance, but only when the cues were negatively related or when explicit instructions about cues were given. In relation to Experiment 1, the findings suggest that participants relied on automatic processes, hence the absence of association between working memory and goal attainment. Along the same lines, it is plausible that the few participants that did display simultaneous goal pursuit engaged in conscious processing of the cues. However, this assumption needs to be validated experimentally, though we note that it provides a good account of our results.
In Experiment 2, utility was expressed as money (Utility Market), to enhance its evaluability. The transformation was clearly disadvantageous for utility satisfaction. Apparently, expressing both goals in the same metric made it more difficult for the participants to distinguish between the goals. One interpretation is that the two goals were diluted (Zhang et al., Citation2007), a phenomenon that arises when goals are not distinct enough. When the participants focused on the utility goal (partially or wholly), the same metric for both cost and utility considerably worsened the utility goal achievement, because the actions often spilled over on the cost goal, paradoxically producing the “side-effect” of an improved cost goal achievement. In sum, transforming utility to the same unit (money) as the cost goal did not enhance goal attainment, nor did it make the participants change the order in which they pursued the goals.
In Experiment 3, participants with a linear utility function focused more on the utility variable already at the beginning of the training. A possible explanation why participants in the non-linear condition made large initial adjustments of the linear variable (cost), then adjusting the non-linear variable (utility) is that people find it more difficult to learn non-linear than linear functions (Juslin et al., Citation2008; Karelaia & Hogarth, Citation2008). Further, in the experiments reported here the start settings of the appliances were based on the average settings dialed in by the participants on the first trial of previous experiments, and thus set to provide good comfort (high utility). In this region, the utility function is already becoming rather flat and the effects of actions on utility are therefore less salient and consistent than the linear effects on the cost.
Importantly, in contrast to in Experiments 1 and 2, participants with linear utility displayed the same goal satisfaction for all three goals (cost, utility, and both) in addition to giving relatively larger initial priority to the utility goal. In other words, presenting people with variables on a linear scale, but with different units, seems to facilitate multi-goal pursuit in an optimisation task. In the present task, the participants did not act on “their own utility”, but relied on an artificial, although plausible, externally defined function which they had to learn from training. The time scale is also short: in a real-world setting people engage in more extended and distributed training over days, weeks, and months. On the other hand, in many ways, the situation for learning is more optimal in this laboratory task, than it is in the corresponding everyday environments, where there are many more distractions and complications.
Other than investigating the reasons for participants’ strategies and goal attainment in a multiple cue probability learning (MCPL) task, we were also interested in comparing them with previous research. In Ballard et al.’s (Citation2016) sequential sampling model MGPM* framework the current study consists of two approach goals, and in Experiment 1 half of the participants were provided with a time pressure intervention, which was intended to induce time sensitivity. MGPM* predicts that time-sensitive individuals provided with two approach goals will prioritise the goal with the largest discrepancy, whereas less time-sensitive individuals will engage in concurrent goal pursuit (interchangeably attend to each goal). Participants in Experiments 1 and 2 addressed the goals as time-sensitive participants addressed the two approach goals in Ballard et al. (Citation2016) study, beginning with cost, which was farthest from the criterion, and then utility, which was closer to the criterion. However, since there was no effect of time pressure, the results imply that either all participants were time sensitive, or that people act differently in MCPL tasks. Another interpretation of the results relates to the functional form of the goals: In Experiments 1–2 cost was linear and utility was non-linear, whereas in Experiment 3 both goals were on a linear scale. In Experiment 3 the participants displayed relatively more focus on utility already at the beginning (concurrent goal pursuit), acting as participants who were less time sensitive in Ballard et al.’s study. A speculative account of the results is that the non-linear functional form had the same effect on the participants’ strategy choice as time sensitivity, and when utility was linear participants acted like non-time sensitive participants. This reasoning would also account for the lack of effect of time pressure in Experiment 1, in the sense that function form had the same effect as time pressure, although with stronger impact, hence overshadowing the effect of time pressure. The design of the current study does not permit a proper evaluation of the relationship between time sensitivity and functional form, future studies should investigate how this manipulation in an environment that permits fitting data to MGPM*.
In the present study, we evaluated goal attainment separately from goal strategy, which was assessed with both goals scores and selective focus scores. An alternative strategy is to approximate participants’ behaviour in a dynamic model of learning, e.g. rolling regression (Kelley & Friedman, Citation2002; Lagnado et al., Citation2006), which computes the weight given to each cue on each trial. Another way of analysing participants’ behaviour is by fitting data to a heuristic model, to see whether participants use a few diagnostic cues, for instance the temperature and hot water. At present, we can conclude that people act similarly in a sequential sampling task as in MCPL optimisation task, when given two goals on a different scale: they address them sequentially and begin with the goal farthest away from the criterion. However, when both goals are expressed on a linear scale, the individuals tend to address them concurrently, why that is so, remains to be clarified, but from a real-life perspective it is more advantageous to attend to both goals successively in an optimisation task.
Data is available online: https://osf.io/q7g9v/.
Online Appendix
Download MS Word (57.4 KB)Supplemental Material
Download MS Word (44.7 KB)Disclosure statement
No potential conflict of interest was reported by the author(s).
Additional information
Funding
Notes
1 Feedforward training provides the individual with prior information of rules, concepts and goals before the actual task, either as statements or as an initial training (e.g. Newell et al., Citation2015, p. 52).
2 For a more detailed description of the Aospan-test, we refer to online Appendix 1.
3 The criteria for goal achievement were based on previous data and set so that app. 50% of the participants in the single focus conditions (Cost Focus & Utility Focus) were expected to reach the goals (Juslin et al., Citation2016).
4 Both the unit for cost (SEK) and utility points are in arbitrary units with unknown exchange rate in the current context, making distances in the surface in difficult to interpret in absolute terms. In other words, there is no way to answer the question of whether paying 10 SEK is paying too much or too little for an increase of 10 utility points and therefore, ultimately, difficult to interpret distances in this space. However, the issue of whether a goal is improved or not on a trial is unambiguously defined and thus provides a more solid base for the measurements.
5 There was no significant main effect or interaction involving Explicit Limit of trials or not, as reported later, and we thus concentrate the presentation on the main effects of Goal Focus.
6 The Bayes’ Factor BF10 quantifies the evidence in favor of H1 relative to H0 by dividing the likelihood of the observed data under H1 with the likelihood of the data under H0. BF10 larger than 1 is thus evidence for H1 relative to H0 and BF10 smaller than 1 is evidence for0 H0. BF01 correspondingly quantifies the evidence in favor of H0.
7 The Bayes’ Factors for inclusion BFincl is the likelihood ratio describing the probability of the observed data under the assumption that the independent variable in question is included, across all models considered, relative to the corresponding probability under the assumption that the independent variable is not included in the models (Hinne et al., Citation2020).
8 There was no significant effect or interaction involving Explicit Limit or Aospan, and we thus concentrate the presentation on the main effects of Goal Focus.
9 The complete ANOVA is reported in Table S3 in online Appendix 3.
10 The assumption of proportional hazards assumes that the relative likelihoods of achieving the goals between the different conditions stay constant throughout training. AFT allows these to change according to specified parametric functions.
11 We also tested logistic, exponential and loglogistic distributions for all models, but the Weibull distribution provided the best fit (measured in AIC points).
12 See Table S5 in online Appendix 3 for the interaction effect sizes.
13 We created a function that calculated the maximum obtainable utility for linearly expressed utility.
14 This was how the utility goal was originally obtained for the non-linear utility function.
15 The complete Bayesian ANOVA is reported in Table S7 in online Appendix 3.
16 The Kaplan-Meyer survivor function evaluates the survivor rate between different groups with a log-rank test, hence when there are no other covariates than group, as in the present case. It is recommended to use when group is the only covariate that is to be estimated (Bewick et al., Citation2004).
References
- Anderson, J. R., Bothell, D., Byrne, M. D., Douglass, S., Lebiere, C., & Qin, Y. (2004). An integrated theory of the mind. Psychological Review, 111(4), 1036–1060. https://doi.org/https://doi.org/10.1037/0033-295X.111.4.1036
- Ashby, F. G., & Valentin, V. V. (2017). Multiple systems of perceptual category learning: Theory and Cognitive Tests. In Henri Cohen & Claire Lefebvre (Eds.), Handbook of categorization in cognitive science (pp. 157–188). Elsevier.
- Ballard, T., Yeo, G., Loft, S., Vancouver, J. B., & Neal, A. (2016). An integrative formal model of motivation and decision making: The MGPM*. Journal of Applied Psychology, 101(9), 1240–1265. https://doi.org/https://doi.org/10.1037/apl0000121
- Bewick, V., Cheek, L., & Ball, J. (2004). Statistics review 12: Survival analysis. Critical Care, 8(5), 389. https://doi.org/http://dx.doi.org/10.1186/cc2955
- Bilodeau, E. A., Bilodeau, I. M. C. D., & Schumsky, D. A. (1959). Some effects of introducing and withdrawing knowledge of results early and late in practice. Journal of Experimental Psychology, 58(2), 142–144. https://doi.org/https://doi.org/10.1037/h0040262
- Bradburn, M. J., Clark, T. G., Love, S. B., & Altman, D. G. (2003). Survival analysis part III: Multivariate data analysis – choosing a model and assessing its adequacy and fit. British Journal of Cancer, 89(4), 605–611. https://doi.org/https://doi.org/10.1038/sj.bjc.6601120
- Brehmer, B. (1994). The psychology of linear judgement models. Acta Psychologica, 87(2–3), 137–154. https://doi.org/https://doi.org/10.1016/0001-6918(94)90048-5
- Daw, N. D., Gershman, S. J., Seymour, B., Dayan, P., & Dolan, R. J. (2011). Model-based influences on humans’ choices and striatal prediction errors. Neuron, 69(6), 1204–1215. https://doi.org/https://doi.org/10.1016/j.neuron.2011.02.027
- Evans, J. (2007). On the resolution of conflict in dual process theories of reasoning. Thinking & Reasoning, 13(4), 321–339. https://doi.org/https://doi.org/10.1080/13546780601008825
- Fishbach, A., Dhar, R., & Zhang, Y. (2006). Subgoals as substitutes or complements: The role of goal accessibility. Journal of Personality and Social Psychology, 91(2), 232–242. https://doi.org/https://doi.org/10.1037/0022-3514.91.2.232
- Fishbach, A., & Labroo, A. A. (2007). Be better or be merry: How mood affects self-control. Journal of Personality and Social Psychology, 93(2), 158–173. https://doi.org/https://doi.org/10.1037/0022-3514.93.2.158
- Guath, M., Millroth, P., Juslin, P., & Elwin, E. (2015). Optimizing electricity consumption: A case of function learning. Journal of Experimental Psychology: Applied, 21(4), 326–341. https://doi.org/https://doi.org/10.1037/xap0000056
- Hertwig, R., & Erev, I. (2009). The description–experience gap in risky choice. Trends in Cognitive Sciences, 13(12), 517–523. https://doi.org/https://doi.org/10.1016/j.tics.2009.09.004
- Hinne, M., Gronau, Q. F., van den Bergh, D., & Wagenmakers, E.-J. (2020). A conceptual introduction to Bayesian model averaging. Advances in Methods and Practices in Psychological Science, 3(2), 200–215. https://doi.org/https://doi.org/10.1177/2515245919898657
- Hsee, C. K., & Zhang, J. (2010). General evaluability theory. Perspectives on Psychological Science, 5(4), 343–355. https://doi.org/https://doi.org/10.1177/1745691610374586
- Juslin, P., Elwin, E., Guath, M., Millroth, P., & Nilsson, H. (2016). Sequential and myopic: On the use of feedback to balance cost and utility in a simulated electricity efficiency task. Journal of Cognitive Psychology, 28(1), 106–128. https://doi.org/https://doi.org/10.1080/20445911.2015.1095192
- Juslin, P., Karlsson, L., & Olsson, H. (2008). Information integration in multiple cue judgment: A division of labor hypothesis. Cognition, 106(1), 259–298. https://doi.org/https://doi.org/10.1016/j.cognition.2007.02.003
- Karelaia, N., & Hogarth, R. M. (2008). Determinants of linear judgment: A meta-analysis of lens model studies. Psychological Bulletin, 134(3), 404–426. https://doi.org/https://doi.org/10.1037/0033-2909.134.3.404
- Keeney, R. L., & Raiffa, H. (1993). Decisions with multiple objectives: Preferences and value trade-offs (1st ed). Cambridge University Press. https://doi.org/https://doi.org/10.1017/CBO9781139174084
- Kelley, H., & Friedman, D. (2002). Learning to forecast price. Economic Inquiry, 40(4), 556–573. https://doi.org/https://doi.org/10.1093/ei/40.4.556
- Kopetz, C. E., Kruglanski, A. W., Arens, Z. G., Etkin, J., & Johnson, H. M. (2012). The dynamics of consumer behavior: A goal systemic perspective. Journal of Consumer Psychology, 22(2), 208–223. https://doi.org/https://doi.org/10.1016/j.jcps.2011.03.001
- Kruglanski, A. W., Shah, J. Y., Fishbach, A., Friedman, R., Chun, W. Y., & Sleeth-Keppler, D. (2002). A theory of goal systems. In Advances in Experimental Social psychology (Vol. 34, pp. 331–378). Elsevier. https://doi.org/https://doi.org/10.1016/S0065-2601(02)80008-9.
- Lagnado, D. A., Newell, B. R., Kahan, S., & Shanks, D. R. (2006). Insight and strategy in multiple-cue learning. Journal of Experimental Psychology: General, 135(2), 162–183. https://doi.org/https://doi.org/10.1037/0096-3445.135.2.162
- Lindenberg, S., & Steg, L. (2007). Normative, gain and hedonic goal frames guiding environmental behavior. Journal of Social Issues, 63(1), 117–137. https://doi.org/https://doi.org/10.1111/j.1540-4560.2007.00499.x
- Locke, E., Smith, K., Erez, M., Chah, D.-O., & Schaffer, A. (1994). The effects of intra-individual goal conflict on performance. Journal of Management, 20(1), 67–91. https://doi.org/https://doi.org/10.1177/014920639402000104
- Locke, E. A., Chah, D.-O., Harrison, S., & Lustgarten, N. (1989). Separating the effects of goal specificity from goal level. Organizational Behavior and Human Decision Processes, 43(2), 270–287. https://doi.org/https://doi.org/10.1016/0749-5978(89)90053-8
- Lurie, N. H., & Swaminathan, J. M. (2009). Is timely information always better? The effect of feedback frequency on decision making. Organizational Behavior and Human Decision Processes, 108(2), 315–329. https://doi.org/https://doi.org/10.1016/j.obhdp.2008.05.005
- Newell, B. R., Lagnado, D. A., & Shanks, D. R. (2015). Straight choices: The psychology of decision making (2nd ed). Psychology Press, Taylor & Francis Group.
- Northcraft, G. B., Schmidt, A. M., & Ashford, S. J. (2011). Feedback and the rationing of time and effort among competing tasks. Journal of Applied Psychology, 96(5), 1076–1086. https://doi.org/https://doi.org/10.1037/a0023221
- Orehek, E., & Vazeou-Nieuwenhuis, A. (2013). Sequential and concurrent strategies of multiple goal pursuit. Review of General Psychology, 17(3), 339–349. https://doi.org/https://doi.org/10.1037/a0032584
- Rescorla, R. A. (1988). Pavlovian conditioning: It’s not what you think it is. American Psychologist, 43(3), 151–160. https://doi.org/https://doi.org/10.1037/0003-066X.43.3.151
- Rolison, J. J., Evans, J. S. B. T., Walsh, C. R., & Dennis, I. (2011). The role of working memory capacity in multiple-Cue probability learning. Quarterly Journal of Experimental Psychology, 64(8), 1494–1514. https://doi.org/https://doi.org/10.1080/17470218.2011.559586
- Salvucci, D. D., & Taatgen, N. A. (2008). Threaded cognition: An integrated theory of concurrent multitasking. Psychological Review, 115(1), 101–130. https://doi.org/https://doi.org/10.1037/0033-295X.115.1.101
- Schmidt, A. M., & Dolis, C. M. (2009). Something’s got to give: The effects of dual-goal difficulty, goal progress, and expectancies on resource allocation. Journal of Applied Psychology, 94(3), 678–691. https://doi.org/https://doi.org/10.1037/a0014945
- Shah, J. Y., Friedman, R., & Kruglanski, A. W. (2002). Forgetting all else: On the antecedents and consequences of goal shielding. Journal of Personality and Social Psychology, 83(6), 1261–1280. https://doi.org/https://doi.org/10.1037/0022-3514.83.6.1261
- Skinner, B. F. (1938). The behavior of organisms: An experimental analysis. Appleton-Century.
- Slovic, P. (1974). Hypothesis testing in the learning of positive and negative linear functions. Organizational Behavior and Human Performance, 11(3), 368–376. https://doi.org/https://doi.org/10.1016/0030-5073(74)90026-9
- Sutton, R. S., & Barto, A. G. (2018). Reinforcement learning: An introduction (2nd ed). The MIT Press.
- Tabachnick, B. G., & Fidell, L. S. (2013). Using multivariate statistics (6th ed). Pearson Education.
- Therneau, T. (2020). A package for survival analysis in R (3.1-12) [R]. https://CRAN.R-project.org/package=survival.
- Thorndike, E. L. (1927). The Law of effect. The American Journal of Psychology, 39(1/4), 212. https://doi.org/https://doi.org/10.2307/1415413
- Unsworth, N., & Engle, R. W. (2005). Individual differences in working memory capacity and learning: Evidence from the serial reaction time task. Memory & Cognition, 33(2), 213–220. https://doi.org/https://doi.org/10.3758/BF03195310
- Unsworth, N., & Engle, R. W. (2008). Speed and accuracy of accessing information in working memory: An individual differences investigation of focus switching. Journal of Experimental Psychology: Learning, Memory, and Cognition, 34(3), 616–630. https://doi.org/https://doi.org/10.1037/0278-7393.34.3.616
- Unsworth, N., Heitz, R. P., Schrock, J. C., & Engle, R. W. (2005). An automated version of the operation span task. Behavior Research Methods, 37(3), 498–505. https://doi.org/https://doi.org/10.3758/BF03192720
- Walters, S. J. (2012). Analyzing time to event outcomes with a Cox regression model. Wiley Interdisciplinary Reviews: Computational Statistics, 4(3), 310–315. https://doi.org/http://dx.doi.org/10.1002/wics.1197
- West, R. F., Toplak, M. E., & Stanovich, K. E. (2008). Heuristics and biases as measures of critical thinking: Associations with cognitive ability and thinking dispositions. Journal of Educational Psychology, 100(4), 930–941. https://doi.org/https://doi.org/10.1037/a0012842
- Zhang, Y., Fishbach, A., & Kruglanski, A. W. (2007). The dilution model: How additional goals undermine the perceived instrumentality of a shared path. Journal of Personality and Social Psychology, 92(3), 389–401. https://doi.org/https://doi.org/10.1037/0022-3514.92.3.389