
ABSTRACT
Referring to the well-replicated finding that the presence of to-be-ignored sound disrupts short-term memory for serially-presented visual items, the irrelevant sound effect (ISE) is an important benchmark finding within cognitive psychology. The ISE has proven useful in evaluating the structure, function and development of short-term memory. This preregistered report focused on a methodological examination of the paradigm typically used to study the ISE and sought to determine whether the ISE can be reliably studied using the increasingly popular method of online testing. Comparing Psychology students tested online, in-person and participants from an online panel, results demonstrated successful reproduction of the key signature effects of auditory distraction (the changing-state effect and the steady-state effect), albeit smaller effects with the online panel. Our results confirmed the viability of online data collection for auditory distraction research and provided important insights for the accumulation and maintenance of high data quality in internet-based experimentation.
Introduction
The present study aimed to establish whether key phenomena of auditory distraction can be studied using the online recruitment of participants. Internet-based experiments are increasingly used in cognitive psychology (e.g. Leding, Citation2019) because they provide quick access to a large and diverse pool of participants, which has clear advantages for improving the statistical power of experiments and increasing the representativeness of the data. However, studying auditory distraction online imposes unique challenges as it allows for less experimental control over the presentation of the stimulus material. Here, we provide an empirical test of whether the nature of the data collection method (in-person, online) moderated key findings of auditory distraction. We present this empirical approach to provide conclusions about the feasibility of online data collection in auditory distraction research, along with some guidance for maintaining high data quality in online experimentation. The importance of online experimentation has increased in ways that no one could have anticipated, prior to the global Covid-19 pandemic.
Due to the omnipresence of sound within the society we live in, it is a rare occurrence to undertake a cognitive task in a quiet environment. This is perhaps even more true nowadays, in which smartphones and laptops allow us to work and to study almost anywhere—on the train, in a café or at the beach. This portability implies that demanding cognitive activities are often performed under the influence of task-irrelevant sounds such as background speech. It is therefore of great relevance to understand how cognitive processes are affected by the auditory environment. It has been known for some time that the presence of task-irrelevant sounds, even if ignored, break through the barriers of selective attention and have typically adverse effects on cognition. Since its initial discovery over forty years ago (Colle & Welsh, Citation1976), the vulnerability of visual-verbal short-term memory to disruption via the mere presence of task-irrelevant sound has become a well-established and easily replicable phenomenon (Elliott, Citation2002; Jones & Macken, Citation1993; Neath, Citation2000; see also Campbell et al., Citation2002, for an empirical demonstration of an auditory-verbal version). This irrelevant sound effect (Beaman & Jones, Citation1997) has excellent test-retest reliability (Ellermeier & Zimmer, Citation1997), and has recently been included in the list of the most important benchmark phenomena within cognitive psychology (Oberauer et al., Citation2018). In part, this status reflects the fact that research undertaken on the irrelevant sound effect has informed theories of the structure (Salamé & Baddeley, Citation1982), function (Cowan, Citation1995) and development (Elliott, Citation2002) of working memory, as well as the interaction between speech-planning (motoric) and perceptual processes (Hughes & Marsh, Citation2017; Jones et al., Citation2004). This research is also of great applied relevance for the acoustical design of productive learning and work environments (for reviews, see Banbury et al., Citation2001; Beaman, Citation2005), and for the development of effective noise abatement measures that protect students and workers from the adverse consequences of task-irrelevant sound (e.g. Schlittmeier & Hellbrück, Citation2009). Such protection is needed, as individual differences in cognitive control do not predict the size of the disruption from changing-state sounds in the context of visual-verbal serial recall (Elliott et al., Citation2020; Hughes et al., Citation2013; Körner et al., Citation2017).
The standard paradigm for examining the effect of background noise on performance is the serial recall paradigm in which short lists of digits, consonants or words are visually presented, and have to be recalled in the correct serial order, either immediately after their presentation or after a short retention interval. It is well-established that serial recall is impaired when auditory distractors such as speech (Salamé & Baddeley, Citation1982), tones (Jones & Macken, Citation1993) or environmental sounds (Klatte et al., Citation2010) have to be ignored. Perhaps counterintuitively, this disruptive effect of irrelevant sounds seems to be independent of the loudness of the auditory distractors (Colle & Welsh, Citation1976; Ellermeier & Hellbrück, Citation1998; at least within the range studied [40 to 74 dB(A)] which should not cause damage to hearing), and is mainly determined by changes in the to-be ignored sound. The key empirical signature of the irrelevant sound effect is the changing-state effect (Jones et al., Citation1992). While repeated sounds may cause a measurable amount of auditory distraction relative to quiet (Bell et al., Citation2019), the disruption of short-term memory is much larger when auditory distractors differ from each other (Jones & Macken, Citation1993; Jones et al., Citation1992).
Research on the changing-state effect has proven influential; at the time of writing the current manuscript, Jones et al. (Citation1992) has been cited 368 times, while Jones and Macken (Citation1993) has been cited 590 times according to Google Scholar. To illustrate its influence, one of the simplest manipulations of changing-state that has provided robust evidence of a changing-state effect (e.g. Jones et al., Citation1992) is to compare the disruptive effect of a sequence of different auditorily presented letters (e.g. ABCDEFGH) with that of a sequence of repeated letters (e.g. AAAAAAAA). While speech distractors have proven to provide particularly strong evidence of distraction (Ellermeier & Zimmer, Citation2014), robust changing-state effects have also been observed with non-speech distractor materials such as tones (Jones & Macken, Citation1993) and music (Klatte et al., Citation1995; Schlittmeier et al., Citation2008; Schweppe & Knigge, Citation2020). However, although qualitatively similar in their effects on performance, quantitatively, the disruptive impact of speech distractors is typically greater than for non-speech distractors (LeCompte et al., Citation1997), which may be due to the relatively greater acoustic complexity of speech compared to non-speech signals (Tremblay et al., Citation2000).
There are two main theoretical views concerning the mechanisms underpinning the changing-state effect: the unitary attention and the duplex mechanism accounts. Very briefly, unitary views of auditory distraction propose that it is caused by attention capture (Bell et al., Citation2010; Bell et al., Citation2012; Cowan, Citation1995; Elliott, Citation2002). The duplex account assumes that, depending on the acoustic nature of the irrelevant sound, auditory distraction can occur via attentional capture or from interference-by-process. The latter results from a clash between deliberate serial order processing applied to visual-verbal items, via serial rehearsal and automatic seriation applied to changing acoustic elements within the irrelevant sound as part of the auditory streaming process (cf. Bregman, Citation1990; e.g. Hughes, Citation2014; Hughes & Marsh, Citation2020; Hughes et al., Citation2007). Both unitary and duplex views predict that changing-state sounds will be more disruptive than steady-state sounds; however, the predictions stem from different underlying mechanisms (i.e. attentional capture according to the unitary account and interference-by-process according to the duplex mechanism account). Thus, beyond its benchmark status within models of working memory (Oberauer et al., Citation2018), the changing-state effect holds a prominent place in theoretical models of auditory distraction effects, and it is critical to determine the viability of online investigation of the effect as a starting point for continued research on auditory distraction.
Even before the global Covid-19 pandemic, the use of online data collection had become increasingly popular in cognitive psychology (e.g. Leding, Citation2019). Previously, research on auditory distraction was typically undertaken in a laboratory environment that afforded researchers full control over the presentation of the auditory distractors and other aspects of the experimental situation. Cognitive psychologists may have been reluctant to sacrifice experimental control, but online data collection offers a number of advantages over traditional laboratory-based studies that make it a highly attractive tool for researchers (e.g. Benfield & Szlemko, Citation2006; Mason & Suri, Citation2012; Reips, Citation2008). Given the current replicability crisis (Open Science Collaboration, Citation2015), it is increasingly being realised that it is essential to ensure adequate power to obtain reliable results (Brysbaert, Citation2019). Appropriate statistical power is facilitated by online data collection that gives researchers quick access to a large pool of participants and also facilitates collaborative data collection across different universities. Online data collection also allows researchers to gather data from a more diverse pool of participants. This factor may be relevant for auditory distraction as university students who are young and well educated may be better equipped to deal with auditory distraction than older or less educated individuals (Sörqvist, Citation2010; but see Körner et al., Citation2017). A greater diversity of the sample is particularly desirable for research on inter-individual differences in auditory distraction, wherein a restriction of variance may mask potentially meaningful associations with other variables. Moreover, providing means by which participation in experiments can be undertaken without using public or private transport to laboratories can reduce the carbon footprint of the participants, and can provide a way to maintain social distancing during the Covid-19 pandemic.
However, examining auditory distractions online also poses several challenges that make it difficult to predict whether online data collection can be a useful tool in this area of research (e.g. Lefever et al., Citation2007; Reips, Citation2008). Most of these challenges are related to a lack of experimental control. With regard to technical factors, online data collection offers less control over the delivery of the irrelevant sound, that is, whether the sound is presented over the headphones or speakers and the quality of the presentation. Given that participants may use smartphones, laptops or desktop computers, it also allows less control over how the visual targets are displayed. Finally, the internet connection may affect the data transmission so that timing of the visual and auditory stimuli may be less precise. With regard to environmental factors, it is less clear than in the laboratory that the environment does not contain any other visual or auditory distracting information as the experiment may be performed on a smartphone in a crowded environment such as a train station. With regard to human behavior, researchers have no direct way of noticing that participants fail to comply with instructions. For instance, participants may turn off the volume or take off the headphones to avoid distraction. Such behaviour is only rarely observed in the laboratory, but cheating may be more tempting when participants are not monitored by a research assistant (e.g. Jensen & Thomsen, Citation2014). It is also possible to speculate that, due to the lack of direct participant-researcher interactions, participants may feel less motivated in online studies (which may, for example, lead to failures in completing the study). In sum, without appropriate safeguards, it seems unclear whether data collected online has the same quality as that obtained in the laboratory.
Here, we take an empirical approach towards the subject by performing the same experiment online and in the laboratory, and by comparing the size of the changing-state effect (CSE; steady-state sounds minus changing-state sounds) between the online sample and the laboratory sample. These comparisons should show whether there are systematic differences between the data obtained online and in the laboratory. As supplementary analyses, we also compared the size of the steady-state effect (SSE; silence minus steady-state sounds) and the size of the irrelevant sound effect (ISE; serial recall performance in silence minus changing-state sounds) between the online and in-person samples. Furthermore, we explored different ways to remedy the potential limitations of online testing outlined above. The aims of the study were to assess whether it is feasible to conduct auditory distraction research online and, if so, to provide recommendations about how to ensure high data quality in web-based studies.
Preregistered methods
Preregistered data collection plan
Originally, we planned to collect the data of two groups of participants in a between-subjects design, in two main recruitment locations, for a total of four groups. In one of the recruitment locations, groups of participants were to be drawn from the same participant pool for the in-person and online comparison. Participants at Louisiana State University (LSU) were to be drawn from the Department of Psychology participant pool. The participant pool at LSU is created by offering either course credit or extra credit in Psychology courses, and the participants are typically between the ages of 18–25 years of age. The pool is approximately 75–80% female in a given semester. This method of recruiting participants served to help to alleviate any concerns regarding differences in the sample between the online and in-person versions of the study.
In a second recruitment approach, we originally planned to recruit university participants in-person (but see below), and the second group of participants (the online group) was to be recruited via Prolific Academic (https://www.prolific.co) to represent non-students from the general online population. This second approach served to allow comparisons between the population of Psychology students and the broader population of online participants. For the Prolific Academic sample, the “Custom Screening” option was chosen. pre-screened exclusion criteria included “Student Status”, “Dyslexia, Dyspraxia, ADHD or any other related literacy difficulties”, “NHS mental health support”, “mild cognitive impairment/dementia”, “antidepressants”, “mental illness daily impact”, “autistic spectrum disorder” and “mental health/illness/condition – ongoing”. Additional eligibility criteria included self-report of normal or corrected-to-normal vision and no hearing loss or difficulties, being 18–30 years, of UK nationality born and living in the UK and speaking English as their first language. Finally, participants were eligible if their approval rate was greater than 95% for participation on Prolific to ensure a high quality of data.
We incorporated inclusion and exclusion criteria. Passing a headphone check task was an inclusion criterion. Exclusion criteria were self-reported hearing loss, missing a “catch” trial at the end of the ISE task and recall performance below 3 SD from the sample mean of performance in the silent condition in each of the recruitment groups (online and in-person groups). Both the headphone check task and the catch trial are described in more detail below. If participants reported an obvious failure to comply with task-instruction in either the online or in-person groups (e.g. removing headphones, turning off headphone volume, undertaking the study in the presence of other auditory and visual distractors), their data was to be excluded from the analysis. This information was obtained from the post-experiment questionnaire. Should a participant fail to complete the post-experiment questionnaire, they were to be excluded as well. The number of exclusions and reasons for exclusion are reported below.
Sample size. We planned to utilise a sequential design with a maximal number of participants, using Bayes factors (e.g. Schönbrodt & Wagenmakers, Citation2018; Schönbrodt et al., Citation2017). Numerous prior studies have provided estimates of the effect size of the changing-state effect, but there are no published studies using an online methodology, to our knowledge. The choice to use a Bayesian framework to make statistical inferences and designing the experiment is motivated by evidence that Bayesian statistical analyses are not influenced by experimenters’ intention, and allow for sequential testing (see, e.g. Berger & Berry, Citation1988; Dienes, Citation2016; Rouder, Citation2014). In order to reduce the rate of false positive evidence that can occur with early termination of sequential designs (Schönbrodt & Wagenmakers, Citation2018), a minimum number of participants was to be recruited before conducting any analysis. We planned to recruit forty participants in each methodology for a total of 80 participants within each of the two separate recruitment approaches (i.e. a minimum sample of 160 total, but see below).
For each sample, we planned to compare performance from the changing- and steady-state conditions, via Bayesian one-sided, paired-samples t-tests, predicting larger scores in the steady-state condition. The analysis was to be performed with the open statistical software JASP (version 0.10.0; JASP Team, Citation2018),Footnote1 using the default prior for t-test corresponding to a Cauchy distribution with a width of .707. This statistical approach allowed us to compute, within each recruitment group separately, a Bayes factor (BF), computed with the BayesFactor package in R (Morey & Rouder, Citation2015), that can be interpreted as the relative predictive performance of two competing hypotheses (i.e. a null hypothesis predicting no CSE and an alternative hypothesis predicting a positive CSE) in explaining the data (van Doorn et al., Citation2019).
For instance, a BF of 3 in favour of the alternative hypothesis indicates that the observed data are three times more likely under the alternative hypothesis than under the null hypothesis (see, e.g. Wagenmakers et al., Citation2018). We used a BF of 7—in favour of either the null (BF01) or the alternative hypothesis (BF10)—to define our stopping rule, as well as a guideline for maximal recruitment. Once we reached a minimum sample of 40 participants in each group, we planned to examine the BF for the t-test described above for each group. If it was < 7 in one of the groups, we planned to continue to recruit participants in batches of 10 within each group and to perform the analysis again. However, we planned to stop once we have reached a maximum of 100 participants in each of the groups, for a maximal total of 200 within each recruitment approach. Generally, a BF between 1 and 3 is considered “anecdotal evidence” for the tested hypothesis, whereas a BF between 3 and 10, and a BF larger than 10, is considered “moderate” and “strong” evidence, respectively (Lee & Wagenmakers, Citation2013).
The sample size required for this study was determined based on simulations performed with the BFDA package (Schönbrodt & Stefa, Citation2019) running in R (R Core Team, Citation2021). As a first step, we simulated hypothetical paired-samples studies using the BFDA.sim function, both under H1 and under H0, with 10,000 simulations for each. We simulated an expected effect size of Cohen’s d = 0.5 for H1 studies and Cohen’s d = 0 for H0 studies. The expected effect size was determined based on a conceptual replication (Marsh et al., Citation2022) of the CSE reported in the visual-verbal condition of Jones et al. (Citation1995; Experiment 4) that yielded an effect size of Cohen’s d of roughly 1. As one may expect that the CSE would be lower with an online setting, we adopted a conservative approach by simulating an expected effect size of Cohen’s d = 0.5. The minimum and maximum sample sizes for each simulation were 10 and 300, respectively. After each batch of 10 simulated participants (from 10 to 300), a Bayesian paired-samples t-test with a positive directional alternative hypothesis and a prior of 0.707 centred on 0, was conducted. The next step required to analyse the simulations using the BFDA.analyze function to determine a sample size that would be associated with a sufficient probability of detecting the expected effect. As shown in the top part of , when the minimum and maximum sample size was set to 40 and 100, respectively, roughly 99% of the H1 simulated studies reached the expected boundary (i.e. BF10 ≥ 7). For H0 simulated studies (see bottom part of ), when the minimum and the maximum sample size was set to 40 and 100, respectively, 75% of H0 simulated studies reached the expected boundary (i.e. BF01 ≥ 7), and 13% of the studies reached the limit of 100 participants but still had a BF01 > 3 that can still be interpreted as (moderate) evidence for the null.
Figure 1. Results of the simulations using the Bayes Factor Design Analysis (BFDA) package in R, illustrating the benefits of defining the minimum and maximum sample size ranges. Top: the proportion of H1 simulated studies (y-axis) that reached the BF01 boundary (solid line, false negative) and the BF10 boundary (dashed line, true positive), as a function of the maximum sample size (x-axis); bottom: the proportion of H0 simulated studies (y-axis) that reached the BF01 boundary (solid line, true negative) and the BF10 boundary (dashed line, false positive), as a function of the maximum sample size (x-axis).
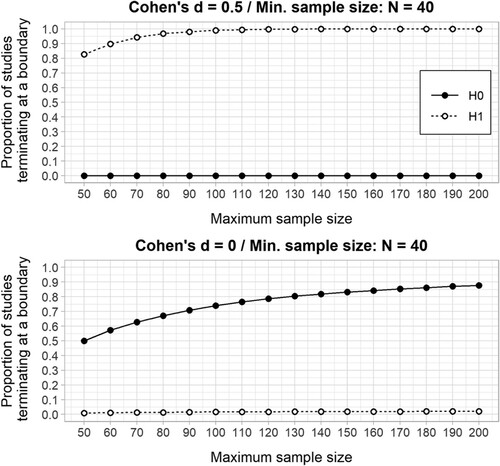
To sum up, the simulations revealed that using a Bayesian sequential design with minimum and maximum sample sizes of 40 and 100 participants, respectively, should lead to the high probability of detecting either a true CSE (characterised by a Cohen’s d of at least 0.5) or a true null effect. Indeed, in the case of H0 simulated studies, only 2% of the studies led to wrongly supporting the alternative hypothesis, while 99% of the studies correctly supported the alternative hypothesis in H1 simulations.
Materials
The programme was completed within labjs, which is a graphical interface for creating Javascript experiments (Henninger et al., Citation2019). The experiment was presented to online and in-person participants via OpenLab (https://open-lab.online/).
Headphone check task. Because a portion of our participants were tested in an online environment, it was critical that we could determine whether or not the participants set the volume of the sounds to a comfortable listening level, and that they wore headphones during the entire duration of the experiment. Woods et al. (Citation2017) devised a screening to determine if participants are compliant with the instructions. Results from the study by Woods et al. indicated that during an in-person comparison of participants who were either wearing headphones or using the loudspeaker, “20 of 20 participants wearing headphones passed the test, whereas 19 of 20 participants listening over loudspeakers did not.” (p. 2068).
Procedure. Participants in both groups were presented with these instructions:
Please close any other applications on your device, and please put away and silence your cell phone. It is important to minimise any distractions in your environment, so that you can concentrate on this task. Begin this task when you know that you have at least 30 minutes of uninterrupted time to complete it. Please do not take your headphones off, and please do not adjust the volume until the study is completed. It is important that you follow the instructions, as the data will be published as part of a research project.
Upon pressing the spacebar to continue, a prompt to adjust the volume of the sounds to a comfortable listening level appeared, and participants were asked to put on their headphones. Then, they were presented with a series of 6 trials in which three tones were presented, and the participants had to use the mouse to click on the number representing which tone was the quietest, out of three possible choices (“Which of the three sounds was the softest [quietest]?”). Participants had to respond correctly on 5 out of the 6 trials to proceed, and no feedback was given to them on their choices. If they did not meet this criterion, a screen appeared that said, “Sorry! Your system does not provide the audio fidelity needed to complete this study. We are very sorry, but you cannot continue”.
Number of attempts. To ensure that participants were given multiple chances to complete the headphone check and then move on to the ISE task, participants were given up to 5 attempts to complete the headphone check before the experiment terminated.
Stimuli. The headphone check programme included a 200 Hz tone. Two manipulations to the original tone allowed for the sensitivity of the programme to differentiate between headphone listeners and loudspeaker listeners by (1) phase reversing one tone between the stereo channels and by (2) decreasing the level of one tone by 6 dB.
Irrelevant Sounds Task
Participants completed a recall paradigm with irrelevant sounds (changing-state sounds, steady-state sounds and silence), using a reconstruction of order response.
Stimuli. The changing-state sounds consisted of different spoken letters, and the steady-state sounds consisted of the repetition of a single letter (for example, “C, C, C … ” on one trial or “K, K, K … ” on another trial). Letters were selected from the set of “A C F H I J K L N O Q R S U X Y”. For changing-state trials, letters were drawn randomly without replacement from the letter set. Irrelevant items were presented at a rate of two per second, and the onset of the first sound was simultaneous with the onset of the first visual item. The to-be-ignored letters were digitally recorded in a synthesised female voice using “Polly” from the free Amazon Web Service. Each letter was edited to 250 ms.
Procedure. Digits were presented in the centre of the screen in black Arial font on a white background. The approximate size was the 72-point font, which was estimated from the pixel size that was used in the browser-based programme. One digit was presented at a time and remained onscreen for 800 ms with a 200 ms blank before the next digit appeared. The digits were chosen from the set of digits 1 to 8, the list length was 8 digits, and digits were not repeated. Digit sequences were selected given the following constraints: trials could not start with the digit 1 and digits were not numerically adjacent (2 followed by 3 or the reverse was not possible). After digit presentation, participants were prompted to recall their answer, and the set of digits appeared on the screen in canonical order. Participants were specifically instructed to select the digits that they saw in the order that they were presented using a mouse-driven pointer. The next trial was only initiated after participants selected all 8 items. Participants were only able to click on each digit once. Clicking on a digit resulted in that digit disappearing from the screen, thereby yielding feedback to the participant that that digit had been selected. There were 60 trials in all, with 20 in each of the distractor conditions (Jones et al., Citation1993). Sounds were presented quasi-randomly, with the constraint that one of each type of distractor condition was selected randomly before going on to the next set of three distractor conditions; predictability of the type of sound sequence does not influence the size of the CSE (Marsh et al., Citation2014). After the experimental trials were completed, participants heard a series of three repeated letters and were asked to type the last letter that they heard. This final manipulation served as the “catch trial” to ensure that participants kept their headphones on during the duration of the experiment.
For the in-person testing at the LSU Psychology department, participants were seated approximately 50 cm from a 17-inch computer screen connected to a Dell desktop computer. In this set up visual digits subtended a visual angle of approximately 3.4°. Participants wore over-the-ear Sennheiser HD 229 headphones connected to the computer. Participants were tested individually.
Post-experiment questions. To provide insight into participants’ general compliance with task-instruction and motivation on the serial recall task, the following questions were asked:
Did you have any help from another person when remembering the digits? Y/N
Did you use any external help (e.g. paper and pencil) to remember the digits? Y/N
Did you say the digits aloud when trying to remember them? Y/N
Did you turn off the volume on your headphones during the task? Y/N
Did you remove or unplug your headphones during the task? Y/N
Type in the number 2. (attentional check/catch response) Free-field response
While you were completing the study, were there any external sources of visual or auditory distraction (e.g. other people speaking in the same room, a running video, a song playing in the background, etc.)? Y/N
If Y, what was the source of distraction? Free-field response
What equipment did you use to do the experiment?
Desktop computer
Laptop computer
Tablet
Smartphone
What type of headphones did you use to play the sounds?
In-ear
On-ear
Over-ear
What device did you use to record your responses?
Mouse
Trackpad
Touchscreen
How motivated were you to obtain the best test-score possible?
Lowest motivation
Low motivation
Average motivation
High motivation
Highest motivation
How concentrated were you on the task?
Lowest concentration
Low concentration
Average concentration
High concentration
Highest concentration
When performing the task were you switching between different tasks or browsers? Y/N
Did you experience any technical difficulties during the study (e.g. problems with the internet connection, delays in presentation, etc.) Y/N
What is the current time at your location (please specify am or pm)? Free-field response
If you reported that you have hearing loss at the start of the study, please tell us more about this now. Free-field response
Preregistered analysis plan
Headphone check task. The headphone check task provided a pass or fail outcome. Only if participants passed the headphone screening did they continue on to the rest of the experiment. As mentioned above, they were given up to 5 attempts to pass the headphone screening.
Irrelevant sounds task. Performance was scored according to a strict serial recall criterion (that is, only digits reported at the correct serial position were scored as correct).
The main analyses of interest were to determine (1) the magnitude of the CSE in the entire sample as well as (2) the comparison of the magnitude of the CSE across the different types of administration. We planned to run a 3 × 2 mixed Bayesian ANOVA with distractor condition (silence, steady-state, changing-state) and data collection procedure (in-person, online) as independent variables and serial recall performance collapsed across serial position as dependent variable to determine (a) whether there was a main effect of auditory distraction and (b) whether auditory distraction differed as a function of the data collection procedure. This analysis was planned to be conducted with default priors for ANOVA, with a Cauchy distribution with a width of 0.5 and 1 for fixed and random effects, respectively.
We planned to report results from the analysis of effects provided in JASP, that is, a model averaging technique providing inclusion BF representing evidence for a specific effect averaged across all the models containing the effect of interest. This same analysis was planned to be conducted for each of the recruitment approaches.
In case the results supported the presence of an interaction between the distractor condition and the data collection procedure (i.e. an inclusion BF > 3 for the effect of interaction), we planned to examine whether the size of the three distraction effects (CSE: steady-state sounds minus changing-state sounds; SSE: silence minus steady-state sounds; ISE: silence minus changing-state sounds) was consistent across the in-person versus online administration methods, separately for each recruitment approach. This was to be tested with multiple independent-samples Bayesian t-tests. We planned to use undirected tests with default prior to taking the form of Cauchy distribution with a width of .707.
Changes to the participant recruitment and the analysis plan
Due to the global Covid-19 pandemic, we had to make changes to the participant recruitment plan that also required us to make some changes to the data analysis. Most importantly, it was only possible to collect in-person data at one recruitment location (LSU) so that only three groups of participants (Psychology students in-person, Psychology students online, online panel) were tested. This allowed us to compare the data of participants from the same participant pool (Psychology students) between the two types of data collection procedures (in-person, online), and it allowed us to compare a typical student sample (Psychology students) with a sample from an online panel. Due to changes in our recruitment procedures because of the pandemic, we ended up with sample sizes that are somewhat larger than we had planned. A total of 181 participants signed up to participate in the two groups from the LSU Psychology department (in-person = 64, online = 98, failed headphone check in-person group and did not continue = 5; in the online group = 14). Participant sign ups were posted in batches and consistent with our preregistered plan, the data were examined for exclusionary criteria to determine if additional recruitment would be needed to obtain a sample of 40 participants who could be included in the analyses. After applying the preregistered exclusion criteria, we analysed data from 42 to 46 participants in the online and in-person Psychology student groups from LSU, which was slightly over 40 due to the way the participants signed up in batches.
For the online panel, we did not stop data collection after 40 but continued until we had collected 140 data sets despite the fact that our stopping criterion was already met after 40 valid data sets were collected. In the main comparison of the distraction effects among the different groups, we included only the 40 valid data sets that were first collected from this sample, in line with the preregistered stopping rule. However, the full data set is used in a separate supplementary analysis to explore how the pattern of results may change with different exclusion criteria.
Due to the changes in the participant recruitment procedure, it was necessary to deviate from the preregistered analysis by performing a 3 (silence, steady-state, changing-state) x 3 (Psychology students in-person, Psychology students online, online panel) analysis to compare the effects of auditory distraction as a function of the data collection site/procedure. Note that, despite these changes, we were able to compare whether the effects varied as a function of the data collection method between Psychology students that were tested online and in-person, and we were able to compare whether the effects differed as a function of the population from which the participants were drawn (Psychology students, online panel). We were thus able to perform all of the relevant comparisons detailed in our preregistered analyses, despite the changes in the participant-recruitment plan. This comparison of the distraction effects among the different groups included valid data sets of 46 Psychology students who were tested in-person, 42 Psychology students who were tested online and the 40 valid data sets from the online panel that were first collected.
In addition to these main analyses, we also conducted separate supplementary analyses to explore how the pattern of results may change with different exclusion criteria. In this supplementary analysis, we started by including the full sets of data that were collected from the different samples and proceeded with examining smaller subsets of data by successively applying progressively stricter exclusion criteria. This analysis served to test whether the careful inspection and preprocessing of the data affect the measurement of the distraction effects. Note that the supplementary analysis included the full data set that was collected using the Prolific Academic online panel.
Results
Main comparison of the distraction effects among the different groups
We ran a 3 × 3 mixed Bayesian ANOVA on serial recall performance collapsed across serial position, with the distractor condition as a 3-level within-participants variable (silence, steady-state, changing-state) and the data collection site/procedure as a 3-level between-participant variable (Psychology students in-person, Psychology students online, online panel). As described above, these results are reported using the BFInclusion model averaging technique. The analysis of effects yielded decisive evidence for the inclusion of the two main effects (distractor condition: BFInclusion = 1.11e+14; data collection site/procedure: BFInclusion = 528.36) and very strong evidence for the interaction between the two (BFInclusion = 51.29). Given the very strong support for the presence of an interaction between data collection site/procedure and distractor condition, the interaction was explored by first comparing the different distraction effects (CSE, SSE and ISE) across the different data collection sites/procedures.
As indicated in the analysis plan, we compared the CSE (changing-state minus steady-state conditions), SSE (silence minus steady-state conditions) and ISE (silence minus changing-state conditions) across the different data collection sites/procedures using undirected Bayesian t-test for independent-samples (effect sizes of the auditory distraction effects for each group are available in ). The comparison between the two samples of Psychology students (in-person, online) revealed virtually no difference with regards to the different distraction effects (CSE: BF10 = 1.27; SSE: BF01 = 3.49; ISE: BF01 = 2.96). The comparison between the Psychology students who completed the experiment online and the online panel provided similar results as when comparing the two Psychology samples together. Even though suggests that the CSE and SSE are larger in the Psychology students online sample than in the online panel, we observed no evidence for a difference between the different distraction effects (CSE: BF01 = 1.40; SSE: BF01 = 3.13; ISE: BF10 = 1.54). Finally, the comparison between the in-person Psychology students and the online panel yielded strong evidence for the presence of larger CSE (BF10 = 23.64) and ISE (BF10 = 11.97) in the Psychology student in-person sample, while there is moderate evidence for an absence of difference between the samples with regards to the SSE (BF01 = 4.37).
Figure 2. Serial recall performance collapsed across serial position (y-axis) as a function of distractor condition (colour) and sample/procedure of collection (x-axis). Boxes are box-plots with ranges going from first to third quartiles; horizontal lines correspond to the median; vertical lines range from first quantile minus 1.5 times the inter-quartile-range to third quantile plus 1.5 times the inter-quartile-range; points are individual data points and data distribution is plotted vertically.
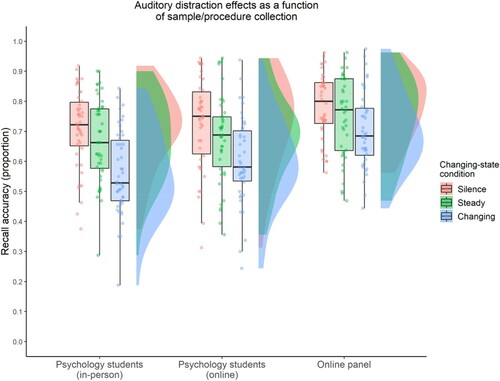
Table 1. Effect sizes by data collection site/procedure.
Exploratory analyses of the exclusion criteria
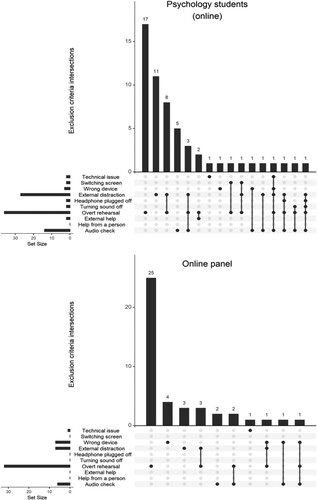
Due to the large difference between the number of participants included in the final analysis of the online groups (after applying all of the preregistered exclusion criteria) and the total number of data collected in the groups (Psychology students online: 42 analysed and 98 in the full sample; online panel: 40 analysed and 140 in the full sample), we took that opportunity to analyse the effects of applying different combinations of exclusion criteria on the effect sizes of the auditory distraction effects. shows that in the post-experiment questionnaire, 17% (Psychology students online) and 18% (online panel) of the participants responded to having used overt rehearsal as the only exclusion criterion. We also observed that 11% of the participants in the Psychology students online sample reported external distraction as the only exclusion criterion. The percentage of participants failing the final audio check was very low in the online panel (4%) but was 14% for the Psychology student online sample. Finally, responding “yes” to any other question or combinations of them was rare.
Figure 3. Analysis of response to the post-experiment questionnaires. The different questions are listed on the left with a horizontal bar representing the number of participants having responded “yes” to the question. The vertical bars represent the number of participants having responded “yes” to specific combinations of questions, each being represented by dark grey connected dots.
Taking this information into consideration, we decided to apply the following filters: (1) including all the participants tested (full sample); (2) excluding from the full sample participants who reported technical issue or not using a computer (no technical issue sample); (3) excluding from the no technical issue sample participants who reported behaviours considered as cheating (not passing the audio check, reporting external help or help from another person, turning the sound off or unplugging the headphones, no cheating sample); (4) excluding from the no cheating sample the participants who reported external distraction or switching between screens during the experiment (no distraction sample); (5) excluding from the no distraction sample participants who reported the use of overt rehearsal (no overt rehearsal sample for the online panel only); and (6) applying all the preregistered exclusion criteria that were used in the main comparison of the distraction effects among the different groups reported above (as planned sample).
indicates that for the Psychology students, the effect sizes of the different auditory distraction effects does not vary as a function of the type of exclusion criteria applied to the sample, except for the CSE for which the effect size progressively decreased with the inclusion of more participants who reported exclusion criteria (from 0.98 in the as planned sample to 0.69 in the full sample). Looking at , the pattern is even clearer for the online panel as all of the effects (including the CSE) are virtually of the same size regardless of whether data are excluded based on the preregistered exclusion criteria or not. Overall, the results indicated that the level of strictness applied when cleaning the data had a minimal impact on the effect size observed. Notably, the BFs tend to increase with sample sizes as the larger sample sizes provide more evidence in favour of the effects.
Table 2. Effect sizes of auditory distraction effects as a function of different applications of exclusion criteria in the psychology students online sample.
Table 3. Effect sizes of auditory distraction effects as a function of different applications of exclusion criteria in the online panel.
Discussion
The main question of the present study was whether the effects of auditory distraction can be studied online. The results clearly demonstrate that the effects of auditory distraction can be obtained and studied online. The ISE was replicated both in the online sample consisting of Psychology students and in the Prolific Academic sample (i.e. the online panel). What is more, key empirical signatures of auditory distraction effects were replicated in the online settings. Most importantly, the CSE (e.g. Jones et al., Citation1992) was observed to be robust even with moderate sample sizes in the online experiments. Interestingly, there was also evidence of an SSE both in the in-person experiment and in the online studies, confirming the recent observation that SSE can be robustly obtained with sample sizes ≥ 40 participants (Bell et al., Citation2019). The results thus unambiguously demonstrate that key findings of auditory distraction can be replicated online. This is notable given that examining auditory distraction in online settings can be seen as quite challenging given that there is a low degree of experimental control over the presentation of the stimulus material and the compliance of the participants.
As yet, we have only focused on whether or not key signature effects of auditory distraction can be obtained in online settings, as this was the main goal of the preregistered report. However, it is, of course, possible that, even though effects can be detected, they may be considerably smaller than the effects obtained in the laboratory. When comparing the size of the effects between the in-person sample and the online samples, there was no firm evidence that effects of auditory distraction were generally smaller in the online setting than in the laboratory. When comparing the size of the CSE between Psychology students who were tested in-person versus online, it became evident that the effects were about the same size. The results thus allowed us to reject the hypothesis that results that were obtained online are considerably smaller than those who were tested in-person. Potential reservations against online experimentation thus seem to be unsubstantiated, even when it involves the presentation of auditory distractors.
There are, however, noticeable differences between the Psychology students who were tested in-person and the online panel. First, the online panel performed somewhat better at the serial recall task than the Psychology student samples. Secondly and most importantly, the effects of auditory distraction were robustly obtained in the online panel but smaller than those shown by the Psychology students. At first glance, it may be tempting to attribute these differences to the specific characteristics of the samples that were tested. Although we cannot rule out that individual differences between the LSU Psychology student and Prolific Academic online panel in terms of working memory capacity, task-engagement or general intelligence, drives the differences in the size of the effects observed, we consider it unlikely. This is because a raft of previous studies has demonstrated that there is usually no relationship between these intrinsic factors and the magnitude of the CSE (Hughes et al., Citation2013; Körner et al., Citation2017; Sörqvist, Citation2010).
We can only speculate about other differences between the Psychology student samples and the online panel that could moderate the magnitude of the CSE. Potential differences that could be considered of importance include those pertaining to the technical equipment used by the different samples. It seems possible that the Psychology students used other technical equipment than the online panel. Auditory distraction crucially depends on acoustic factors (Schlittmeier et al., Citation2012), such as the fidelity of the auditory signal (e.g. Dorsi et al., Citation2018), thus differences in the equipment delivering the sound to the ears of the participants could moderate the magnitude of the effects observed. Other potential moderating factors include differences between the participant samples in relation to prior experience of taking part in psychological studies. Unlike the online panel, the online LSU Psychology student sample have previous experience of taking part in Psychology studies on campus under controlled laboratory settings. It is possible that the online Psychology student sample, against the online panel, endeavoured to “recreate” a controlled environment within an off-campus setting, limiting, for example, their exposure to extraneous noise and visual distractions that might weaken the auditory distraction effects under observation. Furthermore, through participating in previous Psychology studies or via exposure to course material, the Psychology students against the online panel, may adopt mnemonic strategies such as serial rehearsal that might render them particularly vulnerable to disruption via the changing-state properties of the task-irrelevant sound (Beaman & Jones, Citation1997). The differences between samples could thus be due to a range of different factors, some intrinsic (use of different mnemonic strategies) and some extrinsic (use of different technical equipment, different testing environments) so that these differences between samples must be interpreted with caution.
The discussion about the potential reasons as to why the CSE was somewhat larger for the Psychology students than for the online panel from the Prolific Academic sample should not detract from our main research question. The answer to whether auditory distraction can be studied online is a resounding yes: It is definitely possible to reproduce key findings of auditory distraction in online settings regardless of whether the sample is an online panel drawn from the general public or students enrolled on Psychology courses. First, online versus in-person testing does not differ when the same population is tested and, secondly, the absolute size of effects is rarely compared directly between Psychology students and online panels so that the critical question is whether the effects can be replicated while it is of less importance whether the effect size is exactly the same. Therefore, we cannot recommend against online testing based on the present results.
In addition to establishing that auditory distraction can be studied online, further analysis of our results yields a number of recommendations concerning the required sample size and how closely online results should be scrutinised. In relation to sample size, it might seem intuitive that larger sample size is required to detect effects of interest with online versus in-person testing. However, the auditory distraction effect sizes were of comparable magnitude in the Psychology students tested in-person and online. Further, with regard to our online Prolific Academic sample, our initial sample of 40 participants already replicated the CSE and adding another 57 participants (achieving a sample size of 97) resulted in effect sizes of comparable magnitude to the initial sample (see the comparison between no overt rehearsal and as planned samples for the different auditory distraction effects in ). Our adoption of a BF > 7 as a stopping criterion and the conduction of t-tests after running batches of 10 participants above the minimum sample of 40 should a BF > 7 not be reached, offers a cost-effective solution when the effects under exploration are robust. We note that such a method is suitable for Bayesian statistical inferences as adopted here, but not for Frequentist statical inferences where such data peeking is known to increase Type 1 error (false positivity rate), thereby requiring changes to significance thresholds (Lang, Citation2017).
Given that we assessed a number of exclusion criteria within our study, we were able to investigate to what extent the pattern of results and the magnitude of effect sizes differed in online samples when participants excluded from the original analyses were included in the supplementary analyses. and present data obtained after filtering using the different combinations of criteria for exclusion. What is striking from observing these data is that exercising the various exclusion criteria has little effect on the magnitude of the auditory distraction effects reported and their associated effect sizes (the BFs of course, change [increase] with sample size as the larger sample provides more evidence). The data suggest that there was little, if any, gain from closely scrutinising the data. Since exercising exclusion criteria results in reduced sample size and decreases the BFs reflecting the evidence in favour of a hypothesis in Bayesian statistics or the statistical power to detect effects in Frequentist statistics, there is clearly a trade-off to be made between the level of scrutiny applied (e.g. participants excluded) and the resource requirements involved in additional participant recruitment. Perhaps somewhat counterintuitively, our data suggest that careful inspection and preprocessing of the data from online testing, guided by extensive exclusion criteria based on participants’ self-reports, may be ineffective (or even counterproductive) in improving online hypothesis testing. One may thus refrain from excluding large proportions of data prior to data analysis even when analysing the data of online studies.
The capability of online testing offers researchers the opportunity to rapidly collect data. It also affords researchers from different universities to cooperate and use, in some circumstances, a common software platform for the execution of studies and data collection, thus aiding cooperation among different research groups. Online experimentation may thus complement the tool set of researchers in various ways, for example, by facilitating the inclusion of more diverse participants and by promoting the use of large sample sizes. Online testing is an important tool at the disposal of researchers to undertake research not only during the Covid-19 pandemic. However, in the face of environmental problems such as the Covid-19 pandemic and climate change, online testing yields a way of perpetuating research while socially distancing and reducing carbon footprints. Yet, a number of challenges are associated with online testing, such as the compliance of participants and a reduction of experimental control over the presentation of the stimulus material and participant’s surroundings. As any new technology, online experimentation may be met with some degree of scepticism. This scepticism is justified as long as there is uncertainty about the comparability of online and in-person data. Unique challenges may arise, for example, when presenting auditory stimuli or testing distractions online. Therefore, it is important to provide direct evidence on whether results from in-person laboratory settings can be compared with online testing. Here we provide the groundwork demonstrating that it is possible to examine the effects of auditory distraction online and we encourage, and expect to see, more studies using online experimentation in the future.
Open practices statement
The materials, simulations, data, analysis scripts, and statistical output files for this project are available on the OSF page https://osf.io/kpc9d.
Disclosure statement
No potential conflict of interest was reported by the author(s).
Notes
* Stage 2 Manuscript in the Journal of Cognitive Psychology. The Stage 1 manuscript included a different title, “Can the Irrelevant Sound Effect be Studied Online?”; However, we used a new title for the Stage 2 manuscript to reflect the findings.
** Journal submission portal would not allow entry of specific key words, therefore “auditory processing”, “short-term memory” and “working memory” were chosen.
1 Statistical analyses were finally performed using version 0.14 of the JASP statistical software, but with the same priors as described in the preregistration of the study.
References
- Banbury, S. P., Macken, W. J., Tremblay, S., & Jones, D. M. (2001). Auditory distraction and short-term memory: Phenomena and practical implications. Human Factors: The Journal of the Human Factors and Ergonomics Society, 43(1), 12–29. https://doi.org/https://doi.org/10.1518/001872001775992462
- Beaman, C. P. (2005). Auditory distraction from low-intensity noise: A review of the consequences for learning and workplace environments. Applied Cognitive Psychology: The Official Journal of the Society for Applied Research in Memory and Cognition, 19(8), 1041–1064. https://doi.org/https://doi.org/10.1002/acp.1134
- Beaman, C. P., & Jones, D. M. (1997). Role of serial order in the irrelevant speech effect: Tests of the changing-state hypothesis. Journal of Experimental Psychology: Learning, Memory, and Cognition, 23(2), 459–471. https://doi.org/https://doi.org/10.1037/0278-7393.23.2.459
- Bell, R., Dentale, S., Buchner, A., & Mayr, S. (2010). ERP correlates of the irrelevant sound effect. Psychophysiology, 47(6), 1182–1191. https://doi.org/https://doi.org/10.1111/j.1469-8986.2010.01029.x
- Bell, R., Röer, J. P., Dentale, S., & Buchner, A. (2012). Habituation of the irrelevant sound effect: Evidence for an attentional theory of short-term memory disruption. Journal of Experimental Psychology: Learning, Memory, and Cognition, 38(6), 1542. https://doi.org/https://doi.org/10.1037/a0028459
- Bell, R., Röer, J. P., Lang, A. G., & Buchner, A. (2019). Distraction by steady-state sounds: Evidence for a graded attentional model of auditory distraction. Journal of Experimental Psychology: Human Perception and Performance, 45(4), 500–512. https://doi.org/https://doi.org/10.1037/xhp0000623
- Benfield, J. A., & Szlemko, W. J. (2006). Internet-based data collection: Promises and realities. Journal of Research Practice, 2(2), D1–D1. http://jrp.icaap.org/index.php/jrp/article/view/30/51
- Ben-Shachar, M. S., Lüdecke, D., & Makowski, D. (2020). Effectsize: Estimation of effect size indices and standardized parameters. Journal of Open Source Software, 5(56), 2815. https://doi.org/https://doi.org/10.21105/joss.02815
- Berger, J. O., & Berry, D. A. (1988). Statistical analysis and the illusion of objectivity. American Scientist, 76(2), 159–165. https://www.jstor.org/stable/27855070
- Bregman, A. S. (1990). Auditory scene analysis: The perceptual organization of sound. Cambridge, MA: The MIT Press.
- Brysbaert, M. (2019). How many participants do we have to include in properly powered experiments? A tutorial of power analysis with reference tables. Journal of Cognition, 2(1), 16. https://doi.org/https://doi.org/10.5334/joc.72
- Campbell, T., Beaman, C. P., & Berry, D. C. (2002). Auditory memory and the irrelevant sound effect: Further evidence for changing-state disruption. Memory (Hove, England), 10(3), 199–214. https://doi.org/https://doi.org/10.1080/09658210143000335
- Colle, H. A., & Welsh, A. (1976). Acoustic masking in primary memory. Journal of Verbal Learning and Verbal Behavior, 15(1), 17–31. https://doi.org/https://doi.org/10.1016/S0022-5371(76)90003-7
- Cowan, N. (1995). Attention and memory: An integrated framework. Oxford: Oxford University Press.
- Dienes, Z. (2016). How Bayes factors change scientific practice. Journal of Mathematical Psychology, 72, 78–89. https://doi.org/https://doi.org/10.1016/j.jmp.2015.10.003
- Dorsi, J., Viswanathan, N., Rosenblum, L. D., & Dias, J. W. (2018). The role of speech fidelity in the irrelevant sound effect: Insights from noise-vocoded speech backgrounds. Quarterly Journal of Experimental Psychology, 71(10), 2152–2161. https://doi.org/https://doi.org/10.1177/1747021817739257
- Ellermeier, W., & Hellbrück, J. (1998). Is level irrelevant in "irrelevant speech"? Effects of loudness, signal-to-noise ratio, and binaural unmasking. Journal of Experimental Psychology: Human Perception and Performance, 24(5), 1406–1414. https://doi.org/https://doi.org/10.1037/0096-1523.24.5.1406
- Ellermeier, W., & Zimmer, K. (1997). Individual differences in susceptibility to the “irrelevant speech effect”. The Journal of the Acoustical Society of America, 102(4), 2191–2199. https://doi.org/https://doi.org/10.1121/1.419596
- Ellermeier, W., & Zimmer, K. (2014). The psychoacoustics of the irrelevant sound effect. Acoustical Science and Technology, 35(1), 10–16. https://doi.org/https://doi.org/10.1250/ast.35.10
- Elliott, E. M. (2002). The irrelevant-speech effect and children: Theoretical implications of developmental change. Memory & Cognition, 30(3), 478–487. https://doi.org/https://doi.org/10.3758/BF03194948
- Elliott, E. M., Marsh, J. E., Zeringue, J., & McGill, C. I. (2020). Are individual differences in auditory processing related to auditory distraction by irrelevant sound? A replication study Memory & Cognition, 48(1), 145–157. https://doi.org/https://doi.org/10.3758/s13421-019-00968-8
- Henninger, F., Shevchenko, Y., Mertens, U. K., Kieslich, P. J., & Hilbig, B. E. (2019, January 16). lab.js: A free, open, online study builder.
- Hughes, R. W. (2014). Auditory distraction: A duplex-mechanism account. PsyCh Journal, 3(1), 30–41. https://doi.org/https://doi.org/10.1002/pchj.44
- Hughes, R. W., Hurlstone, M. J., Marsh, J. E., Vachon, F., & Jones, D. M. (2013). Cognitive control of auditory distraction: Impact of task difficulty, foreknowledge, and working memory capacity supports duplex-mechanism account. Journal of Experimental Psychology: Human Perception and Performance, 39(2), 539–553. https://doi.org/https://doi.org/10.1037/a0029064
- Hughes, R. W., & Marsh, J. E. (2017). The functional determinants of short-term memory: Evidence from perceptual-motor interference in verbal serial recall. Journal of Experimental Psychology: Learning, Memory, and Cognition, 43(4), 537–551. https://doi.org/https://doi.org/10.1037/xlm0000325
- Hughes, R. W., & Marsh, J. E. (2020). When is forewarned forearmed? Predicting auditory distraction in short-term memory. Journal of Experimental Psychology: Learning, Memory, and Cognition, 46(3), 427–442. https://doi.org/https://doi.org/10.1037/xlm0000736
- Hughes, R. W., Vachon, F., & Jones, D. M. (2007). Disruption of short-term memory by changing and deviant sounds: Support for a duplex-mechanism account of auditory distraction. Journal of Experimental Psychology: Learning, Memory, and Cognition, 33(6), 1050–1061. https://doi.org/https://doi.org/10.1037/0278-7393.33.6.1050
- JASP Team. (2018). JASP (version 0.14)[Computer software]. https://jasp-stats.org/.
- Jensen, C., & Thomsen, J. P. F. (2014). Self-reported cheating in web surveys on political knowledge. Quality & Quantity: International Journal of Methodology, 48(6), 3343–3354. https://doi.org/https://doi.org/10.1007/s11135-013-9960-z
- Jones, D., Farrand, P., Stuart, G., & Morris, N. (1995). Functional equivalence of verbal and spatial information in serial short-term memory. Journal of Experimental Psychology: Learning, Memory, and Cognition, 21(4), 1008–1018. https://doi.org/https://doi.org/10.1037/0278-7393.21.4.1008
- Jones, D., Madden, C., & Miles, C. (1992). Privileged access by irrelevant speech to short-term memory: The role of changing state. The Quarterly Journal of Experimental Psychology Section A, 44(4), 645–669. https://doi.org/https://doi.org/10.1080/14640749208401304
- Jones, D. M., & Macken, W. J. (1993). Irrelevant tones produce an irrelevant speech effect: Implications for phonological coding in working memory. Journal of Experimental Psychology: Learning, Memory, and Cognition, 19(2), 369–381. https://doi.org/https://doi.org/10.1037/0278-7393.19.2.369
- Jones, D. M., Macken, W. J., & Murray, A. C. (1993). Disruption of visual short-term memory by changing-state auditory stimuli: The role of segmentation. Memory & Cognition, 21(3), 318–328. https://doi.org/https://doi.org/10.3758/BF03208264
- Jones, D. M., Macken, W. J., & Nicholls, A. P. (2004). The phonological store of working memory: Is it phonological and is it a store?. Journal of Experimental Psychology: Learning, Memory, and Cognition, 30(3), 656–674. https://doi.org/https://doi.org/10.1037/0278-7393.30.3.656
- Klatte, M., Kilcher, H., & Hellbrück, J. (1995). Wirkungen der zeitlichen Struktur von Hintergrundschall auf das Arbeitsgedächtnis und ihre theoretischen und praktischen Implikationen [The effects of temporal structure of background noise on working memory: Theoretical and practical implications]. Zeitschrift Fur Experimentelle Psychologie, 42(4), 517–544. https://psycnet.apa.org/record/1996-04667-002
- Klatte, M., Lachmann, T., Schlittmeier, S., & Hellbrück, J. (2010). The irrelevant sound effect in short-term memory: Is there developmental change? European Journal of Cognitive Psychology, 22(8), 1168–1191. https://doi.org/https://doi.org/10.1080/09541440903378250
- Körner, U., Röer, J. P., Buchner, A., & Bell, R. (2017). Working memory capacity is equally unrelated to auditory distraction by changing-state and deviant sounds. Journal of Memory and Language, 96, 122–137. https://doi.org/https://doi.org/10.1016/j.jml.2017.05.005
- Lang, A.-G. (2017). Is intermediately inspecting statistical data necessarily a bad research practice? The Quantitative Methods for Psychology, 13(2), 127–140. https://doi.org/https://doi.org/10.20982/tqmp.13.2.p127
- LeCompte, D. C., Neely, C. B., & Wilson, J. R. (1997). Irrelevant speech and irrelevant tones: The relative importance of speech to the irrelevant speech effect. Journal of Experimental Psychology: Learning, Memory, and Cognition, 23(2), 472–483. https://doi.org/https://doi.org/10.1037/0278-7393.23.2.472
- Leding, J. K. (2019). Intentional memory and online data collection: A test of the effects of animacy and threat on episodic memory. Journal of Cognitive Psychology, 31(1), 1–12. https://doi.org/https://doi.org/10.1080/20445911.2018.1564756
- Lee, M. D., & Wagenmakers, E.-J. (2013). Bayesian cognitive modeling. Cambridge: Cambridge University Press.
- Lefever, S., Dal, M., & Matthíasdóttir, Á. (2007). Online data collection in academic research: Advantages and limitations. British Journal of Educational Technology, 38(4), 574–582. https://doi.org/https://doi.org/10.1111/j.1467-8535.2006.00638.x
- Marsh, J. E., Marois, A., Hurlstone, M. J., Ball, L. J., Moore, S. B., Vachon, F., Schlittmeier, S., … Buchner, A. (2022). Changing-state irrelevant speech disrupts visual-verbal but not visual-spatial serial recall: Implications for modularity, functional equivalence, and theories of auditory distraction in short-term memory. Manuscript submitted.
- Marsh, J. E., Röer, J. P., Bell, R., & Buchner, A. (2014). Predictability and distraction: Does the neural model represent postcategorical features? PsyCh Journal, 3(1), 58–71. https://doi.org/https://doi.org/10.1002/pchj.50
- Mason, W., & Suri, S. (2012). Conducting behavioral research on Amazon’s mechanical Turk. Behavior Research Methods, 44(1), 1–23. https://doi.org/https://doi.org/10.3758/s13428-011-0124-6
- Morey, R. D., & Rouder, J. N. (2015). BayesFactor Package (version 0.9.12–2). http://bayesfactorpcl.r-forge.r-project.org/.
- Neath, I. (2000). Modeling the effects of irrelevant speech on memory. Psychonomic Bulletin & Review, 7(3), 403–423. https://doi.org/https://doi.org/10.3758/BF03214356
- Oberauer, K., Lewandowsky, S., Awh, E., Brown, G. D. A., Conway, A., Cowan, N., Donkin, C., … Ward, G. (2018). Benchmarks for models of short-term and working memory. Psychological Bulletin, 144(9), 885–958. https://doi.org/https://doi.org/10.1037/bul0000153
- Open Science Collaboration. (2015). Estimating the reproducibility of psychological science. Science, 349(6251), 943. https://doi.org/https://doi.org/10.1126/science.aac4716
- R Core Team. (2021). R: A language and environment for statistical computing. Vienna, Austria. Retrieved from https://checkpoint.urlprotection.com/v1/url?o=http%3A//www.rproject.org/&g=NmQxMjMyNmNiZDVhMGFlNw==&h=NDEzYzRhZGFmZDc2MTY3MzJlMzhkMTY4YjNhMDJkMWQzMjU0OGZiMWMyOTJlM2ZhZjA3OWI2ODVlNDczNzMzMg==&p=Y3AxZTp1Y2xhbmxpdmU6Y2hlY2twb2ludDpvZmZpY2UzNjVfZW1haWxzX2VtYWlsOjZlNDhhNTQxNzExOTFlYzQzMDU5NmFkOGRiYzE1YjE5On
- Reips, U.-D. (2008). How internet-mediated research changes science. In A. Barak (Ed.), Psychological aspects of cyberspace: Theory, research, applications (pp. 268–294). Cambridge: Cambridge University Press.
- Rouder, J. N. (2014). Optional stopping: No problem for bayesians. Psychonomic Bulletin & Review, 21(2), 301–308. https://doi.org/https://doi.org/10.3758/s13423-014-0595-4
- Salamé, P., & Baddeley, A. D. (1982). Disruption of short-term memory by unattended speech: Implications for the structure of working memory. Journal of Verbal Learning and Verbal Behavior, 21(2), 150–164. https://doi.org/https://doi.org/10.1016/S0022-5371(82)90521-7
- Schlittmeier, S. J., & Hellbrück, J. (2009). Background music as noise abatement in open-plan offices: A laboratory study on performance effects and subjective preferences. Applied Cognitive Psychology: The Official Journal of the Society for Applied Research in Memory and Cognition, 23(5), 684–697. https://doi.org/https://doi.org/10.1002/acp.1498
- Schlittmeier, S. J., Hellbrück, J., & Klatte, M. (2008). Does irrelevant music cause an irrelevant sound effect for auditory items? European Journal of Cognitive Psychology, 20(2), 252–271. https://doi.org/https://doi.org/10.1080/09541440701427838
- Schlittmeier, S. J., Weißgerber, T., Kerber, S., Fastl, H., & Hellbrück, J. (2012). Algorithmic modeling of the irrelevant sound effect (ISE) by the hearing sensation fluctuation strength. Attention, Perception, & Psychophysics, 74(1), 194–203. https://doi.org/https://doi.org/10.3758/s13414-011-0230-7
- Schönbrodt, F. D., &Stefan, A. M. (2019). BFDA: An R package for Bayes factor design analysis (version 0.5.0). Retrieved from https://checkpoint.url-protection.com/v1/url?o=https%3A//github.com/nicebread/BFDA&g=MTBkNzg0ZTVhZjA0YjIzNA==&h=NTQ1ZGY4OTYzY2Q0MzU2YmM5MWFkZThkOTcwNmRiZjg0MDg2Y2E5ZWQ3NjYxYjA5NmFlNTBlZGNjNThjZmZiNQ==&p=Y3AxZTp1Y2xhbmxpdmU6Y2hlY2tw
- Schönbrodt, F. D., & Wagenmakers, E. (2018). Bayes factor design analysis: Planning for compelling evidence. Psychonomic Bulletin & Review, 25(1), 128–142. https://doi.org/https://doi.org/10.3758/s13423-017-1230-y
- Schönbrodt, F. D., Wagenmakers, E., Zehetleitner, M., & Perugini, M. (2017). Sequential hypothesis testing with Bayes factors: Efficiently testing mean differences. Psychological Methods, 22(2), 322–339. https://doi.org/https://doi.org/10.1037/met0000061
- Schweppe, J., & Knigge, J. (2020). Irrelevant music: How suprasegmental changes of a melody’s tempo and mode affect the disruptive potential of music on serial recall. Memory & Cognition, 48(6), 982–993. https://doi.org/https://doi.org/10.3758/s13421-020-01037-1
- Sörqvist, P. (2010). High working memory capacity attenuates the deviation effect but not the changing-state effect: Further support for the duplex-mechanism account of auditory distraction. Memory & Cognition, 38(5), 651–658. https://doi.org/https://doi.org/10.3758/MC.38.5.651
- Tremblay, S., Nicholls, A. P., Alford, D., & Jones, D. M. (2000). The irrelevant sound effect: Does speech play a special role. Journal of Experimental Psychology: Learning, Memory, and Cognition, 26(6), 1750–1754. https://doi.org/https://doi.org/10.1037/0278-7393.26.6.1750
- van Doorn, J., van den Bergh, D., Bohm, U., Dablander, F., Derks, K., Draws, T., Etz, A., Evans, N. J., … Wagenmakers, E. (2019, January 23). The JASP guidelines for conducting and reporting a Bayesian analysis. Psychonomic Bulletin & Review, 28(3), 813–826. https://doi.org/https://doi.org/10.3758/s13423-020-01798-5
- Wagenmakers, E.-J., Love, J., Marsman, M., Jamil, T., Ly, A., Verhagen, J., Selker, R., … Morey, R. D. (2018). Bayesian inference for psychology. Part II: Example applications with JASP. Psychonomic Bulletin & Review, 25(1), 58–76. https://doi.org/https://doi.org/10.3758/s13423-017-1323-7
- Woods, K. J. P., Siegel, M., Traer, J., & McDermott, J. H. (2017). Headphone screening to facilitate web-based auditory experiments. Attention, Perception, & Psychophysics, 79(7), 2064–2072. https://doi.org/https://doi.org/10.3758/s13414-017-1361-2