
ABSTRACT
The addition of environmentally friendly items to conventional items sometimes leads people to believe that the carbon footprint of the entire set decreases rather than increases. This negative footprint illusion is supposedly underpinned by an averaging bias: people base environmental impact estimates not on the total impact of items but on their average. Here, we found that the illusion’s magnitude increased with the addition of a greater number of “green” items when the number of conventional items remained constant (Studies 1 and 2), supporting the averaging-bias account. We challenged this account by testing what happens when the number of items in the conventional and “green” categories vary while holding the ratio between the two categories constant (Study 3). At odds with the averaging-bias account, the magnitude of the illusion increased as the category size increased, revealing a category-size bias, and raising questions about the interplay between these biases in the illusion.
Climate change is one of the greatest challenges of modern times (IPCC, Citation2021), and it is often exacerbated by human decision-making. Overcoming psychological barriers in decision-making (e.g. the use of heuristics that might bias both individual and group-based judgments; Engler et al., Citation2019) remains critical in tackling climate change (Gifford, Citation2011). Evidence indicates that people consistently act in ways that harm the environment, even when they believe their actions to be environmentally friendly (Holmgren et al., Citation2021; Sörqvist & Langeborg, Citation2019; Threadgold et al., Citation2021). For example, people tend erroneously to conclude that adding environmentally certified “green” products (e.g. eco-friendly houses) to a set of conventional products (e.g. conventional houses) compensates for the carbon footprint of the latter, even though such environmentally friendly or “green” products also possess a carbon footprint, albeit a smaller one than conventional items.
In one key study demonstrating this effect, it was shown that by adding an organic apple to a hamburger, people estimate the environmental impact of the whole meal to decrease, when compared to the hamburger alone (Gorissen & Weijters, Citation2016). The phenomenon identified by Gorissen and Weijters (Citation2016) is commonly termed the negative footprint illusion. This illusion has been shown to be highly robust, for example, it appears to be insensitive to levels of expertise (Holmgren, Kabanshi, et al., Citation2018) and framing effects (Holmgren et al., Citation2019). It also appears resistant to variations in the dependent measure (Holmgren et al., Citation2021; e.g. carbon footprint estimates vs. estimates of carbon dioxide emissions) or response scales (Gorissen & Weijters, Citation2016; Sörqvist & Holmgren, Citation2022), and arises in both between-participant and within-participant experimental designs (Holmgren, Andersson, et al., Citation2018; Holmgren, Kabanshi, et al., Citation2018).
The concept of an “averaging bias” has been proposed as a possible explanation for the negative footprint illusion (Holmgren, Andersson, et al., Citation2018). According to this account, the illusion occurs because people tend to average the carbon footprint of the “green” and the conventional objects in a set, instead of calculating their sum, as if the “green” items compensate for the negative effects of the conventional items. Averaging bias appears to be a feasible explanation not only of the negative footprint illusion but also of other phenomena reflecting people’s seemingly fragile understanding of the environmental impacts of carbon dioxide (CO2) emissions. For example, the averaging bias explains why people exaggerate the benefits of low emission rates (Holmgren, Kabanshi, et al., Citation2018) and might be partly to blame for why people sometimes misunderstand the stock-flow relationship of the CO2 accumulation in the atmosphere (Chen, Citation2011; Newell et al., Citation2016; Sterman & Sweeney, Citation2007; Sterner et al., Citation2019).
Although an averaging bias is often referred to as the explanation of the negative footprint illusion (Holmgren et al., Citation2019; Holmgren, Kabanshi, et al., Citation2018; Sörqvist & Holmgren, Citation2022; Threadgold et al., Citation2021), direct evidence for this account has only been reported once in past research (Holmgren, Andersson, et al., Citation2018). In the study by Holmgren, Andersson, et al. (Citation2018), it was shown that mean estimates of the carbon footprint of a set of environmentally friendly and conventional items in combination fall in between mean estimates of the conventional items alone and mean estimates of the environmentally friendly items alone. In the current paper, we aimed to test other predictions of the averaging-bias account and provide further direct evidence in support of (or potentially to undermine) this averaging account.
The averaging-bias account of the negative footprint illusion predicts that the magnitude of the effect should increase with an increasing number of “green” objects in the category set, so long as the number of conventional items remains the same. For example, consider the following scenario: One hundred conventional buildings are being built with a combined energy consumption of 2,500,000 kWh per year and 25,000 kWh per building on average. If one adds 30 environmentally certified or “green” buildings with an energy consumption of 10,000 kWh per year, the sum of the combined sets would be 2,800,000 kWh, but the average (per building) would be lower (i.e. 21,538 kWh). As one adds more “green” buildings to the combined set, the summed energy consumption increases whereas the average energy consumption per building decreases. Thus, if the negative footprint illusion is underpinned by an averaging bias, then estimates of the combined set should approach the items’ average instead of their sum when more “green” items are added.
In some instances, it has been claimed that people are, in fact, insensitive to the number of “green” items in a set (Kim & Schuldt, Citation2018; Kusch & Fiebelkorn, Citation2019). In Kim and Schuldt’s (Citation2018) study, participants reported as much ecological footprint for a single (relatively environmentally friendly) “hybrid” car as for a set of two “hybrid” cars, suggesting that the quantity of “green”, relative to conventional, items, did not matter. This finding is in line with the averaging bias since the average ecological footprint of two “hybrid” cars is equal to that of a single “hybrid” car alone. To date, however, it is unclear whether people are genuinely insensitive to the quantity of the “green” items in a set, or whether the response pattern observed by Kim and Schuldt (Citation2018) is a by-product of the relatively small category size used in their experiment. In Study 1, we aimed to arbitrate between these two possibilities.
Study 1
The aim of Study 1 was to determine whether participants are indeed insensitive to the quantity of “green” houses added to a fixed set of conventional houses, or whether the magnitude of the negative footprint illusion increases with the quantity of “green” houses. Therefore, the magnitude of the negative footprint illusion was compared between a condition where a small set of “green” houses was added to a fixed set of 30 conventional houses and a condition wherein a large set of “green” houses was added to the same set of 30 conventional houses. The averaging account predicts that the negative footprint illusion should be larger when a large set of “green” houses is added, as long as the number of conventional houses remains constant.
Method
Participants
A total of 66 participants (67% female) took part in the study (Mage = 31.15 years old, SDage = 10.74). To obtain an estimate of an appropriate sample size, an a priori power analysis was calculated using G*Power (Faul et al., Citation2007). The effect size of the negative footprint illusion reported in Sörqvist and Holmgren (Citation2022) was used as a basis of the calculation. The effect size in their within-participants experiment was dz = 0.53 in the condition where participants were allowed a long response time, which is similar to the current study. This is slightly larger than the conventional, but arbitrary value of d = .5 for a moderate effect size (Cohen, Citation1988) however it is well-established that published effect sizes are often overestimates for a variety of reasons (e.g. sampling error and/or publication bias), so we aimed to be powered to detect effects slightly smaller than those observed by Sörqvist and Holmgren (Citation2022) and also just below this (equally arbitrary) convention. Given α = β = .05, and a two-tailed, paired-sample t-test, it was determined that a sample size of 67 participants would be adequate to detect an effect size of dz = .45. Participants were recruited via Prolific Academic and received the standard platform payment rate for their participation. Within the results section, Cohen’s d is reported as a measure of effect size for pairwise comparisons. Further, for all pairwise comparisons, Bayes factors are computed using a Cauchy prior with a scaling factor set to 1 (Rouder et al., Citation2009). The strength of evidence was defined using the categorisation scheme developed by Jeffreys (Citation1961) and updated by Lee and Wagenmakers (Citation2014). The research protocol was approved by the Psychology and Social Work Ethics Committee (Ref: 507) at the University of Central Lancashire, UK.
Design
A within-participants design was employed, with the independent variable being the number of “green” houses that were added to the fixed set of 30 conventional houses. This independent variable had two levels: “large” addition (+150 “green” houses) versus “small” addition (+10 “green” houses). The two conditions were counterbalanced across participants. The dependent variable was CO2 emissions estimates.
Materials and procedure
Data were collected by means of a web-based questionnaire created using Qualtrics and distributed to respondents residing in the UK via the Prolific Academic crowdsourcing platform. All participants were informed that they were to take part in a study regarding decision-making in relation to environmental impact. The first part of the questionnaire explained the term “carbon footprint” and clarified that a higher carbon footprint has a greater negative impact on the environment compared to a lower carbon footprint. In the next part of the questionnaire, participants were presented with a figure depicting 30 conventional houses with the appurtenant information stating:
These conventional houses – presented in yellow – represent 30 houses in one community. All these houses are made from the same materials and have the same performance and characteristics. Imagine that the total carbon dioxide emissions of the 30 houses are a “0” on the scale below.
Now imagine that 150 / 10 environmentally certified houses are built in the same community so that the community now consists of 30 conventional houses and 150 / 10 environmentally certified houses. Environmentally certified houses have low environmental impact and are designed and built using materials and technology that reduces their carbon footprint and lowers their energy requirements.
Results
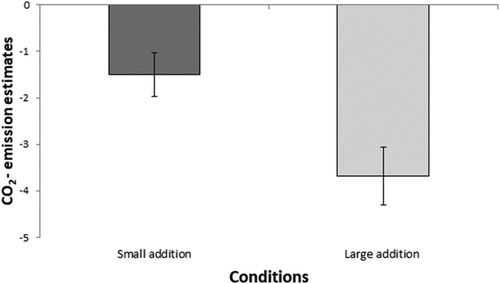
As shown in , participants estimated that the CO2 emissions in both the large and small conditions decreased from the zero-baseline level when “green” houses were added, thus replicating the existence of a negative footprint illusion. The magnitude of the negative footprint illusion relative to baseline was shown to be statistically significant with a one-sample t-test for the small addition condition, t(65) = 3.20, p = .002, Cohen’s dz = 0.39, BF10 = 13.07 (representing strong evidence for H1), and the large addition condition, t(65) = 5.97, p < .001, Cohen’s dz = 0.73, BF10 = 126040.64 (representing extreme evidence for H1). Furthermore, a paired samples t-test revealed the CO2 emissions estimates were significantly lower in the large addition condition compared to the small addition condition; t(65) = 4.40, p < .001, Cohen’s d = 0.49, BF10 = 476.77 (representing extreme evidence for H1).
Figure 1. Mean CO2 emission estimates after 10 “green” buildings have been added to a set of 30 conventional buildings (small addition condition) and mean CO2 emission estimates after 150 “green” buildings have been added to a set of 30 conventional buildings (large addition condition). Error bars represent standard error of the means.
Discussion
The findings from Study 1 replicate the presence of a negative footprint illusion with houses. Critically, the findings reveal that people are sensitive to the quantity of “green” houses added to a set of conventional houses, and this contrasts with findings by both Kim and Schuldt (Citation2018), looking at hybrid and conventional cars, and Kusch and Fiebelkorn (Citation2019), looking at beef, vegetarian, and insect burgers.
The current findings indicate that the magnitude of the negative footprint illusion increases with the number of “green” items that are added to conventional items. The addition of 150 “green” houses resulted in a markedly greater negative footprint illusion than the addition of 10 “green” houses, to a fixed set of 30 conventional houses. This finding is consistent with an averaging-bias explanation of the negative footprint illusion, which has been supported across a range of studies (e.g. Gorissen & Weijters, Citation2016; Holmgren, Andersson, et al., Citation2018; Holmgren, Kabanshi, et al., Citation2018).
Study 2
The dependent measure used in Study 1 informed participants that the conventional buildings were marked as “zero” on the scale. Participants were then asked to make their estimate on a scale from −10 to +10, from the starting point of “0”. It is highly anomalous for the carbon footprint of any carbon-producing items to equate to zero. This raises the possibility that participants potentially misinterpreted the response scale in two ways. First, they might have deemed the carbon emissions of the conventional buildings to be “0” (in other words no carbon footprint), instead of taking this as an indication that the items merely represented zero on a scale. Second, there could be a mistaken interpretation that a “green” house might be what is termed a “zero carbon house”, whereby the building does not increase the amount of CO2 in the atmosphere (net carbon emissions) over a year by, for example, generating its own energy from renewable sources to sustain its energy demands, or by delivering surplus energy back to the grid.
Although we report elsewhere (Holmgren et al., Citation2021) that the outcomes of the critical judgment task are independent of the starting point of “0” on the scale, and the negative footprint illusion appears to be insensitive to this type of detail in the experimental setup (Sörqvist & Holmgren, Citation2022), it is advisable to address this potential methodological concern in the context of the different scenarios used here. The aim of Study 2 was to address these two issues utilising two implementations: (i) anchoring participants to a midpoint on the scale, as opposed to “0”, and (ii) checking participants’ understanding of the carbon footprint of a “green” house in comparison to a zero-carbon “white” house, while also allowing replication of Study 1.
Method
Participants
An a priori power analysis was calculated using G*Power (Faul et al., Citation2007) again using previously obtained effect sizes of the negative footprint illusion, in this case those of the small addition condition of Study 1 (dz = .39) and once again arbitrarily adjusting downwards to ensure that power estimates remained conservative. Given α = β = .05, a sample size of 129 participants would be adequate to detect an effect of size dz = .32. A total of 133 participants took part in the study. Five participants were removed from the final analysis for incorrectly responding that a zero-carbon house had a higher carbon footprint than a “green” house. Thus, data from 128 participants (59% female; Mage = 33.68 years old, SDage = 12.41) were retained.
Participants were recruited via Prolific Academic and received the standard platform payment rate for their participation. The experimental protocol was approved by the Psychology and Social Work Ethics Committee (Ref: 507) at the University of Central Lancashire, UK.
Design
A within-participants design was employed. The independent variable was the number of “green” houses that were added to the fixed set of 30 conventional houses; this had two levels: 10 “green” houses (small addition) versus 150 “green” houses (large addition). The two addition conditions were counterbalanced across participants. The dependent variable, consistent with Study 1, was CO2 emissions estimates. The participants were also required to read a description of a “zero” house (white) and a description of an “environmentally certified” (“green”) house. They were asked to judge which one of these two types of houses had a greater carbon footprint. The aim of this question was to ensure that participants were not making an incorrect interpretation that an environmentally certified house was a “zero carbon” house. The presentation of this question was counterbalanced to appear either before or after the CO2 emissions estimates.
Materials and procedure
Data were collected by means of a web-based questionnaire, created using Qualtrics. The questionnaire was distributed to respondents residing in the UK via the Prolific Academic crowdsourcing platform. All participants were informed that they were to take part in a study regarding decision making in relation to environmental impact. Consistent with Study 1, the first part of the questionnaire explained the term “carbon footprint” and clarified that a higher carbon footprint results in a greater negative impact on the environment, compared to a lower carbon footprint.
In the next part of the questionnaire, participants were presented with a figure of 30 conventional houses with the appurtenant information stating:
These conventional houses – presented in yellow – represent 30 houses in one community. All these houses are made from the same materials and have the same performance and characteristics. The total carbon emissions for the 30 yellow houses is marked on the scale below as “total carbon emissions for the 30 yellow houses.”
Now imagine that 10 environmentally certified houses are built in the same community so that the community now consists of 30 conventional houses and 10 environmentally certified houses. Environmentally certified houses have low environmental impact and are designed and built using materials and technology that reduces their carbon footprint and lowers their energy requirements.
Participants were also asked to make a judgment about whether a white house or a green house has a greater carbon footprint. To this end, a white (zero carbon) house was depicted, with the accompanying information stating: “The white house below represents a zero-carbon house. Zero carbon houses maximise energy efficiency and renewable energy. Their net carbon footprint is zero”. This statement was followed by a picture of a “green” (environmentally certified) house with the accompanying information: “The green house below represents an environmentally certified house. Environmentally certified houses are designed and built using materials and technology that reduces their energy requirements. Their net carbon footprint is low”. After reading each brief description, participants were asked to check a box next to either the “white” or “green” house in response to the following question: “Which of the above coloured houses produces a greater carbon footprint? (Please select)”.
Results
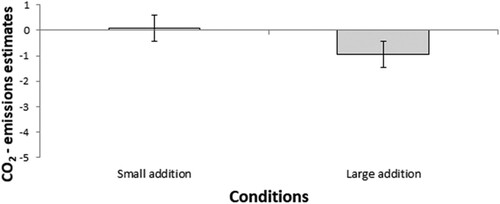
A total of 96% of participants correctly responded that a “green” house had a greater carbon footprint than a white house. The 4% who did not respond correctly (incorrectly rating a white house as having a greater carbon footprint than a “green” house; N = 5) had their responses removed from the dataset prior to analysis. As can be seen in , participants estimated that the CO2 emissions would decrease from the baseline level only in the large condition (the addition of 150 “green” houses). A one-sample t-test (relative to baseline) demonstrated a negative footprint illusion for the large condition, t(127) = 2.08, p = .039, Cohen’s dz = 0.37, BF10 = 0.79. By conventional standards, this Bayes factor is small and therefore the significant t-value should be treated with caution. However, contrary to Study 1, a one-sample t-test (relative to baseline) was not found to be statistically significant for the small addition condition, t(127) = 0.43, p = .668, Cohen’s dz = 0.08, BF10 = 0.11 (representing moderate evidence for H0). In terms of the magnitude of the illusion relative to the size of the “green” additions, CO2 emissions estimates were significantly lower in the large addition condition, in comparison to the small addition condition, as indicated by a paired sample t-test, t(127) = 2.62, p = .010, Cohen’s d = 0.26, BF10 = 2.60 (representing only “anecdotal” level evidence for H1).
Figure 2. Mean CO2 estimates after 10 “green” buildings have been added to a set of 30 conventional buildings (small addition condition) and mean CO2 emission estimates after 150 “green” buildings have been added to a set of 30 conventional buildings (large addition condition). Error bars represent standard error of the means.
Discussion
The findings reveal that most participants (96%) successfully interpreted the “green” house as having a greater carbon footprint than the white house. Therefore, the overall findings represent data from participants who did not misinterpret a “green” house as a zero-carbon house. Study 2 revealed a negative footprint illusion (i.e. the mean change in total CO2 emissions estimates was significantly different from the baseline) in the large addition condition (the addition of 150 “green” houses), but not in the small addition condition (the addition of 10 “green” houses). This contrasts with Study 1, in which a negative footprint illusion was demonstrated with both a small addition of 10 “green” houses and with a large addition comprised of 150 “green” houses. In Study 2, it is worth noting that although the results from the small addition condition were not different from the starting point of zero (in either a positive or a negative direction), what appears to have arisen instead is what can be referred to as a “zero footprint illusion”, whereby participants judge that the addition of “green” items does not have any material effect on the carbon emissions (see also Holmgren et al., Citation2021 and Threadgold et al., Citation2021).
This discrepancy in findings between Study 1 and Study 2, as reflected in the absence of a negative footprint illusion in the small category condition, is potentially accounted for by the different response scales implemented across the two studies. In particular, it is possible that CO2 emissions ratings are sensitive to the semantics of the scale endpoints. For example, Study 2 implemented a scale from −10 (“A very large decrease in carbon emissions”) to +10 (“A very large increase in carbon emissions”). The participants were only provided with the text labels, with the numerical labels inferred for the purposes of analysis. The use of the term “very” may have inadvertently truncated responses. In other words, participants were potentially less likely to utilise the scale ends, instead responding around the centre of the scale, thus diluting the observation of any negative footprint illusion. Lending some support to this suggestion, an examination of the standard deviations for the small addition condition indicates that they were much smaller here (2.46) than in the corresponding condition of Study 1 (3.81).
In line with this latter suggestion, we note that previous research indicates that the use of extreme scale endpoints (e.g. the use of terms that might be considered “intensive” in meaning, such as “very” or “strongly”) have the potential to impact response distributions (e.g. Wyatt & Meyers, Citation1987). Also, some studies have found that having a midpoint on the response scale can impact the response (e.g. Chyung et al., Citation2017). It is also worth noting that Sörqvist and Holmgren (Citation2022) have found that the negative footprint illusion is robust to several methodological considerations, such as the use of ratio scales (kg CO2 emissions; see also Holmgren, Kabanshi, et al., Citation2018) and low versus high time pressure. Thus, the findings of Study 2 are potentially impacted by what is known as the “Intensity Hypothesis” or the concept of reduced endorsement of more intense response categories (Weijters et al., Citation2013).
Study 3
Although Studies 1 and 2 demonstrate that the magnitude of the negative footprint illusion is sensitive to the number of “green” houses added to a set of conventional houses, there is a critical confound between the addition of “green” houses and the change in the ratio of conventional and “green” houses under consideration. To the best of our knowledge, all previously published papers on the negative footprint illusion (and indeed Study 1 and 2 presented here) report experiments wherein the ratio between the “green” items and the conventional items in the combined sets has varied alongside the number of “green” additions. No research has made the crucial comparison between the magnitude of the illusion for a large set (e.g. 400 conventional houses and 100 “green” houses) and for a small set (e.g. 40 conventional houses and 10 “green” houses) wherein the ratio between the conventional and the “green” items is held constant (e.g. 1:4). On this view, it might, be the number of “green” items that drive the negative footprint illusion (i.e. a category-size bias), rather than an averaging process. In other words, the difference between the large addition and the small addition conditions in Studies 1 and 2 could be a consequence of a larger “green” category of items in the large addition condition, rather than an effect of averaging.
Research on probability judgments has shown that people estimate an outcome as more likely to occur when the category size is larger compared to an alternative category of a smaller size. For example, in one experiment, participants perceived that they had a higher chance of winning if the colour of their lottery ticket matched many (vs. few) of the other tickets in the lottery pool, even in circumstances where the colour of the tickets was irrelevant for the outcome (Isaac & Brough, Citation2014; but see Perfecto et al., Citation2018). This phenomenon has been termed a category-size bias.
To investigate whether category-size influences the magnitude of the negative footprint illusion, a new study was designed wherein the sizes of the categories of conventional and “green” houses were manipulated, but the ratio between conventional and “green” houses within the whole item set was held constant. Thus, three item sets were fashioned: 4 conventional houses +1 environmentally certified “green” house (the small category condition); 40 conventional houses +10 environmentally certified “green” houses (the medium category condition) and 400 conventional houses +100 environmentally certified “green” houses (the large category condition). Here, the averaging account predicts that the negative footprint illusion would be the same in magnitude across all conditions (since the average is necessarily the same). However, should category size yield an impact on the magnitude of the illusion, we would predict the negative footprint illusion in the three conditions to increase in magnitude as a function of the number of “green” items (i.e. the size of the category). To ensure consistency with and generalizability to Studies 1 and 2, the dependent variable of total CO2 emissions estimates was retained for Study 3.
Method
Participants
An a priori power analysis was calculated using G*Power (Faul et al., Citation2007) for a 1-way, repeated measures ANOVA. Given α = β = .05, the conventional assumption that the average population correlation between the two levels of the repeated measures factor is ρ = .5, and once again an arbitrarily conservative estimate of the effect size—in this case fz = .14 (where Cohen’s d = 2f)—it was determined that 154 participants would be required to reach this standard of power in this analysis. Participants were recruited via Prolific Academic and received the standard platform payment rate for their participation and a total of 150 participants (61% female) took part in the study (Mage = 34.62 years old, SDage = 11.70). The protocol was approved by the Psychology and Social Work Ethics Committee (Ref: 507) at the University of Central Lancashire, UK.
Design
A between-participants design was employed, with three levels of the independent variable: 4 conventional houses + 1 environmentally certified “green” house (small category condition); 40 conventional houses +10 environmentally certified “green” houses (medium category condition); and 400 conventional houses +100 environmentally certified “green” houses (large category condition). Across all three of the resulting conditions the ratio between the conventional and environmentally certified houses was held constant (1:4), whereas the category size of environmentally certified houses increased. Consistent with Study 1, the dependent variable was CO2 emissions estimates.
Materials and procedure
Data were collected by means of a web-based questionnaire created using Qualtrics that was distributed to respondents residing in the UK via the Prolific Academic crowdsourcing platform. Participants were informed that they were to take part in a study regarding decision-making in relation to environmental impact. The first part of the questionnaire explained the term “carbon footprint” and clarified that a higher carbon footprint has a greater negative impact on the environment compared to a lower carbon footprint. In the next part of the questionnaire, participants were presented with a figure of 4 (small condition), 40 (medium condition) or 400 (large condition) conventional houses, depending on the experimental group. In the small category condition, the participants were informed that, “The buildings below represent 4 houses in a community”. Then they received the following information:
Imagine that one environmentally certified house has been built in the same community so that community now consists of 4 conventional houses and 1 environmentally certified house. Environmentally certified houses have low environmental impact and are designed and built using materials and technology that reduces their carbon footprint and lowers their energy requirements.
Results
As can be seen in , the estimates of change in CO2 emissions were all below zero in each condition, indicating that participants responded that CO2 emissions would decrease when the environmentally certified houses were added to the conventional houses. The trend in suggests that the negative footprint illusion increased in magnitude as a function of the number of “green” items in the overall item set. A linear contrast analysis custom hypothesis test did indeed reveal a significant linear term, indicating that about 7% of variability was accounted for by a linear effect across the three conditions, F(1, 147) = 11.13, p = .001, ηp2 = .07. The fit as a function of the number of “green” additions was R2 = 84%.
Figure 3. Mean CO2 emission estimates when 1 “green” building is added to 4 conventional buildings (the small category condition), when 10 “green” buildings are added to 40 conventional buildings (the medium category condition), and when 100 “green” buildings are added to 400 conventional buildings (the large category condition). Error bars represent standard error of the means.
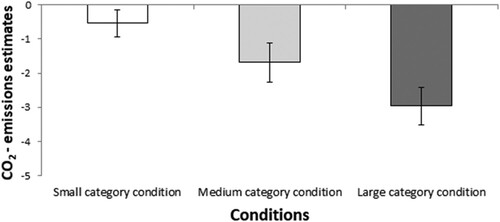
A univariate analysis of variance confirmed a significant difference in estimates of change in CO2 emissions across the three conditions, F(2, 147) = 5.57, p = .005, ηp2 = .07, BF10 = 7.15 (representing moderate evidence for H1). Post-hoc testing using Tukey HSD revealed that there was only one significant difference across conditions, which was the difference between the small category condition and the large category condition, p = .003, Cohen’s dz = 0.48, BF10 =49.46 (representing very strong evidence for H1). Furthermore, one sample t-tests revealed that the large category condition differed significantly from zero, t(49) = 5.36, p < .001, Cohen’s d = 0.76, BF10 = 7696.96 (representing extreme evidence for H1), as did the medium category condition, t(49) = 2.92, p = .005, Cohen’s dz = 0.41, BF10 = 6.60 (representing moderate evidence for H1), whereas the small category condition did not differ significantly from zero, t(49) = 1.38, p = .175, Cohen’s dz = 0.19, BF10 = 0.37 (representing anecdotal evidence for H0).
Discussion
Study 3 revealed a negative footprint illusion across two of three addition conditions; participants indicated that the CO2 emission estimates decreased in the large and medium category conditions. In contrast, a zero footprint illusion was identified in the small category condition. A zero footprint illusion occurs when the participants judge that the addition of “green” items does not have any material effect on the CO2 emissions (in either a positive or a negative direction) and has been reported in previous research (see e.g. Holmgren et al., Citation2021 and Threadgold et al., Citation2021). Critically, the findings indicate a category-size bias: CO2 emission estimates increased with the category set size of the “green” items, despite the ratio of “green” items to conventional items being held constant across the three conditions. This finding is at odds with the averaging account, according to which the estimates of CO2 emissions should be comparable (since the ratio of “green” to conventional items is identical, the average per item would be the same regardless of the number of “green” items added). However, it is clear that the magnitude of the negative footprint illusion is impacted by the number of both conventional houses and “green” house additions, with only the large and medium conditions revealing a negative footprint illusion, suggesting the presence of a category-size bias.
General discussion
The three studies reported in this paper demonstrate a negative footprint illusion, where the addition of “green” houses to a set of conventional houses led people to believe that the carbon footprint of the entire set decreased rather than increased, across all conditions except for the small conditions in Study 2 and Study 3, in which a zero footprint illusion was revealed. In a “zero footprint illusion” the addition of “green” items does not have any material effect on the carbon emissions estimations (i.e. as either increasing or decreasing). These studies replicated the existence of a negative footprint illusion with houses as carbon-producing items (Holmgren et al., Citation2021). Furthermore, we demonstrate that the magnitude of the negative footprint illusion is indeed sensitive to the number of “green” houses added to a set of conventional houses. Critically, the negative footprint illusion increases with the number of “green” houses that are added to a set of conventional houses, both when the number of conventional houses is held constant (Studies 1 and 2) and when the ratio between the number of conventional houses and “green” houses is held constant (Study 3). Research has previously reported that people are insensitive to the number of “green” items added, because participants were observed to judge one “green” item as having the same environmental impact as two of the same “green” items (Kim & Schuldt, Citation2018). Of course, in this particular instance, such a finding of quantity insensitivity coheres with the averaging account, as on average two “green” items would yield the same carbon footprint as one green item.
Previous research has advocated for an averaging bias as the mechanism underpinning the negative footprint illusion (i.e. people base their environmental impact estimates not on the total sum of the impact of all objects in a set but their average impact; Holmgren, Andersson, et al., Citation2018; Holmgren et al., Citation2019, Citation2021), but direct evidence for this account has only been reported once in the past (Holmgren, Andersson, et al., Citation2018). Here, we report further direct evidence for this account (Studies 1 and 2). However, Study 3, in which the ratio (1:4) between the number of conventional houses and the number of “green” houses was kept consistent, yet the number of conventional houses, and the number of “green” houses was varied, suggests a role for the number of “green” items in a set. Thus, Study 3 provides a clear indication that, in the absence of any differences in the magnitude of the illusion attributable to the presence of an averaging bias, there does indeed appear to be a role for a category-size bias in attenuating the magnitude of the negative footprint illusion. Critically, in Study 3, if the magnitude of the illusion were to be solely impacted by an averaging bias with no impact on the number of “green” additions, one would expect comparable carbon estimations across each of the conditions. It appears from the studies reported here that numerosity, as reflected in category size, does matter in the context of the negative footprint illusion and there are also some possible explanations for why numerosity might influence the averaging process.
The original category-size bias in probability judgments has been difficult to replicate (Perfecto et al., Citation2018). Apparently, replication difficulties of the category-size bias reported by Isaac and Brough (Citation2014) occurred in part because of participants misunderstanding whether a question was being asked concerning the odds of a specific member of a category rather than any member within that category and/or other artifacts in methodological design (Perfecto et al., Citation2018). In our opinion, it is unlikely that the apparent category-size bias we report in Study 3 is attributable to confusion or design artifacts. The questions asked of participants could not produce confusion about whether participants were to estimate the likelihood of a constituent event occurring (e.g. the probability with which the vowel A will occur when rolling a 26-sided die on which every letter of the alphabet is represented) and not an estimate of the size of the category of events (the probability of rolling any vowel). On the contrary, the question asked, in our opinion, clearly related to an estimate of the environmental impact of the “green” and conventional buildings combined.
Furthermore, the category-size bias found by Isaac and Brough (Citation2014) in the context of probability estimates is clearly different from the category-size bias we report here. Three important differences come to mind. First, the type of estimate in the current study differed from that required in Isaac and Brough (Citation2014). Our study required CO2 emissions estimates whereas Isaac and Brough’s (Citation2014) judgments focused on the subjective likelihood of events occurring when those events were part of a parent category. Second, the way that category size and saliency were manipulated in the current study was through the addition of different quantities of items, whereas in Isaac and Brough’s (Citation2014) study, category size and saliency were manipulated via the properties of a parent category (e.g. that vowels are a smaller category than consonants). Finally, in the current study, our category-size manipulation involved a combination of vices (conventional buildings that are energy inefficient) and virtues (“green” buildings that are energy efficient) within a single set. Therefore, unlike the manipulations of Isaac and Brough (Citation2014), judgments in our study could be affected by the addition of items that are deemed to be morally good and healthy for the environment to a set of items that are morally bad and unhealthy for the environment. Taken together, there are reasons to believe that the category-size bias reported in the current paper is different from the category-size bias reported by Isaac and Brough (Citation2014) and is arguably unrelated to the concerns raised by Perfecto et al. (Citation2018).
It is worth noting that the category size in terms of the number of items in Study 3 is confounded with the category size in terms of its visual space. The category-size bias found in Study 3 could therefore be related to an effect of stimulus distribution. In a study by Sörqvist et al. (Citation2022), it was shown that an irregular stimulus distribution of the to-be-estimated items (i.e. the “green” and conventional items were presented randomly across the visual display) led to an increase in the magnitude of the negative footprint illusion, in comparison with when the categorically related items were regularly distributed (e.g. blocked). Taken together with the results of Study 3, one interpretation of the effect of category size is that the magnitude of the negative footprint illusion depends on the perceived size of the category, in terms of the size of the space covered by the categorically related items. This could potentially be an important insight with practical implications. Future research should aim to further investigate the negative footprint illusion in more real-life settings.
In previous research (Holmgren, Kabanshi, et al., Citation2018; MacCutcheon et al., Citation2020; Threadgold et al., Citation2022), several individual differences have been explored in relation to the magnitude of the negative footprint effect. MacCutcheon et al. (Citation2020) report a relationship between participants’ degree of compensatory thinking (e.g. “Recycling compensates for driving a car”) and their susceptibility to the negative footprint illusion. However, this association did not replicate in a study by Threadgold et al. (Citation2022). In their study, environmental-specific reasoning dispositions (e.g. compensatory green beliefs and environmental concern) were unrelated to the negative footprint illusion, whilst general analytic reasoning dispositions were associated with the negative footprint illusion. Specifically, disposition to engage in Type 2 actively open-minded thinking (particularly dogmatism and fact resistance) was associated with a significant reduction in susceptibility to the negative footprint illusion. Type 2 thinking is slower, analytic and reflective in nature, in comparison to Type 1 thinking, which is more rapid, automatic and intuitive (Evans & Stanovich, Citation2013a, Citation2013b; see also De Neys, Citation2006). Thus, engaging in Type 2 thinking may enable a participant to overcome the averaging bias underpinning the negative footprint illusion, facilitating the production of a summative response over an averaging one. Preliminary analysis of our previous results (and newly collected data) fails to provide any evidence that socio-demographic factors such as age, gender, education level or income influence vulnerability to the negative footprint illusion. Further, in unpublished work, mathematical aptitude (as measured with the Berlin Numeracy Test), was unrelated to the magnitude of the negative footprint illusion, as was domain-specific expertise in energy systems (Holmgren, Kabanshi, et al., Citation2018). This suggests that the negative footprint illusion is very robust and difficult to modulate. However, it is not impenetrable, as Holmgren et al. (Citation2021) showed that priming a summation concept can be used adaptively to correct the bias underpinning the illusion.
In conclusion, it is possible that the averaging bias and the category-size bias both engender a negative footprint illusion. Although the findings reported here suggest that a category-size bias influences judgments of environmental impact, it is currently unclear whether two biases are operating together (e.g. an averaging bias, Holmgren, Andersson, et al., Citation2018, and a category size bias, Isaac & Brough, Citation2014) or whether a single bias (i.e. category size or averaging bias), explains the negative footprint illusion. The averaging bias is a common explanation offered in various parts of the decision-making literature (e.g. Anderson, Citation1965; Kralik et al., Citation2012; Weaver et al., Citation2012; Weaver et al., Citation2016), including in the health domain (Chernev & Gal, Citation2010), different economic domains (Hartwig et al., Citation2022; Kunz et al., Citation2017) and audits (Lambert & Peytcheva, Citation2019). Further research is therefore needed to disentangle the respective contributions from the averaging bias and the category-size bias to the negative footprint illusion (cf. Bonner & Newell, Citation2008).
Disclosure statement
No potential conflict of interest was reported by the author(s).
References
- Anderson, N. H. (1965). Averaging versus adding as a stimulus-combination rule in impression formation. Journal of Experimental Psychology, 70(4), 394. https://doi.org/10.1037/h0022280
- Bonner, C., & Newell, B. R. (2008). How to make a risk seem riskier: The ratio bias versus construal level theory. Judgment and Decision Making, 3(5), 411–416. https://doi.org/10.1017/S1930297500000437
- Chen, X. (2011). Why do people misunderstand climate change? Heuristics, mental models and ontological assumptions. Climatic Change, 108(1–2), 31–46. https://doi.org/10.1007/s10584-010-0013-5
- Chernev, A., & Gal, D. (2010). Categorization effects in value judgments: Averaging bias in evaluating combinations of vices and virtues. Journal of Marketing Research, 47(4), 738–747. https://doi.org/10.1509/jmkr.47.4.738
- Chyung, S. Y., Roberts, K., Swanson, I., & Hankinson, A. (2017). Evidence-based survey design: The use of a midpoint on the Likert scale. Performance Improvement, 56(10), 15–23. https://doi.org/10.1002/pfi.21727
- Cohen J. (1988). Statistical Power Analysis for the Behavioral Sciences. Routledge Academic.
- De Neys, W. D. (2006). Dual processing in reasoning: two systems but one reasoner. Psychological Science, 17, 428–433. https://doi.org/10.1111/j.1467-9280.2006.01723.x
- Engler, J. O., Abso, J., & von Wehrden, H. (2019). Navigating cognition biases in the search of sustainability. Ambio, 48(6), 605–618. https://doi.org/10.1007/s13280-018-1100-5
- Evans, J. S. B. T., & Stanovich, K. E. (2013a). Dual-process theories of higher cognition: advancing the debate. Perspectives in Psychological Sciences, 8, 223–241. https://doi.org/10.1177/1745691612460685
- Evans, J. S. B. T., & Stanovich, K. E. (2013b). Theory and metatheory in the study of dual processing: reply to comments. Perspectives in Psychological Science, 8, 263–271. https://doi.org/10.1177/1745691613483774
- Faul, F., Erdfelder, E., Lang, A.-G., & Buchner, A. (2007). G*Power 3: A flexible statistical power analysis program for the social, behavioral, and biomedical sciences. Behavior Research Methods, 39(2), 175–191. https://doi.org/10.3758/BF03193146
- Gifford, R. (2011). The dragons of inaction: Psychological barriers that limit climate change mitigation and adaptation. American Psychologist, 66(4), 290–302. https://doi.org/10.1037/a0023566
- Gorissen, K., & Weijters, B. (2016). The negative footprint illusion: Perceptual bias in sustainable food consumption. Journal of Environmental Psychology, 45, 50–65. https://doi.org/10.1016/j.jenvp.2015.11.009
- Hartwig, F., Landström, M., & Sörqvist, P. (2022). Averaging bias in firm acquisition processes. Journal of Behavioral and Experimental Economics, 96, 101809, 1–8. https://doi.org/10.1016/j.socec.2021.101809
- Holmgren, M., Andersson, H., Ball, L. J., & Marsh, J. E. (2021). Can the negative footprint illusion be eliminated by summative priming? Journal of Cognitive Psychology, 33(3), 337–356. https://doi.org/10.1080/20445911.2021.1903012
- Holmgren, M., Andersson, H., & Sörqvist, P. (2018). Averaging bias in environmental impact estimates: Evidence from the negative footprint illusion. Journal of Environmental Psychology, 55, 48–52. https://doi.org/10.1016/j.jenvp.2017.12.005
- Holmgren, M., Kabanshi, A., Langeborg, L., Barthel, S., Colding, J., Eriksson, O., & Sörqvist, P. (2019). Deceptive sustainability: Cognitive bias in people’s judgment of the benefits of CO2 emission cuts. Journal of Environmental Psychology, 64, 48–55. https://doi.org/10.1016/j.jenvp.2019.05.005
- Holmgren, M., Kabanshi, A., Marsh, J. E., & Sörqvist, P. (2018). When A+B A: Cognitive bias in experts’ judgment of environmental impact. Frontiers in Psychology, 9, 823, 1–6. https://doi.org/10.3389/fpsyg.2018.00823
- Intergovernmental Panel on Climate Change. (2021). The physical science basis.
- Isaac, M. S., & Brough, A. R. (2014). Judging a part by the size of its whole: The category size bias in probability judgments. Journal of Consumer Research, 41(2), 310–325. https://doi.org/10.1086/676126
- Jeffreys, H. (1961). Theory of probability. (3rd ed.). Oxford University Press, Clarendon Press.
- Kim, B., & Schuldt, J. P. (2018). Judging the environmental impact of green consumption: Evidence of quantity insensitivity. Journal of Environmental Psychology, 60, 122–127. https://doi.org/10.1016/j.jenvp.2018.10.005
- Kralik, J. D., Xu, E. R., Knight, E. J., Khan, S. A., & Levine, W. J. (2012). When less is more: Evolutionary origins of the affect heuristic. PLoS One, 7(10), e46240. https://doi.org/10.1371/journal.pone.0046240
- Kunz, A. H., Messner, C., & Wallmeier, M. (2017). Investors’ risk perceptions of structured financial products with worst-of payout characteristics. Journal of Behavioral and Experimental Finance, 15, 66–73. https://doi.org/10.1016/j.jbef.2017.07.005
- Kusch, S., & Fiebelkorn, F. (2019). Environmental impact judgments of meat, vegetarian, and insect burgers: Unifying the negative footprint illusion and quantity insensitivity. Food Quality and Preference, 103731, 1–10. https://doi.org/10.1016/j.foodqual.2019.04.003
- Lambert, T. A., & Peytcheva, M. (2019). When is the averaging effect present in auditor judgments? Contemporary Accounting Research, 37(1), 277–296. https://doi.org/10.1111/1911-3846.12512
- Lee, M. D., & Wagenmakers, E. J. (2014). Bayesian cognitive modeling: A practical course. Cambridge university press.
- MacCutcheon, D., Holmgren, M., & Haga, A. (2020). Assuming the best: Individual differences in compensatory “green” beliefs predict susceptibility to the negative footprint illusion. Sustainability, 12(8), 3414, 1–10. https://doi.org/10.3390/su12083414
- Newell, B. R., Kary, A., Moore, C., & Gonzalez, C. (2016). Managing the budget: Stock-flow reasoning and the CO2 accumulation problem. Topics in Cognitive Science, 8(1), 138–159. https://doi.org/10.1111/tops.12176
- Perfecto, H., Nelson, L. D., & Moore, D. A. (2018). The category size bias: A mere misunderstanding. Judgment and Decision Making, 13(2), 170–184. https://doi.org/10.1017/S1930297500007087
- Rouder, J.N., Speckman, P.L., Sun, D., Morey, R. D. & Iverson, G. (2009). Bayesian t tests for accepting and rejecting the null hypothesis. Psychonomic Bulletin & Review, 16, 225–237. https://doi.org/10.3758/PBR.16.2.225
- Sörqvist, P., & Holmgren, M. (2022). The negative footprint illusion in environmental impact estimates: Methodological considerations. Frontiers in Psychology, 13, 990056, 1–6.
- Sörqvist, P., & Langeborg, L. (2019). Why people harm the environment although they try to treat it well: An evolutionary-cognitive perspective on climate compensation. Frontiers in Psychology, 10, 348, 1–5. https://doi.org/10.3389/fpsyg.2019.00348
- Sörqvist, P., Volna, I., Zhao, J., & Marsh, J. E. (2022). Irregular stimulus distribution increases the negative footprint illusion. Scandinavian Journal of Psychology, 63(5), 530–535. https://doi.org/10.1111/sjop.12829
- Sterman, J. D., & Sweeney, L. B. (2007). Understanding public complacency about climate change: Adults’ mental models of climate change violate conservation of matter. Climatic Change, 80(3-4), 213–238. https://doi.org/10.1007/s10584-006-9107-5
- Sterner, E. O., Adawi, T., Persson, U. M., & Lundqvist, U. (2019). Knowing how and knowing when: Unpacking public understanding of atmospheric CO2 accumulation. Climatic Change, 154(1-2), 49–67. https://doi.org/10.1007/s10584-019-02423-8
- Threadgold, E., Marsh, J. E., Holmgren, M., Andersson, H., Nelson, M., & Ball, L. J. (2021). Biased estimates of environmental impact in the negative footprint illusion: The nature of individual variation. Frontiers in Psychology, 12, 648328, 1–16.
- Threadgold, E., Marsh, J. E., Holmgren, M., Andersson, H., Nelson, M., & Ball, L. J. (2022). Biased estimates of environmental impact in the negative footprint illusion: The nature of individual variation. Frontier in Psychology, 12, 648328. https://doi.org/10.3389/fpsyg.2021.648328
- Weaver, K., Garcia, S. M., & Schwarz, N. (2012). The presenter’s paradox. Journal of Consumer Research, 39(3), 445–460. https://doi.org/10.1086/664497
- Weaver, K., Hock, S. J., & Garcia, S. M. (2016). “Top 10” reasons: When adding persuasive arguments reduces persuasion. Marketing Letters, 27(1), 27–38. https://doi.org/10.1007/s11002-014-9286-1
- Weijters, B., Geuens, M., & Baumgartner, H. (2013). The effect of familiarity with the response category labels on item response to Likert scales. Journal of Consumer Research, 40(2), 368–381. https://doi.org/10.1086/670394
- Wyatt, R. C., & Meyers, L. S. (1987). Psychometric properties of four 5-point Likert type response scales. Educational and Psychological Measurement, 47(1), 27–35. https://doi.org/10.1177/0013164487471