
Abstract
The motivation of the present study is to contribute to the knowledge of partial submerged propellers (PSPs) in the search for a reliable performance prediction method with regard to the ventilation flow around PSPs using a hybrid grid-based Reynolds-averaged Navier–Stokes (RANS) solver. To achieve accurate results and obtain the correct behaviour extraction of the ventilation zone, a fine mesh was generated around the propeller and the free surface. The hydrodynamic coefficients of the PSP, the ventilation pattern and other results were calculated for a range of advance coefficients. The predicted ventilated open-water performance of the PSPs as well as the ventilation shape are in good agreement with the experimental measurements and observations. Finally, discrepancies between the numerical results and the experimental data are quantitatively evaluated in terms of the relative percentage error for the PSP characteristics.
1. Introduction
A partial submerged propeller (PSP) is a propeller that works in two phases of air and water. Each blade enters into and exits from the water during rotation. It is practically observed that when one third of the diameter of a blade is immersed, it has the best operating performance. It is often recognised as one of the most efficient propulsive devices for high-speed vessels. Its efficiency is primarily attributed to the reduction of appendage drag because most of the propeller assembly is elevated above the water (Young & Kinnas Citation2004). An additional advantage of using a PSP is that it eliminates cavitation by replacing it with ventilation; the cyclic blade entry from the air into the water opens a ventilated cavity around the propeller which almost completely prevents the occurrence of vapour cavitation (Kamen Citation1995; The Propulsion Committee Citation2002). A drawback of using PSPs is that a complete performance prediction method is still under development for them, and even though PSPs are largely used in the boat-racing community, PSP design is often performed on a trial-and-error basis. Ventilation occurs when air is drawn onto the body surface. The ventilated surface can be modelled like a cavity surface but with a different prescribed pressure. Moreover, the same method can be used to determine the flow detachment locations, as well as the extent and thickness of the ventilated surfaces.
The first known study attempting to study PSPs experimentally was conducted by Shiba (Citation1953). In this study, a 2D section of the surface propeller with different profiles and the various parameters affecting the ventilation phenomenon were investigated. Between 1970 and 1990, several experiments were conducted on ventilation parameters and their effects on the average loss of thrust and efficiency (Wang Citation1977; Rose & Kruppa Citation1991; Kruppa Citation1992; Rose et al. Citation1993; Olofsson Citation1996).
One of the numerical studies related to this topic was the prediction of the flow around a surface-piercing hydrofoil using a time marching boundary element method that was carried out by Savineau and Kinnas (Savineau & Kinnas Citation1995; Savineau Citation1996). In this research, the non-linear cavity geometry was determined iteratively by applying the kinematic boundary condition to the exact cavity surface at each time step. According to the obtained results, the developed two-dimensional method is very efficient at predicting the cavity geometry and pressure distributions during the entry phase and thus can be used as a basis for designing PSP blades.
Caponnetto (Citation2002) compared the results of his numerical simulations of PSPs with the experimental data of Olofsson (Citation1996) and obtained good agreement in terms of the blade forces during a rotation cycle. Young and Kinnas (Citation2003) extended a 3D boundary element method which was previously developed for the prediction of unsteady sheet cavitation on conventional fully-submerged propellers to predict the performance of super-cavitating and PSPs. The cavitating flow around a propeller was studied using an unstructured grid-based Reynolds-averaged Navier–Stokes (RANS) method by Rhee et al. (Citation2005). Koushan (Citation2004) presented his research on the total dynamic loadings of ventilated propellers and showed that the fluctuations during one ventilation cycle can range from 0 to 100% of the average force of a non-ventilated propeller. Ghassemi (Citation2009) used a practical numerical method to predict the hydrodynamic characteristics of PSPs. The critical advance velocity ratio was derived using the Weber number and pitch ratio in the transition mode, then the potential based boundary element method was used on the engaged surfaces.
Following Koushan's (Citation2004) research, numerical simulation was performed for different types of propeller ventilation by Califano and Steen (Citation2009).This research aimed at analysing the ventilation mechanism. Commercial RANS code was used to solve the viscous, incompressible, two-phase flow. In terms of both thrust forces and air content, the present analysis shows a satisfactory agreement with the filtered experimental data during the first half-revolution. Classification of different types of propeller ventilation and ventilation inception mechanisms based on the analysis of a series of experiments were investigated by Kozlowska et al. (Citation2009). Three different types of ventilation inception mechanisms were observed based on experimental results. Vinayan and Kinnas (Citation2008, Citation2009) solved the flow field around a ventilated two-dimensional surface-piercing hydrofoil and propellers using a robust nonlinear boundary element method. The results are presented for the fully wetted and ventilated cases with and without the effects of gravity, simulating the effect of changes in the Froude number. The control of propeller cavitation under operational conditions was carried out by Vrijdag et al. (Citation2010). A series of four-bladed propellers of the surface-piercing type was developed to design a PSP for a given operating condition by Misra et al. (Citation2012). According to their results, the best performance at all immersions is obtained from using a propeller with wedge-shaped sections with the trailing edge inclined at 60 deg to the horizontal axis. Only a propeller series with four blades has been developed in this work.
The main objective of the present study is analysing the behaviour of the flow around a PSP using computational fluid dynamics (ANSYS Fluent v.14.5) based on a RANS method and comparing the obtained results with experimental data. The analysis of the propeller was carried out in unsteady open water conditions under the free surface condition. All calculations were carried out at zero shaft yaw and inclination angle. The amounts of force/moment components of the key blade in a revolution of the PSP calculated were then compared with experimental data. Finally, the results of the pressure coefficients and the ventilation pattern on the propeller and key blade are discussed.
2. PSP-841B propeller
In this paper, the numerical simulation of a PSP-841B propeller model was investigated, as test data for this was already available. All calculations were carried out at an immersion ratio I = 0.33 with zero shaft yaw and inclination angle. The immersion ratio (I = h/D) is defined as the ratio of the blade tip immersion h and the propeller diameter D (). The values of KT and KQ are affected by the immersion ratio, since the thrust T and torque Q depend on how much of the propeller blade is in the water during each revolution, and this depends upon the immersion of the propeller. The propeller geometry and its modelling are shown in , along with teta (θ) in various positions of the key blade. The geometrical characteristics of the propeller are given in .
Figure 1. A PSP-841B propeller and definitions of the yaw angle Ψ, immersion ratio I = h/D, shaft inclination angle γ and PSP rate of revolution.
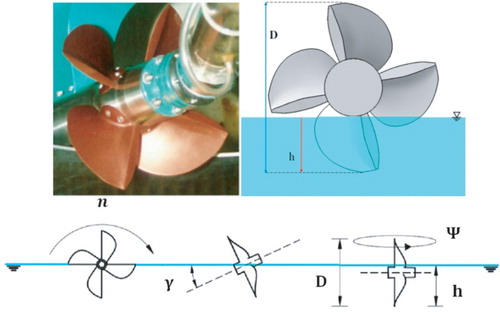
Figure 2. (a) The geometry of the PSP-841B (model and actual), and (b) values of teta (θ) for the various positions of the key blade.
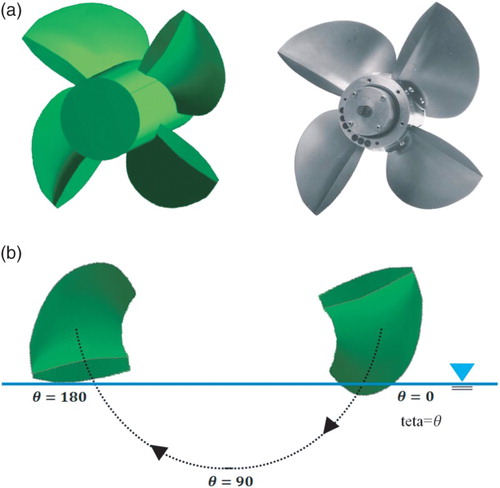
Table 1. Details of the PSP-841B propeller model.
3. Description of the grid generation
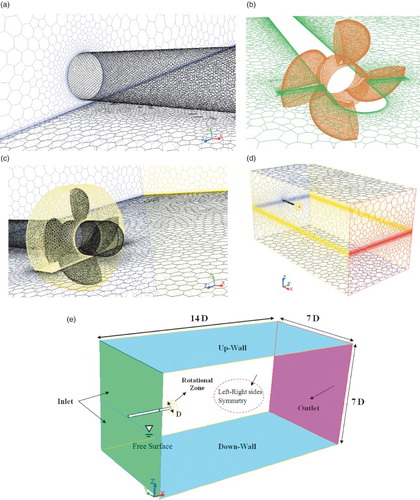
While in most cases the performance calculations of submerged propellers can be carried out assuming steady conditions, the flow on a PSP is always unsteady, meaning that computation must be solved over a period of time, following the flow during several complete rotations of the screw. In our approach, the domain mesh is composed of two zones (cylinder and rectangular). A fixed external rectangular zone simulates the contours of the cavitation tunnel; a slip condition is imposed on its lateral surface, while the inlet and outlet condition are imposed on the fore and aft surfaces, respectively. A smaller zone (cylinder) containing the propeller is set inside the external zone. At each time step the internal zone is rotated by a small degree, and the propeller with it. The computational variables are interpolated at the sliding interface of the common surfaces of the internal and external zones. The axis of rotation of the internal zone can be oriented arbitrarily to represent the exact propeller shaft inclination. The geometry of the propeller has been developed using in-house code. The mesh inside each zone is produced by the combination of structured and non-structured meshes. To increase the accuracy of calculations, boundary layer mesh is generated on the surfaces of the propeller, hub, boss and shaft. The mesh generation around the PSP-841B propeller and the computational domain are shown in . In the present study, the total number of meshes is about 3.8 M and the mesh is generated using ANSYS Fluent.
Figure 3. The mesh generation around the PSP-841B propeller and computational domain for (a) the shaft and upstream, (b) the boundary layer on the cross-section of the propeller, (c) the structured mesh on the free surface, and (d) the outline of the domain, and (e) the computational domain and boundary conditions.
4. Hydrodynamic characteristics
If the pressure in the ventilated cavities is assumed to be atmospheric and the phenomenon of cavitation is fully neglected at this point, a dimensional analysis of governing fluid dynamic equations, originally performed by Shiba (Citation1953), reveals five non-dimensional parameters of significance for ventilated propeller flows (). By studying the behaviour of the PSP, it was found that the advance coefficient and the immersion ratio together effectively divide the flow encountered by a propeller into three major flow regimes as follows:
Table 2. Non-dimensional parameters of significance for ventilated propeller flows.
• Non-ventilated regime. No ventilation occurs on the propeller or in its trailing wake. This regime only occurs at very low velocities or deep immersion when the propeller is fully submerged (immersion ratio equal to or greater than unity).
• Partially ventilated regime. Part of the trailing wake shows streaks or sheets of ventilated cavities, while the propeller may either be fully wetted or partly covered with cavities that vent to the atmosphere. If the advance coefficient is reduced from a high value and the propeller is partially submerged (with an immersion ratio less than unity), a transition occurs below a certain value, and a comparatively stable flow is changed into an unstable flow where cavities fluctuate in shape and size. Similarly, if the propeller is fully submerged at first, working non-ventilated in the low advance coefficient range, a transition occurs and the flow becomes unstable and partially ventilated as the immersion is reduced.
• Fully ventilated regime. A single ventilated cavity occurs on each blade of the propeller starting close to the leading edge on the suction side and at the trailing edge of the pressure side, thus forming a sheet cavity which extends into the helical wake of the propeller. The flow is normally quite stable in this regime, covering low advance coefficients and partially submerged immersion ratios.
To each flow regime corresponds a characteristic hydrodynamic load exerted on the propeller by the fluid. As an example, the principal characteristics of a propeller in the usual non-dimensional form, i.e., the thrust and torque coefficients, are defined as follows:
(1)
(2)
(3)
where KT and KQ are the thrust and torque coefficients, respectively, T and Q are the propeller thrust and torque, respectively, and Eta is the efficiency.
According to Shiba (Citation1953), the effect on the characteristics of the Weber number (Wn), which is closely related to surface tension, vanish when . Below this critical value Wn effectively determines the transition advance coefficient, i.e., the advance coefficient at which the flow becomes fully ventilated. The transition advance coefficient approaches asymptotically a certain fixed-value characteristic of the propeller as Wn increases. In this paper, in all cases, Wn > 180.
5. Numerical method
5.1. Description of the method
The flow is modelled as a two-phase flow computing both air and water flow simultaneously. The conservation equations for mass and momentum are solved in integral form using a finite volume method by ANSYS Fluent. The integrals are approximated using the midpoint rule. The simple algorithm couples pressures and velocities. The RANS method is modelled using the standard k–ε turbulence model. Time is discretised using an implicit Euler scheme. At the inlet, the velocity components and the turbulent energy and its dissipation rate are prescribed. At the outlet, the zero gradients in the longitudinal direction are enforced. On the propeller surface, the no-slip condition is enforced using a wall function. The interface between water and air is determined in a surface-capturing method. We define a scalar function between 0 and 1 which describes the percentage of the volume of water in each cell, where 1 represents cells that are completely filled with water and 0 represents cells that are completely filled with air. This scalar function allows us to model the two phases in our flow as one effective fluid with locally-weighted material properties. It should be noted that both the inlet and outlet boundary conditions are considered as pressure-inlet and pressure-outlet, respectively. The computational domain and all boundary conditions are shown in .
5.2. Governing equations
The equation for the conservation of mass, or the continuity equation, can be written as follows:
(4)
Equation (1) is the general form of the mass conservation equation, where the source is the mass added to the continuous phase from the dispersed second phase and any user-defined sources.
The conservation of momentum in an inertial reference frame is described by
(5) where
is the static pressure,
is the stress tensor, and
and
are the gravitational body force and external body forces, respectively.
also contains other model-dependent source terms such as porous media and user-defined sources.
The standard model is based on model transport equations for the turbulence kinetic energy (
) and its dissipation rate (
). The model transport equation for
is derived from the exact equation, while the model transport equation for
was obtained using physical reasoning and bears little resemblance to its mathematically exact counterpart. In the derivation of the
model, the assumption is that the flow is fully turbulent and the effects of molecular viscosity are negligible. The standard
model is therefore only valid for fully turbulent flows. The turbulence kinetic energy,
, and its rate of dissipation,
, are obtained from the following transport equations (Launder & Spalding Citation1972):
(6) where
represents the generation of turbulence kinetic energy due to the mean velocity gradients (calculated as described in the modelling turbulent production in the
models),
is the generation of turbulence kinetic energy due to buoyancy (calculated as described in the effects of buoyancy on turbulence in the
models),
represents the contribution of the fluctuating dilatation in compressible turbulence to the overall dissipation rate (calculated as described in the effects of compressibility on turbulence in the
models),
and
are constants,
and
are the turbulent Prandtl numbers for
and
, respectively, and
and
are user-defined source terms.
The volume of fraction (VOF) model can model two or more immiscible fluids by solving a single set of momentum equations and tracking the volume fraction of each of the fluids throughout the domain. The tracking of the interface between the phases is accomplished by the solution of a continuity equation for the volume fraction of one (or more) of the phases. For the phase, this equation has the following form:
(7) where
is the mass transfer from the q phase to the p phase and
is the mass transfer from the p phase to the q phase, and
is zero. The momentum equation is solved with a second-order upwind scheme. A no-slip condition is set on the PSP, hub, boss and shaft.
6. Results and discussion
The commercial RANS code has been used to solve the viscous, incompressible, two-phase (air and water) flow. The undisturbed free-surface elevation is assigned both at the inlet and outlet boundaries. In order to validate the treatment of PSPs, the numerical predictions for the PSP-841B propeller model were compared with the experimental measurements collected by Olofsson (Citation1996). A photograph of the partially submerged propeller ventilation and the corresponding RANS model were compared. All numerical results in this study were evaluated on the condition that those distributions after several rotations were stable compared with those of the previous and next rotations. For the comparison of the numerical results with Olofsson's experimental measurements, the flow conditions in each advance coefficient were set as shown in . To study the behaviour of the flow around the PSP, the numerical analysis is done in the lower and higher advance coefficients than the design point of the PSP.
Table 3. Flow conditions for various advance coefficients.
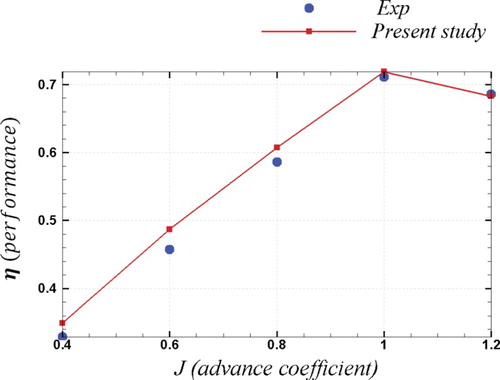
The average of the distributions of the force and moment coefficients during one cycle, KT and 10 KQ were calculated. According to Figures and , the simulation results show very good agreement with the experimental measurements. Because the maximum efficiency is usually related to the design point of the propeller, for the high advance coefficients the maximum coincidence was obtained, as can be seen in the comparison between the numerical and experimental results. In the low advance coefficients, less than 1, a greater difference can be seen that relates to the operation of the PSP in the heavy condition.
Figure 4. Comparison between the calculated and measured KT, 10KQ.
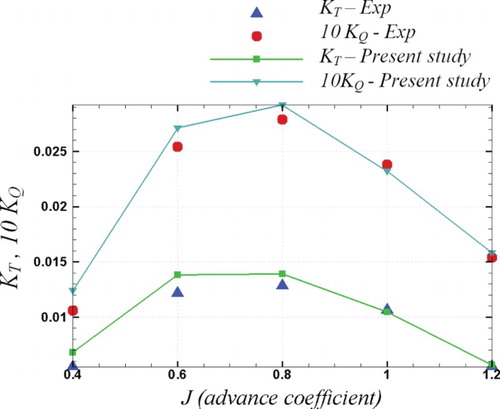
Figure 5. Comparison between the calculated and measured ηO.
shows the percentage error of the obtained numerical results compared with the experimental data. According to the figure, the results of the numerical simulations agreed well with the experimental measurements for the high advance coefficients and the maximum error is less than 2.5%. There is an increase in the error rate for the low advance coefficients because of the propeller working in the heavy condition. The error rate is derived according to the following equation:
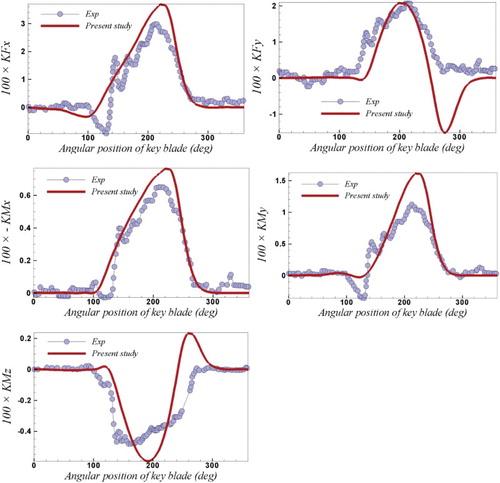
(8) The comparison between the simulated and measured propeller open characteristics are shown hereafter. Similarly, comparisons of the five-component force/moment coefficients at low and high values of J are shown in Figures –. Experimental data correspond to the flow conditions used for the RANS simulations shown in . In Figures – the fluctuations of three components of the forces/moments of the key blade of the propeller are compared with the experimental results. As can be seen, both the numerical and experimental curves are similar. However, in some cases, the numerical results are much larger than the experimental data, an error which is due to the weakness of the RANS method in modelling and analysing the ventilation around the PSP. In the other words, due to the instability in the transition region, in particular for the low advance coefficients, the numerical modelling of the flow does not have the ability to show the fluctuations of cross-flow, ventilation, etc. The force/moment coefficients started to be generated at larger angular position than occurs in the experiments, meaning that the interface transformation level was low and that the blades enter later and exit earlier than in the experiments.
Figure 6. Relative percentage error versus advance coefficients.
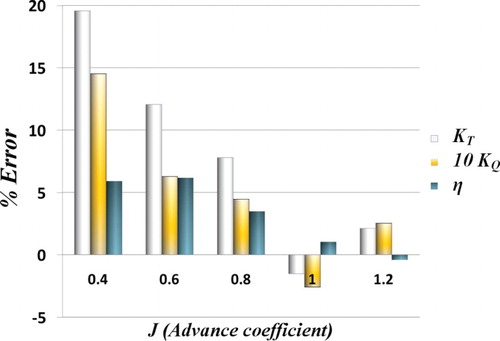
Figure 7. Comparison between the calculated and measured rotational fluctuation of the five-component force/moment versus the angular position of the key blade.
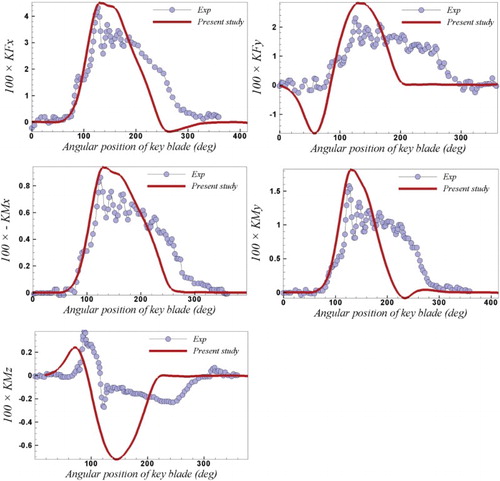
Figure 8. Comparison between the calculated and measured rotational fluctuation of the five-component force/moment versus the angular position of the key blade.
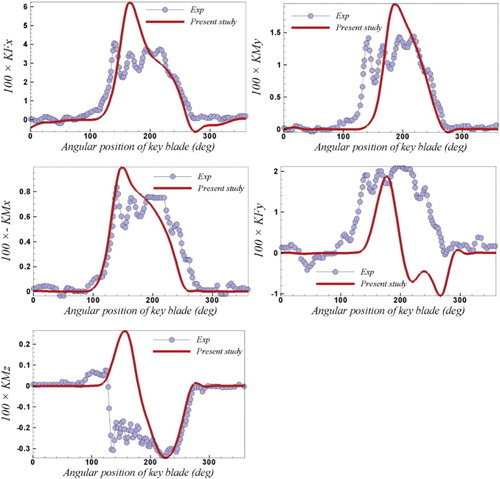
Figure 9. Comparison between the calculated and measured rotational fluctuation of the five-component force/moment versus the angular position of the key blade.
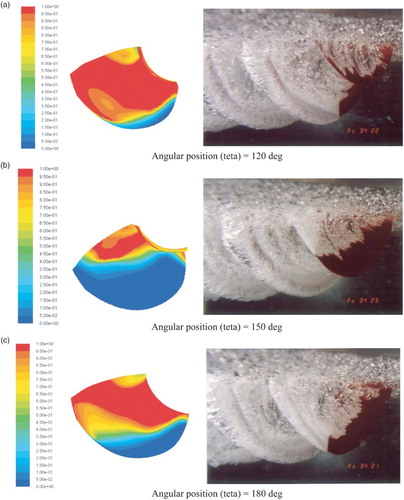
In the ventilation area on the back side of key the blade of the PSP during rotation is shown in three different positions. These results are for J = 1.2 and, as can be seen, there is fairly good conformity between the experimental photographs and the numerical contours. This adaptation is reduced for the low advance coefficients due to the operation of the propeller in heavy and unstable conditions.
Figure 10. Comparison of the observed and simulated ventilation patterns.
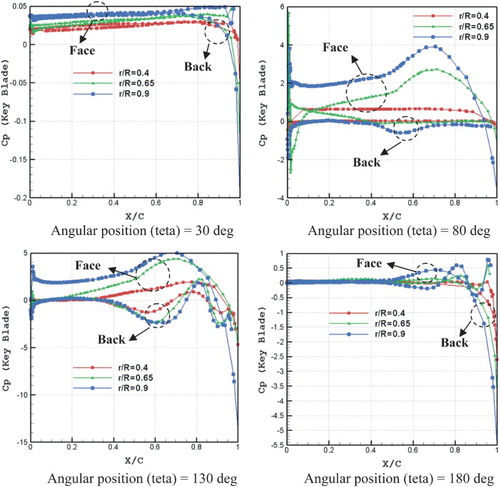
In , the contour of the total pressure on the back and face sides of the propeller are shown in several different positions during rotation. In the diagram of the pressure coefficient on the two-dimensional cross-section of the key blade are shown for various r/R and at different positions of propeller rotation. The effect of increasing the pressure difference between the back and front face of the blade may be observed when the blade is more immersed in the water.
Figure 11. Contour of the total pressure on the face and back side of the PSP.
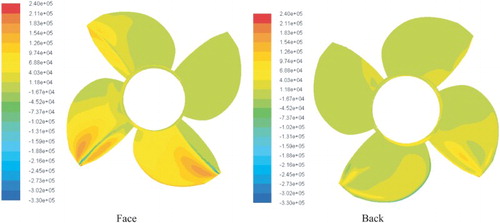
Figure 12. Contour of the total pressure on the face and back side of the PSP.
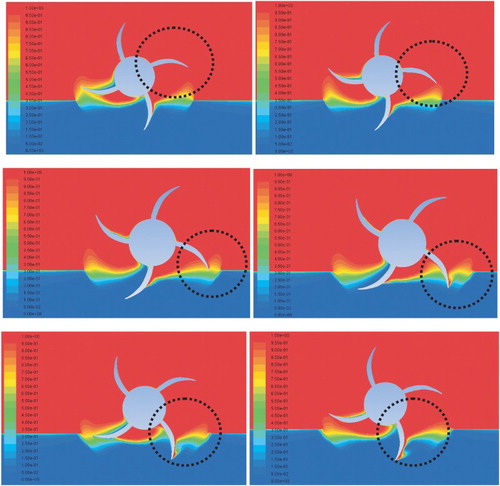
In , the formation of the aeration from the moment of arrival until the blade departs from the water is shown. According to figure the behaviour of the ventilation zone is completely non-linear. These results are for an advance coefficient of 0.8. The formation and development of the ventilation zone have a significant impact on the results.
Figure 13. Contour of the ventilation pattern (VOF) on the cross-section of the PSP at different positions of propeller rotation.
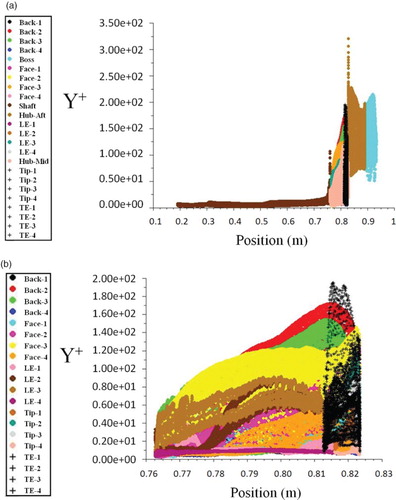
To validate the numerical results, a graph of Y+ on the propeller is plotted in . As can be seen, the average value is less than 90.
Figure 14. Graph of Y+ on (a) the shaft and propeller, and (b) the propeller.
7. Conclusions
The intent of this work was to use numerical simulation to study the physical phenomena relevant to PSP design for given operating conditions. RANS simulation using a VOF method was employed. A validation and verification analysis of the propeller in open water was carried out for a range of advance ratios. The air drawing of the PSP-841B was simulated and the obtained results were compared with the results of the experiments conducted by Olofsson (Citation1996). The present analysis shows a satisfactory agreement with the experimental data during the one revolution, both in terms of forces/moments and ventilation. Based on the numerical obtained results, the following conclusions are drawn:
The numerical results both in terms of forces/ moments and ventilation have very good agreement with the experimental data at a higher advance velocity ratio. Also, the ventilation patterns created by the RANS simulations are in good agreement with the experimental data. This adaptation is reduced for low advance coefficients.
The formation and development of the ventilation zone have a significant impact on the results, so using the RANS method at high advance coefficients results in good correctness, but for low advance coefficients better commentary are recommended.
According to the obtained results, the trailing edge and the cup of the blade have a significant impact on the increase of static pressure on the face side. Also, the cup of the blade prevents water from spraying into the air, but this was not investigated in this study.
Disclosure statement
No potential conflict of interest was reported by the authors.
ORCID
Hassan Ghassemi http://orcid.org/0000-0002-6201-346X
References
- Califano A, Steen S. 2009. Analysis of different propeller ventilation mechanisms by means of RANS simulations. First International Symposium on Marine Propulsors, SMP'09, Trondheim, Norway, June.
- Caponnetto M. 2002. RANSE simulations of surface piercing propellers. Rolla Research.
- Ghassemi H. 2009. Hydrodynamic characteristics of the surface-piercing propellers for the planing craft. J Mar Sci Appl. December 2009. 8(4):267–274. doi: 10.1007/s11804-009-8076-2
- Kamen P. 1995. Surface-piercing propellers. Boat builder Magazine. 1–8.
- Koushan K. 2004. Environmental and interaction effects on propulsion systems used in dynamic positioning, an overview. Proceedings of 9th International Symposium on Practical Design of Ships and other Floating Structures PRADS 2004, Lübeck-Travemünde, Germany.
- Kozlowska AM, Wöckner K, Steen S, Rung T, Koushan K, Spence S. 2009. Numerical and experimental study of propeller ventilation. First International Symposium on Marine Propulsors. SMP'09, Trondheim, Norway, June.
- Kruppa CFL. 1992. Testing surface piercing propellers. In Hydrodynamics: Computations, Model Tests, and Reality. 107–113.
- Launder BE, Spalding DB. 1972. Lectures in mathematical models of turbulence. London, England: Academic Press.
- Misra SC, Gokarn RP, Sha OP, Suryanarayana C, Suresh RV. 2012. Development of a four-bladed surface piercing propeller series. Nav Eng J. 124–4:105–138.
- Olofsson N. 1996. Force and flow characteristics of a partially submerged propeller. PhD thesis. Goteborg, Sweden: Department of Naval Architecture and Ocean Engineering, Chalmers University of Technology.
- Rhee SH, Kawamura T, Li H. 2005. Propeller cavitation study using an unstructured grid based navier-stoker solver. J. Fluids Eng. 127(5):986–994. doi: 10.1115/1.1989370
- Rose JC, Kruppa CFL. 1991. Surface piercing propellers – methodical series model test results. In FAST'91, Norway.
- Rose JC, Kruppa CFL, Koushan K. 1993. Surface piercing propellers – propeller/hull interaction. In FAST'93. 867–881, Japan.
- Savineau C, Kinnas SA. 1995. A Numerical formulation applicable to surface piercing hydrofoils and propellers. In 24th American Towing Tank Conference, Texas A&M University, College Station, TX.
- Savineau CM. 1996. A time marching boundary element method for the prediction of the flow around surface piercing hydrofoils. Master's thesis. Department of Ocean Engineering, Massachusetts Institute of Technology, February.
- Shiba H. 1953. Air-drawing of marine propellers. Technical Report 9, Transportation Technical Research Institute.
- The Propulsion Committee. 2002. Proceedings of the 23rd ITTC. 23th International Towing Tank Conference. I:90–142.
- Vinayan V, Kinnas SA. 2008. Numerical modeling of surface piercing hydrofoils and propellers. In Proceedings of the 27th Symposium on Naval Hydrodynamics.
- Vinayan V, Kinnas SA. 2009. A boundary element method for the strongly nonlinear analysis of surface-piercing hydrofoils. Proceedings of the 7th International Symposium on Cavitation. CAV2009 – Paper No. 97. August 17–22, Ann Arbor, Michigan, USA.
- Vrijdag A, Stapersma D, Terwisga T. 2010. Control of propeller cavitation in operational conditions. J Mar Eng Tech. 9(1):15–26.
- Wang D. 1977. Water entry and exit of a fully ventilated foil. J Ship Res. 21:44–68.
- Young YL, Kinnas SA. 2003. Analysis of supercavitating and surface-piercing propeller flows via BEM. Comput Mech. 32:269–280 _ Springer-Verlag. doi: 10.1007/s00466-003-0484-6
- Young YL, Kinnas SA. 2004. Performance prediction of surface-piercing propellers. J Ship Res. 28:288–304.