
ABSTRACT
Because of the extreme climate and environmental changes, container hub-ports in East Asia focus on port vulnerability rather than competitiveness. To sustain their competitive advantage, port operators adopt appropriate operational strategies based on various factors. We found that the strategies which container carriers adopt at hub ports have the most significant influence on hub-port vulnerability. The primary strategies include route diversity, sufficient cargo sources and transshipment containers, stable collaboration and incentives in the form of subsidies and rewards. These strategies demonstrate the dependence of container carriers on ports, and implementing such measures could reduce port vulnerability. Compared with the neighbouring Hong Kong and Xiamen ports, Kaohsiung Port is the most vulnerable and Hong Kong the least. Regarding all operating conditions that can be offered to carriers, Hong Kong Port possesses a competitive advantage that combats vulnerability.
1. Introduction
East Asia is the junction where the trunk routes of Far East/Europe (F/E) and the Trans-Pacific (T/P) intersect. Since the end of the twentieth century, rapid economic growth and flourishing trade have resulted in global shipping container carriers to create denser route networks that include ports in South Korea, China and southeast Asian countries. Supported by shipping policies that have been adopted by various governments, major container ports have been building more terminals to satisfy an increasing number of carriers, larger ships and denser route networks, thereby demonstrating port competitiveness and shipping advantages.
However, the era when hub ports emphasized port competitiveness has ended because of the current surplus of container terminals in major East Asian ports (MOTC Citation2013; Tai et al. Citation2013). Ports, including those in China, compete with major neighbouring ports for cargo sources and routes (TIPC Citation2012). Moreover, the interaction between the climate and environmental changes has gradually enhanced the magnitude, duration and threat of natural disasters. Therefore, the evaluation of port vulnerabilities and implementation of appropriate strategies is crucial for sustaining port competitiveness (Tai et al. Citation2013; Hsieh et al. Citation2014).
Container ports provide terminal handling capacity; however, shipping container carriers consider various factors when selecting ports, including cargo sources, terminal operating conditions, port-development strategies, subsidiary incentives and national shipping policies. For example, regarding cargo sources, carriers consider cargo-source sufficiency as crucial because sufficient import/export and transshipment cargo sources in the economic hinterlands of various ports inherently guarantee sufficient shipping demand (Zohil & Prijon Citation1999; Zeng & Yang Citation2002; Tai & Hwang Citation2007; Hwang & Tai Citation2008). However, the fierce competition among major East Asian ports and the derived insufficient cargo sources have caused overall revenue to decline. Consequently, the operational vulnerabilities and their influential factors must be identified in order to prevent a decline in route density and throughput.
The container volume growth in Hong Kong, Kaohsiung and Xiamen – the three neighbouring container ports competing to be a regional/local hub in East Asia – exhibit a trend of stagnation. These ports encounter competition from ports in the Pearl River Delta and Fujian Province. We analysed these three ports, which are located in different regions (i.e. the Hong Kong Special Administrative Region of China, Taiwan and southern China), to explore factors that influence the operation of well-developed container hub-ports and assess and compare their overall vulnerability.
2. Port competition and stagnation
Figure shows the deployment of trunk routes in East Asia. Between 1980 and the early twenty-first century, Hong Kong served as a gateway for trading with mainland China. However, in 2000, the significance of Hong Kong to the Chinese economy and trade began to decline due to the construction of Chinese ports reaching a saturation level following investment by foreign holding companies and container carrier companies. In addition, Hong Kong is situated next to southern China, which is the largest cargo source worldwide; therefore, deep-water ports such as Shenzhen and Guangzhou ports neighbouring the Pearl River Delta compete directly with Hong Kong. However, Hong Kong terminals and facilities are governed by four international container terminal and holding companies – Hong Kong International Terminals, Modern Terminals Limited, Dubai Port World and China Ocean Shipping (Group) Company – which are competing within well-developed and stable mechanisms. Thus, the container throughput of Hong Kong Port has been ranked top three worldwide. Nevertheless, container growth in Hong Kong has been slowing since 2009.
Figure 1. The deployment of trunk routes in East Asia in 2011.
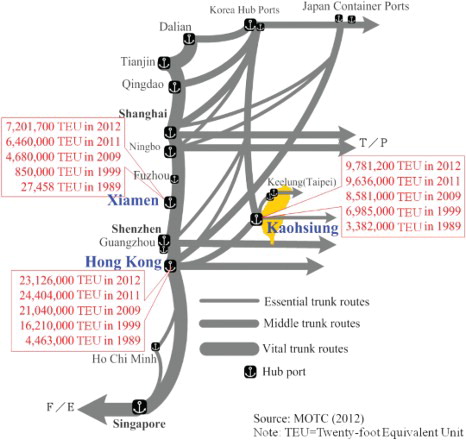
As the largest container port in Taiwan, Kaohsiung Port is a vital transshipment hub between Southeast Asia and the United States (US). However, this has changed since the beginning of the twenty-first century; before 2008, ships travelling across the Taiwan Strait were required to sail indirectly through ports in Hong Kong, South Korea and Japan – thus, Taiwanese ports did not significantly benefit from increased trade and cargo sources in China (Hwang & Tai Citation2008). Since 2008, it has become possible to travel directly across the strait, although access is limited to Chinese and Taiwanese carriers and ships with Chinese (including Hong Kong) or Taiwanese registry, and foreign carriers have no access to transshipment containers from China. Because of diminishing cargo sources from Taiwanese ports and a lack of subsidiary incentives, large international container carriers have reduced their callings at Taiwanese ports. For example, Kaohsiung Port has become a less popular port in F/E trunk routes recently (MOTC Citation2012, Citation2013). Similar to the conditions in Hong Kong, the container volume at Kaohsiung Port has exhibited no significant increase since 2008. Furthermore, Taiwanese ports, which have played the role of both port authority and operator in past decades, have lower operational efficiency and less response resilience to market impacts. In March 2012, the Taiwanese government restructured the management systems at various ports to form a public enterprise called the Taiwan International Port Corporation (TIPC), ending the era of Kaohsiung Port as the last large state-owned container port in East Asia.
Xiamen Port, as the largest container hub-port in Fujian Province, China, does not directly compete with Kaohsiung Port regarding trunk routes and cargo sources; rather, the major competition to Xiamen Port is other adjacent ports in the province, such as Fuzhou, Chin Chew and Zhangzhou ports, which have direct and significant encroaching effects on the cargo sources and routes of Xiamen Port. Consequently, although Xiamen Port has numerous deep-water terminals when compared with Kaohsiung Port, its container volume growth does not exceed that of Kaohsiung.
In the past decade, the three container regional/local hub candidate ports (i.e. Hong Kong, Kaohsiung and Xiamen) have had distinct and independent cargo source markets in their own regions. The conditions that container carriers consider when selecting (among these three ports) East Asian ports for route deployment are cargo-source types, terminal operation models, port fee structures and route categories. Because of their varying development statuses, the ports are only slightly interchangeable during route consideration. However, these ports have all encountered significant stagnation in container volume growth; therefore, they can be used to assess container hub-port vulnerability.
3. Literature review of port vulnerability and resilience
Previous studies related to hub ports have focused primarily on competitiveness, container volume growth and port efficiency. However, with surpluses in container terminals and diverse operating models in major container ports (Farrell Citation2012), the vulnerability of adjacent ports in East Asia has been receiving increasing attention. Ducruet et al. (Citation2010) conducted a network analysis of the inter-port traffic flow between 1996 and 2006 to describe the centrality and vulnerability of ports at various hierarchical levels. The results showed that local port policies and the evolution of shipping network design were crucial for hub ports. Laxe et al. (Citation2012) employed similar research methods and used the evolution of container traffic between 2008 and 2010 to investigate the hierarchy and vulnerability of various ports.
Port competitiveness represents the ability to provide sufficient operational functionality of ports based on user needs (Yuen et al. Citation2012), comprising various constructs such as physical vulnerability (e.g. infrastructure, shipping network and port capacities), economic vulnerability (e.g. productivity and business growth) and resilience (e.g. redundant resources and employments). This is consistent with vulnerability which makes a system susceptible to the damaging influence of a hazard as defined by UNISDR (Citation2009). The improvements of port vulnerability assist port operators in resisting, coping with and recovering from negative impacts caused by hazards (Hsieh Citation2014). Port vulnerability thus consists not only of efficiency in terms of competitiveness but also the resilience of the port in terms of its capacity to resist, cope with and recover from extreme events. Although the factors are similar to those related to port competition, the strategies are proposed based on the operational continuity management.
Differing to the approach through which the vulnerability of target objects during disasters and environmental changes is measured, port resilience is also considered when investigating port vulnerability. Mansouri et al. (Citation2009, Citation2010) analysed strategies that affect port resilience by focusing on the uncertainties of port infrastructure systems. These uncertainties were divided into four categories: natural disasters and organizational, technological and human factors. Subsequently, the study was conducted in three phases (i.e. assessing vulnerabilities, devising resilience strategies and evaluating investment strategies) to examine the cost-effectiveness of various strategies obtained by using decision-tree analysis. Vulnerability is defined as the properties of a transportation system that may weaken or limit its ability to endure, handle and survive threats and disruptive events that originate both within and outside the system boundaries (Berle et al. Citation2011).
By focusing on the commercial operations of container ports, crucial recent literature regarding factors affecting container port vulnerability and resilience was reviewed. Accordingly, port vulnerability in this study refers to the systems of ports that may limit their ability to provide sufficient operational functionality based on resistant coping capacities and their resilience in recovering from negative impacts caused by hazards. The vital indices, attributes and factors of port vulnerability are divided into three categories: (a) policies and governance of port authorities, (b) development and construction of port infrastructures and (c) carrier demands regarding port operating environments (Table ). Seven scholars and shipping company managers familiar with shipping management in ports across the Taiwan Strait were invited to subjectively rate questionnaire items based on the significance of each factor. Factors that were selected by all seven scholars were ranked as 1 and factors with lower selection frequencies received lower rankings. Items that were selected four or more times are presented in Table . Subsequently, the study questionnaire was designed based on actual operating conditions in Hong Kong, Kaohsiung and Xiamen ports.
Table 1. Indicators, attributes and factors of port vulnerability.
Table 2. Primary factors for measuring vulnerability for container hub-ports.
Container ports in various regions are generally governed by different port governance policies and the implementation methods and effects of these policies directly affect port vulnerability. These measures comprise extensive content (Table ), including port monitoring and control (Wooldridge et al. Citation1999; Tamvakis & Xenidis Citation2012), security (Barnes & Oloruntoba Citation2005), port policies (Ducruet et al. Citation2010; MOTC Citation2013), privatization and reorganization (Mansouri et al. Citation2010; MOTC Citation2013), and policy implementation and restrictions (MOTC Citation2012, Citation2013). These factor indices are related exclusively to internal port regulations; however, shipping and port policies must possess external connectivity to attract route deployments and cargo sources, which have frequently been neglected. For example, regional trade and facilitation agreements signed by the governments of various countries (UNCTAD Citation2011, Citation2012) offer external connectivity, which can reduce port vulnerability. Such agreements are also vital for increasing route density and cargo source diversity. To address the stagnating growth that container hub-ports are experiencing, governments should specifically redefine port functionality and introduce industry privatization measures (MOTC Citation2013). Furthermore, during local port and shipping-policy implementation, deregulation and the vitality of the shipping-policy implementation (Tai et al. Citation2013) could effectively sustain port industry prosperity and reduce vulnerability.
The infrastructure and construction necessary for port development are essential conditions for attracting container ships and route deployment, and thus directly affect port vulnerability (Hsieh et al. Citation2014). In particular, sufficient deep-water terminal facilities in various hub ports, specifically large hub-ports, are prerequisites for fulfilling the calling needs of various ships (Mansouri et al. Citation2010; Zhang et al. Citation2011; MOTC Citation2012; Tamvakis & Xenidis Citation2012). In addition to the significant items presented in Table , port authorities should conduct efficient container terminal planning (TIPC Citation2012), enhance the internal connectivity of ports and renovate terminal facilities based on the above-mentioned prerequisites (Hwang & Tai Citation2008; Hsieh et al. Citation2014). Overall, these conditions are crucial factors that influence transshipment functioning and port vulnerability.
Carrier demands regarding port operating environments are essential in terms of strategies for port selection. Superior strategy implementation implies lower port vulnerability. The items presented in Table are the primary mechanisms and functions that ports offer to users. These factors are viewed as crucial in carrier strategy implementation. For example, factors including diverse route concentrations (Tai Citation2012), sufficient and stable local cargo sources (Hwang & Tai Citation2008) and the possibility of attracting sufficient transshipment containers (MOTC Citation2013) should be prioritized because they are vital for enhancing port resilience. In addition, stable collaboration between carriers and terminal operators (Haugstetter & Cahoon Citation2010) and appropriate subsidy and incentive provisions for carriers (TIPC Citation2012; Tai et al. Citation2013) can effectively prevent the reduction in port vulnerability.
4. Methodology and survey
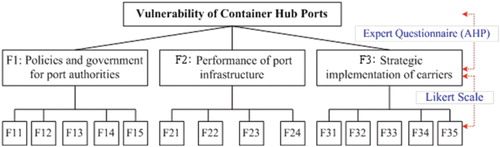
Based on the factors presented in Table , a three-level hierarchical research framework was developed (Figure ). Level 1 is the primary objective, indicating that the goal of this study is to assess container hub-port vulnerability; Level 2 consists of three indicators: F1, F2 and F3; and Level 3 presents 14 attributes under each of the three indicators in the preceding level. Concurrently, the analytic hierarchy process (AHP) was applied using a questionnaire to investigate the relationship between Levels 1 and 2; a 5-point Likert scale was used in the questionnaire to analyse the relationship between Levels 2 and 3.
Figure 2. An assessment model developed using AHP and Likert scales.
This questionnaire was sent via email between December 2012 and February 2013 to participants who consisted of directors and managers working at container shipping companies that manage businesses across the Taiwan Strait, all of whom have more than 10 years of experience with container terminal operations in the container shipping industry. Therefore, because the participants possessed extensive practical experience, the replies supplied by the participants have sufficient reliability. A total of nineteen valid questionnaires were returned: five from Orient Overseas Container Line Limited (OOCL), three from Evergreen Marine Corporation, four from Yang Ming Line, three from Maersk Line Shipping Containers Worldwide, two from Wan Hai Lines Taiwan and two from major international shipping agents.
This study involved operational issues that require professional knowledge of shipping and ports; therefore, a large-scale questionnaire survey could not be conducted, nor could the number of recovered questionnaires be increased. Thus, we conducted an expert survey method, which permits fewer samples. In Section 4.1, AHP is employed to obtain the weights of the three indicators (F1, F2 and F3). In Section 4.2, the entropy method is applied to obtain the weights of the three indicators by reverse-calculating with the means of the 14 attributes; the results are then used to investigate whether the two methods yield similar ranking results. In Section 4.3, the grey relational analysis (GRA) method is used to calculate the intensities of the three indicators (F1, F2, and F3) for the three container hub-ports (Hong Kong, Kaohsiung and Xiamen). Finally, in Section 4.4 the results are summarized and discussed to assess the vulnerability of the three hub-ports.
4.1. Analytic hierarchy process (AHP) survey and results
AHP is a multi-criteria decision-making (MCDM) method (Saaty Citation1980) that has been extensively applied to solve problems related to port competition and shipment issues (Lirn et al. Citation2003; Hwang & Tai Citation2008; Notteboom Citation2011; Yang et al. Citation2014). Therefore, we used AHP to assess hub-port vulnerability. As a decision-making method, AHP involves three steps: (a) defining the hierarchical problem, (b) obtaining the weights of various levels and (c) sorting priorities (Saaty & Vargas Citation1994; Lirn et al. Citation2003; Chen Citation2006; Subramanian & Ramanathan Citation2012; Yang et al. Citation2014).
First, we developed a three-level hierarchical framework (Figure ). Second, we compared the judgement values of the items and obtained weights for the items in Level 2. This step consisted of three parts: (a) using AHP questionnaires to obtain a pairwise comparison matrix for Level 2, (b) calculating the relative weights of all indicators at this level and (c) calculating the consistency ratio (a ratio less than 0.1 indicates that the judgement possesses consistency). The consistency ratio = 0.000157018 (Table ), which indicates that the study results are consistent. In the final step, indicator priories were sorted. Expert Choice 11.5 for Windows was employed to obtain the statistics shown in Table , which shows the pairwise-comparison judgement matrix and the relative indicator weights. Among the indicators, carrier strategy implementation (F3) has the most significant influence on hub-port vulnerability (0.386 weight), followed by policies and governance of port authorities (F1; 0.357 weight) and performance of infrastructure (F2; 0.257 weight). Because this information was derived from the opinions of container carrier and terminal operators, it indicates that the performance of container port infrastructure is no longer significant to container carrier operators. Instead, these carrier operators pay more attention to local port policies and the implementation of various operating strategies, such as cargo-source volume, subsidiary incentives and the vitality of the shipping-policy implementation.
Table 3. Pairwise comparison judgement matrix and relative weights regarding the goal.
4.2. Entropy method and survey results
The entropy method effectively measures information quantity averages, and a higher entropy value indicates less information-expression quantity (Zeleny Citation1982; Tai Citation2006). In addition to the AHP method, this study used the entropy method and the means of the sub-criteria (F11–F35) obtained according to the Likert scale in the questionnaire. Subsequently, the main criteria weights (F1–F3) were obtained, which provide improved precision regarding actual decision-making conditions and describe the explanatory power and reliability of the sub-criteria. The main steps are as follows (Tai Citation2006):
The first step is to assign the questionnaire scores of measurement xmn, m=1,2, … ,k, n=1,2, … ,t, and then normalize the message xmn into Dmn to be the superiority rating of the mth indicators (F1–F3) under the nth attributes. Then 0≦Dmn≦1 for
(1)
and
(2)
Then define the probability of each attribute:
(3)
The second step is to get the entropy measurement Em of the mth indicators as contrast intensity:
(4)
Then the weight λm of the mth indicator evaluation on criterion can be calculated by
(5)
Analysis of the 19 valid questionnaires obtained in this study yielded mean attributes (F11–F35) of the three hub-ports (Table ). Table presents the steps for calculating the weights of entropy values for indicators F1 to F3. The relative weights of the indicators differ from those presented in Table , although the rankings are identical. Therefore, this study concluded that carrier strategy implementation (F3) is the most significant indicator affecting port vulnerability (0.4875 weight), followed by the policies and governance of port authorities (F1; 0.3201 weight) and the infrastructure performance (F2; 0.1924 weight). In other words, the operating strategies that container carriers adopt at major hub-ports is the most significant indicator for port vulnerability.
Table 4. The mean measurements for each attribute among the three ports.
Table 5. The entropy weights of indicators regarding hub-port vulnerability.
4.3. Grey relational analysis (GRA) and evaluated scores
GRA describes the relationships between one main factor and all other factors in a given system (Feng & Chiou Citation2004; Tai Citation2006; Kung & Wen Citation2007). A GRA space is a binary set denoted by (X,Γ), where X represents a collection composed of xi sequences to be compared and reference to sequence x0 and Γ represents a map set termed the grey relational map set and includes γ as the appointed relational map in the space. Assume that γ(x0(t), xi(t)) represents an image at point t from a series to a real number on map γ, and γ(x0, xi) represents an image at all points where t = 1,2, … ,N, x0 = (x0(1), … ,x0(N)), and xi = (xi(1), … , xi(N)). In this study, i = Kaohsiung, Xiamen and Hong Kong, t = the means of all attributes (F11–F35) among different hub ports i, and x0 = the maximum means of all attributes.
If γ(x0, xi) satisfies , then γ(x0(t), xi(t)) is the grey relational coefficient at point t and γ(x0, xi) represents the grey relational grade if Γ satisfies the axioms including the norm interval, duality symmetric, wholeness and approachability (Liang Citation1999; Kao & Hocheng Citation2003; Singh et al. Citation2004), so that
(6)
where
is the distinguished coefficient. A smaller coefficient leads to a larger distinguished ability, ρ = 0.5 generally.
We can obtain the GRA grade value for each indicator regarding Kaohsiung, Xiamen and Hong Kong from Appendix 1 and the input data of step 1 from those listed in Table . The GRA scores of the hub-port indicators are presented in Table .
Table 6. The GRA scores of indicators regarding Kaohsiung, Xiamen and Hong Kong ports.
4.4. Evaluation of port vulnerability
Tables and present the evaluations of hub-port vulnerability through Equations (7) and (8) below; for example (Tai Citation2006; Hwang & Tai Citation2008), the evaluation score for Ki=Kaohsiung is 0.5610 = (0.357 × 0.5710 + 0.257 × 0.4704+ 0.386 × 0.6122), and the vulnerability score (V = 0.5272) with the highest rank among the three hub-ports is shown in Table .
Table 7. Evaluations of vulnerability among the three hub-ports (AHP method).
Table 8. Evaluations of vulnerability among the three hub-ports (entropy method).
The distinguished coefficient (the value) caused the GRA to become a non-linear system (Hwang & Tai Citation2008), indicating that the
value is smaller and the distinguished ability (the distribution of scores in Table ) is larger, but the ranks are invariable. In this study, the ranks of vulnerability are constant and identical in Tables and , although the
value can be changed for any numeral
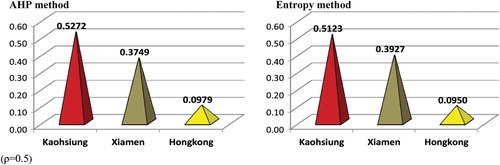
. Figure shows the ranks of vulnerability for the three hub-ports obtained by using different evaluation methods. The results indicate that the future development and competitiveness of Kaohsiung Port is a cause for concern.
Figure 3. The ranks of hub-port vulnerability obtained by different evaluation methods.
5. Conclusion and remarks
Factors including the increasing number of ports and terminals and container-carrier domination over port selection and terminal operations have caused container hub-ports in East Asia to be weakened in terms of competitiveness. Attention to port vulnerability while adopting appropriate business strategies is vital for sustaining the competitiveness of large container-ports.
The analysis in this paper, employing two assessment methods, showed that carrier-strategy implementation at hub ports is the most significant factor affecting port vulnerability. The main attributes of this factor describe carrier dependence on hub ports. Thus, hub ports must have route diversity, adequate and stable cargo sources, sufficient transshipment container sources, stable collaboration agreements and subsidiary incentives to sustain port competitiveness and concurrently reduce port vulnerability. In addition, the business models adopted by major container ports and massive infrastructure construction worldwide are no longer significant in attracting carrier callings and establishing port advantages. Instead, port development is dominated by port-user business strategies and the vitality of the incentives that ports provide to users.
The policies and governance of port authorities (F1) is the second most significant factor in influencing port vulnerability, the main attributes of which include regional trade agreements between the home countries of ports, appropriate local port policies, the vitality of shipping-policy implementation, well-defined port-function positioning and high-level liberalization in port-related industries. These aspects are critical for sustaining hub-port development.
Compared with the two neighbouring container hub-ports (i.e. Hong Kong and Xiamen), Kaohsiung Port is the most vulnerable among East Asian ports whereas Hong Kong Port is the least vulnerable. The factor rankings shown in Table indicate that Hong Kong Port has a superior performance in terms of port-policy implementation, infrastructure and carrier dependence on ports. Regarding carrier dependence on ports, the performance of Kaohsiung Port was superior to that of Xiamen Port, indicating that the rental system of dedicated container terminals for shipping carriers currently implemented in Kaohsiung is attractive to some container carriers. Carriers select Kaohsiung because it enables them to execute strategic deployment; however, Kaohsiung was inferior to Hong Kong and Xiamen in the remaining external and internal conditions.
We employed several assessment methods to develop a research model for assessing port vulnerability. These methods are applicable for studying the container ports of various countries, particularly container ports in areas experiencing stagnation in container throughputs and operational status (e.g. the east and west coasts of the US and Japan). By using the proposed methods, the relative vulnerability of various ports can be assessed. In addition, the results of this study can serve as a reference for the TIPC, the corporatized public-ownership organization, to reduce the current operational vulnerabilities in Kaohsiung Port.
Disclosure statement
No potential conflict of interest was reported by the authors.
References
- Augusto Felício J. 2013. The influence of the characterisation factors of the European ports on operational performance: conceptual model testing. Int J Shipp Transp Logist. 5:282–302. doi: 10.1504/IJSTL.2013.054191
- Barnes P, Oloruntoba R. 2005. Assurance of security in maritime supply chains: conceptual issues of vulnerability and crisis management. J Int Manag. 11:519–540. doi: 10.1016/j.intman.2005.09.008
- Berle Ø, Asbjørnslet BE, Rice JB. 2011. Formal vulnerability assessment of a maritime transportation system. Reliab Eng Syst Saf. 96:696–705. doi: 10.1016/j.ress.2010.12.011
- Chen CF. 2006. Applying the analytical hierarchy process (AHP) approach to convention site selection. J Travel Res. 45:167–174. doi: 10.1177/0047287506291593
- Ducruet C, Lee SW, Ng AKY. 2010. Centrality and vulnerability in liner shipping networks: revisiting the Northeast Asian port hierarchy. Marit Policy Manag. 37:17–36. doi: 10.1080/03088830903461175
- Farrell S. 2012. The ownership and management structure of container terminal concessions. Marit Policy Manag. 39:7–26. doi: 10.1080/03088839.2011.642317
- Feng CM, Chiou YC. 2004. Research methods. Hsinchu Taiwan: Chian-Du Publications.
- Haugstetter H, Cahoon S. 2010. Strategic intent: guiding port authorities to their new world?. Res Transp Econ. 27:30–36. doi: 10.1016/j.retrec.2009.12.005
- Hsieh CH. 2014. Disaster risk assessment of ports based on the perspective of vulnerability. Nat Hazards. 74:851–864. doi: 10.1007/s11069-014-1214-4
- Hsieh CH, Tai HH, Lee YN. 2013. Port vulnerability assessment from the perspective of critical infrastructure interdependency. Marit Policy Manag. 41:589–606. doi: 10.1080/03088839.2013.856523
- Hwang CC, Tai HH. 2008. Analysis of relative competitiveness among major hub-ports across Taiwan Strait. J Chin Inst Transp. 20:1–38. Chinese.
- Kamble SS, Raoot AD, Khanapuri VB. 2010. Improving port efficiency: a comparative study of selected ports in India. Int J Shipp Transp Logist. 2:444–461. doi: 10.1504/IJSTL.2010.035504
- Kao PS, Hocheng H. 2003. Optimization of electrochemical polishing of stainless steel by grey relational analysis. J Mater Process Technol. 140:255–259. doi: 10.1016/S0924-0136(03)00747-7
- Kung CY, Wen KL. 2007. Applying grey relational analysis and grey decision-making to evaluate the relationship between company attributes and its financial performance—a case study of venture capital enterprises in Taiwan. Decis Support Syst. 43:842–852. doi: 10.1016/j.dss.2006.12.012
- Laxe FG, Seoane MJF, Montes CP. 2012. Maritime degree, centrality and vulnerability: port hierarchies and emerging areas in containerized transport (2008–2010). J Transp Geogr. 24:33–44. doi: 10.1016/j.jtrangeo.2012.06.005
- Liang RH. 1999. Application of grey relation analysis to hydroelectric generation scheduling. Elect Power Energy Syst. 21:357–364. doi: 10.1016/S0142-0615(98)00055-6
- Lirn TC, Thanopoulou HA, Beresford KC. 2003. Transhipment Port Selection and Decision-making Behaviour: Analysing the Taiwanese Case. Int J Logist Res Appl. 6:229–244. doi: 10.1080/13675560310001626990
- Mansouri M, Nilchiani R, Mostashari A. 2009. A risk management-based decision analysis framework for resilience in maritime infrastructure and transportation systems. In Systems Conference, 2009 3rd Annual IEEE; 2009 March 23–26; Vancouver, BC, Canada. IEEE Systems Council.
- Mansouri M, Nilchiani R, Mostashari A. 2010. A policy making framework for resilient port infrastructure systems. Mar Policy. 34:1125–1134. doi: 10.1016/j.marpol.2010.03.012
- [MOTC] Minister of Transportation and Communication (Taiwan). 2009. The impact and port strategies of container shipping development on Taiwan's Port competitiveness. Institute of Transportation (MOTC-IOT-97-H1DB003).
- [MOTC] Minister of Transportation and Communication (Taiwan). 2012. The influence of Taiwanese port operation on deployment of fleet and routes for container shipping companies after direct-sailing across Taiwan-strait. Institute of Transportation (MOTC-IOT-100-H1DB001a).
- [MOTC] Minister of Transportation and Communication (Taiwan). 2013. A study of the mode of operation of Taiwanese container ports in response to environmental changes. Institute of Transportation (MOTC-IOT-101-H1DB001a).
- Notteboom T. 2011. An application of multi-criteria analysis on the location of a container hub port in South Africa. Marit Policy & Manag. 38:51–79. doi: 10.1080/03088839.2010.533710
- Saaty TL. 1980. The analytic hierarchy process. New York: Routledge.
- Saaty TL, Vargas, LG. 1994. Decision making in economic, political, social, and technological environments with the analytic process. Pittsburgh: RWS Publications.
- Singh PN, Raghukandan K, Pai BC. 2004. Optimization by Grey relational analysis of EDM parameters on machining A1-10% Si Cp composites. J Mater Process Technol. 155-156:1658–1661. doi: 10.1016/j.jmatprotec.2004.04.322
- Subramanian N, Ramanathan R. 2012. A review of applications of Analytic Hierarchy Process in operations management. Int J Prod Econ. 138:215–241. doi: 10.1016/j.ijpe.2012.03.036
- Tai HH. 2006. Evaluation of port selection factors and competitiveness for major container carrier across Taiwan-strait [dissertation]. Taiwan: National Chiao Tung University.
- Tai HH. 2012. The influence on transshipment function of Kaohsiung port by the trunk route developments in the East Asia and cross-strait direct shipping. Transp Plan J. 41:435–463. Chinese.
- Tai HH, Hwang CC. 2007. Hub port selection factors for container carriers across Taiwan strait. Transp Plan J. 36:31–62. Chinese.
- Tai HH, Yang CC, Tseng PH. 2013. Influential indicators for measuring kaohsiung port resilience. Paper presented at International Forum on Shipping, Port and Airports; Hong Kong, China.
- [TIPC] Taiwan International Port Corporation. 2012. Feasibility study of transshipment-market expanding and operational modes for terminal #75 & #120 in Kaohsiung port. Taipei: TIPC.
- Tamvakis P, Xenidis Y. 2012. Resilience in transportation systems. Proc - Soc and Behav Sci. 48:3441–3450. doi: 10.1016/j.sbspro.2012.06.1308
- [UNCTAD] United Nations Conference on Trade and Development. 2011. Review of maritime transport. NY: United Nations publication.
- [UNCTAD] United Nations Conference on Trade and Development. 2012. Review of maritime transport. NY: United Nations publication.
- [UNISDR] United Nations International Strategy for Disaster Reduction. 2009. Terminology on disaster risk reduction [Internet]. Geneva: United Nations. Available from: http://www.unisdr.org/files/7817_UNISDRTerminologyEnglish.pdf
- Wong C, Lai KH, Teo T. 2009. Institutional pressures and mindful IT management: the case of a container terminal in China. Inf Manag. 46:434–441. doi: 10.1016/j.im.2009.08.004
- Wooldridge CF, McMullen C, Howe V. 1999. Environmental management of ports and harbours — implementation of policy through scientific monitoring. Mar Policy. 23:413–425. doi: 10.1016/S0308-597X(98)00055-4
- Yang CC, Tai HH, Chiu WH. 2014. Factors influencing container carriers’ use of coastal shipping. Marit Policy Manag. 41:192–208. doi: 10.1080/03088839.2013.818729
- Yuen CA, Zhang A, Cheung W. 2012. Port competitiveness from the users’ perspective: an analysis of major container ports in China and its neighboring countries. Res Transp Econ. 35:34–40. doi: 10.1016/j.retrec.2011.11.005
- Zeleny M. 1982. Multiple criteria decision making. Singapore: McGraw-Hill Book Company.
- Zeng Z, Yang Z. 2002. Dynamic programming of port position and scale in the hierarchized container ports network. Marit Policy Manag. 29:163–177. doi: 10.1080/03088830110113599
- Zhang W, Xi T, Zhang R. 2011. A case research on vulnerability of logistics system in the Tianjin port. IACEED 2010. Energy Proc. 5:2059–2064. doi: 10.1016/j.egypro.2011.03.355
- Zohil J, Prijon M. 1999. The MED rule: the interdependence of container throughput and transhipment volumes in the Mediterranean ports. Marit Policy Manag. 26:175–193. doi: 10.1080/030888399286998
Appendix 1
The GRA grade value for each indicator (F1, F2 and F3) among Kaohsiung, Xiamen and Hong Kong ports.