
ABSTRACT
The ability to quantify vital aquatic organisms in the 2–50 µm size range was compared between five different flow cytometers and several different microscopes. Counts of calibration beads, algal monocultures of different sizes as well as organisms in a Wadden Sea sample were compared. Flow cytometers and microscopes delivered different bead concentrations. These differences between the instruments became larger for algal monocultures and were even higher for the Wadden Sea sample. It was observed that the concentration differences were significant between flow cytometer and microscope counts, and that this difference increased with the size of the objects counted. Microscope counts were more accurate for larger (50 µm) objects because cytometers struggled with bigger particles that clogged the instruments. Contrary to microscopy, the flow cytometers were capable of accurately enumerating cultured cells in the 2–10 µm size range and cells in the lower size range of the 10–50 µm size class. Flow cytometers were also well-suited to assess low abundance samples due to their ability to process larger volumes than microscopes. The results were used to indicate which tools are suitable for ballast water monitoring: flow cytometry is a suitable technology for an indicative and real time analysis of ballast water samples whilst only microscopy would be robust enough for detailed taxonomical analyses.
Introduction
The rapid and accurate enumeration of living aquatic organisms is a difficult task for scientists and a technical problem of concern to the water treatment industry such as in shipping, where the efficacy of ballast water disinfection needs to be measured. Microscope counting has traditionally been used (Lund et al. Citation1958; Utermöhl Citation1958) but this is a tedious and slow technique. Typically, humans count at a maximum rate of one object per second, but in samples with low concentrations the counting rate is even lower due the longer time needed to find an organism. Additional problems may occur when the vitality needs to be quantified, i.e. whether an organism is living or dead: the vitality of the organisms will decrease during prolonged counting due to aberrant counting chamber conditions relative to in situ conditions (NSF-International Citation2010). Furthermore, the correct enumeration of vital organisms at low concentrations while simultaneously measuring the size of the organisms is even more challenging, as is the case in ballast water monitoring.
Ballast water of ships needs to be managed in a way that ensures a discharge of vital aquatic organisms below the ballast water performance standard of the IMO (IMO Citation2016) and the United States Coast Guard (NSF-International Citation2010). This standard applies to three groups of organisms that are differentiated by size: (a) three species of bacteria (<10 µm), (b) organisms in the size range ≥10 and <50 µm, and (c) organisms ≥50 µm in minimum dimension. In this context, minimum dimension is generally considered to be the maximum width of the shortest axis when the organism is observed with a microscope. Aquatic protists between 2 and 10 µm are not included in the performance standard. For size range (b) less than 10 vital organisms per mL are allowed on discharge, while for (c) less than 10 vital organisms per m3 are permitted. To swiftly and correctly enumerate small vital planktonic organisms at such low concentrations is a scientific and technical challenge.
The IMO- convention empowers Port State Control officers to verify compliance with the performance standard for which the IMO has agreed on two approaches: (1) a ballast water sample may be analyzed indicatively, which would result in a quick, rough estimate of the concentration of vital organisms, and (2) a ballast water sample may be analyzed in detail to provide a robust, direct measurement of the concentration of vital organisms with a higher accuracy. An indicative analysis, with a prompt result generated on-board vessels, would enable Port State Control officers to stop ballast water discharges in case of non-compliance. The IMO suggested several techniques for the indicative and in-detail ballast water sample analysis (IMO Citation2015). Flow cytometry was proposed as a method for the indicative analysis and microscopy for the detailed compliance check.
There is not one perfect method to enumerate all three organism groups addressed by the ballast water performance standard. Not only are bacteria too small to be counted accurately by brightfield microscopy, their abundance needs to be measured in terms of viability (growth) and they are therefore not included in this study. The ≥50 µm sized organisms are in a size range that allows counting by low (×40–×100) magnification dissecting microscopes but prevents their enumeration by traditional flow cytometry (Zetsche and Meysman Citation2012). An important aspect is that the sturdy multicellular zooplankton can be concentrated adequately using plankton nets and gauze to enhance organism abundance which reduces the counting error. However, the ≥10 and <50 µm size group (hereafter referred to as 10–50 µm) are usually counted at a higher (×200–400) microscope magnification (NSF-International Citation2010). Because this group consists mostly of fragile unicellular protists they are more difficult to concentrate and thus to enumerate.
Problems in counting the 10–50 µm organisms by microscope are related to several different aspects, which include the correct determination of the minimum dimension in this range and establishing their vitality. Swimming organisms are certainly alive, but because many protists are non-motile, a stain is often used to determine vitality. Such vital stains are proxies that may either indicate that a cell is alive (e.g. fluorescein diacetate (FDA), 5-chloromethylfluorescein diacetate (CMFDA)), or that it is dead (e.g. SYTOX™ Green Dead Cell Stain) (Selvin et al. Citation1988; Veldhuis et al. Citation1997; Reavie et al. Citation2010; MacIntyre et al. Citation2016). Unfortunately, stains such as FDA that result in green intracellular fluorescence in living cells may not be absolute vitality indicators. A population of exponentially growing cells may contain cells with a >10-fold range in green fluorescence, that can make a visual decision on vitality in low-intensity fluorescent cells arbitrary (Peperzak and Brussaard Citation2010, Citation2011). In addition, the vitality of the organisms may decrease during counting which constrains the amount of time available for counting a sample. This could be resolved by restricting the counting time but could prove statistically unsatisfactory because the counting error is related to the total number of enumerated organisms.
In contrast to microscopy, flow cytometry is a technique capable of rapidly counting aquatic organisms (Hofstraat et al. Citation1990; Joachimsthal et al. Citation2003; Stehouwer et al. Citation2013). The sample flows through a cuvette, driven by a sheath fluid, in which the cells are interrogated one by one by a laser beam. The intensity of the forward laser scatter is a measure of particle size and the maximum particle counting rate is in the region of 1,000 per second. Moreover, the fluorescence intensity of a vitality probe can be measured for each cell individually which leads to a less arbitrary decision on vitality. As with microscopy, flow cytometry too has its disadvantages. Flow cytometers are expensive, bulky, difficult to operate, and, above all, usually do not provide a visual check of the organisms counted. Inanimate particles with green autofluorescence may thus be mistakenly regarded as living organisms (Tang and Dobbs Citation2007). Furthermore, the minimum dimension (width) of non-spherical organisms is difficult to gauge correctly because the forward scatter size calibration is performed with spherical beads. Aquatic protists are rarely spherical (except from picoplankton and nano-flagellates) and, in addition, some of them occur as multi-cellular colonies or filaments (Hoppenrath et al. Citation2009). Each cell of a colony is not counted as a separate cell with a flow cytometer, but rather the entire colony is counted as one cell. Hence, if for example, small cells (<10 µm) grow in a colony the flow cytometer may count them as one organism >10 µm in size and thus assign it to the 10–50 µm size fraction of the ballast water performance standard.
It is clear that both microscopy and flow cytometry have their respective advantages and disadvantages for counting aquatic organisms. Both techniques have been applied separately to enumerate 10–50 µm vital organisms in disinfected ballast water (Stehouwer et al. Citation2013), yet the low allowable concentration of <10 vital organisms per mL continues to challenge both microscopy as well as flow cytometry. In this study, the more traditional technique of microscope counting is compared to flow cytometry for organisms in the size range of 10–50 µm. Furthermore, the diversity of different commercially available flow cytometer instruments is explored. Finally, in addition to 10–50 µm organisms, protists <10 µm were involved in the comparison because this group may contain potentially harmful species that are not yet covered by the present day ballast water performance standard. The overall aim of the comparison was to evaluate which of the two techniques was more advantageous in terms of accuracy and precision to count vital organisms and thus suited for indicative or more detailed ballast water compliance monitoring.
Material and methods
Instruments
Flow cytometers
Five different brands of flow cytometers were used: a Becton Dickinson Accuri™ C6 (BD Biosciences, The Netherlands), two identical Attune Acoustic Focusing Flow Cytometers (ThermoFisher Scientific, The Netherlands), a Becton Dickinson FACSCanto II System with Fluidics (BD Biosciences, The Netherlands), a CytoSense (CytoBuoy b.v., The Netherlands) and a Becton Dickinson FACSVerse™ (BD Biosciences, The Netherlands). Flow cytometer specifications and the abbreviations for scatter (forward scatter (FS), side scatter (SS)) and fluorescence (Fluorescence Blue-Green (FBG), Fluorescence Blue-Orange (FBO), Fluorescence Blue-Red (FBR)) are provided in Supplemental Table 1. Participants used their individual commercial, instrument-related software for data analysis.
Microscopes
Two standard microscope systems were used: a Zeiss Axioplan 2 and a Zeiss Axiophot microscope (Carl Zeiss B.V., The Netherlands) with brightfield and epifluorescence settings. A Zeiss Axiovert 25 inverted microscope was additionally used for the Wadden Sea sample described below. Counts were performed at 200× magnification following Reavie et al. (Citation2010), and for vitality counts FDA (Invitrogen, Carlsbad USA, F1303 in acetone, final concentration 5 µM) was used as an indicator. For cell size measurements the Zeiss microscopes used a calibrated ocular eyepiece.
As an alternative microscope technique, an ‘oLine D3HM’ digital holographic microscope (Ovizio Imaging Systems NV/SA, Brussels, Belgium) was also used. It was operated with a 20 × objective and its working principle is described in more detail in Zetsche et al. (Citation2016).
Experimental approach
The flow cytometers were tested simultaneously at the Royal Netherlands Institute for Sea Research (NIOZ, Texel, The Netherlands) on 12–14 February 2013 with samples of an increasing complexity: (1) calibration beads, (2) algal monocultures, and (3) a natural Wadden Sea plankton sample, and compared to the microscope counts (Peperzak and Gollasch Citation2014). The purpose of counting size calibration beads with the flow cytometers was to determine the precision as coefficient of variation (CV) of the bead size, which was measured by FS as well as FBG. FS is an important variable in classifying organisms according to size in flow cytometers, whilst FBG is used as a vitality marker in protists. Moreover, FBR autofluorescence is used to detect chlorophyll a-containing cells and, thus, to discriminate phytoplankton (Veldhuis and Kraay Citation2000). Each flow cytometer ran duplicate samples at two flow rates: a maximum and a minimum flow rate, hereafter referred to as high and low flow rate, respectively. The selected algal species (see below) represented the size boundaries from 2 to 10 to 50 µm.
Calibration beads
To obtain actual organism concentrations from the number of organisms counted by a flow cytometer, the flow rate, i.e. the volume of sample that is analysed in a certain amount of time, needs to be known. Flow rates of the flow cytometers were determined using TruCount™ bead suspensions prepared at a concentration of 25,099 beads/mL by adding 2 mL deionised (DI) water to TruCount™ tubes (Becton Dickinson, Franklin Lakes, USA). An independent count made by the oLine D3HM resulted in 24,901 beads/mL, i.e. within 1% of the TruCount™ bead concentration stated by the manufacturer. TruCount™ beads were measured at both the low and high flow rates of the flow cytometers, as it was expected that at high flow rates with a less stable sample flow the counting precision would decline.
Flow cytometer size calibrations were performed with green fluorescent polystyrene calibration beads of three sizes: 2, 10 and 51 µm (Fluoro-Max, Thermo-Scientific, Freemont, USA, catalogue numbers G0200, G1000 and 35–8), which were suspended in 2mL DI water. Their uniformity was <5% for the 2 µm beads, <5% for the 10 µm beads and <12% for the 51 µm beads (Fluoro-Max, Thermo-Scientific, Freemont, USA). The excitation maximum for these beads was 468 nm and the emission maximum was 508 nm. All bead solutions were stored at room temperature and prepared fresh daily. For flow cytometers unable to measure the large 51 µm beads due to aperture limitations, a substitute of 44 µm large polystyrene Dragon Green beads was used (Bangs Laboratories, Fishers, USA, catalogue code FS08F) with an excitation maximum of 480 nm and an emission maximum of 520 nm. The calibration beads were used to measure FS, FBG and bead concentrations. Exact FS values at 2, 10 and 50 µm that were needed to classify organisms into the correct 2–10 and 10–50 µm size ranges were calculated from linear regression equations of measured FS geometric means versus actual sizes.
Comparative light microscope counts of 2 µm calibration beads were made using bright field illumination in a Bürker haemocytometer at 400 × magnification and counts of 10 and 51 µm beads were made using bright field illumination in a 1 mL Sedgewick-Rafter counting chamber at 100 × magnification using the standard Zeiss microscopes. For measurements with the oLine D3HM, samples were injected into a flow cell, scanned automatically and holograms captured for subsequent manual counting. The measured optical height profiles were used to manually determine the sizes of beads.
Algal monocultures
Three different phytoplankton species from the culture collection in NIOZ-Texel were cultured in a ‘mix-f/2’ medium at 15°C in a 16:8 Light:Dark cycle at 50 µmol photons s−1 m−2. Approximate cell sizes ranged from 2 µm (Micromonas pusilla) to 10 µm (Prorocentrum minimum) to 50 µm (Prorocentrum belizeanum) in minimum dimension (width). One to two days prior to the tests the cultures were diluted with fresh medium to ensure cells with a good physiological condition. On the day of analysis, 2 mL aliquots were stored in a refrigerator until required for analysis. Short-term sample storage in a refrigerator does not affect cell vitality as documented by Gollasch and David (Citation2017). Duplicate samples were provided in two different concentrations: a low concentration of 10 cells per mL, and a high concentration of 1,000 cells per mL. The low concentration sample was obtained by a 100 × dilution of the high concentration sample using fresh culture medium.
Flow cytometers measured algal cell concentrations (cells/mL) in duplicate at the two flow rates (low and high). Prior to all analysis, commissioning runs were carried out for all instruments using a high concentration culture of 4 µm Phaeocystis globosa cells, to confirm the instruments’ ability to detect and determine phytoplankton cells by adjusting the red fluorescence detector (photomultiplier tube (PMT). The number of cells to be counted was preferably 1,000. However, because at 10 cells per mL this would lead to an impractical counting time and sample volume (100 mL), a minimum of 25 counted cells was used (count error = 20%). This means that a minimum of 2.5 mL had to be counted.
Comparative microscope counts for the 2–10 and 10–50 µm size ranges were undertaken using 1 mL Sedgewick-Rafter counting chambers after adding FDA using epifluorescence microscopy (green fluorescence) on the standard Zeiss microscopes. Similar to the size calibration bead counts, samples at low and high cell concentrations were injected into a flow cell, automatically scanned by the oLine D3HM and holograms captured for subsequent manual counting.
Wadden Sea sample
A plankton sample taken from the Wadden Sea was examined using microscopy and flow cytometry and the phytoplankton in both the 2–10 and the 10–50 µm size classes were enumerated. A software pre-selection to remove debris, detritus and cyanobacteria was applied where necessary. Due to the low natural organism concentration in the Wadden Sea in February 2013 when nutrient concentrations were still high, a sample was collected at the NIOZ jetty (53.0 N, 4.8 E) one week prior to the experiments and incubated at 15°C, 16:8 L:D cycle at 50 µmol photons s−1 m−2, i.e. at standard NIOZ conditions for growing local phytoplankton, to ensure an adequate abundance of vital plankton cells. On the day of analysis the sample was stored in a refrigerator.
Flow cytometers analysed samples in duplicate at the two flow rates (low and high) and the two different cell concentrations using the flow cytometer settings for FS and FBR determined for the algal monoculture samples. The maximum and minimum flow rate of the flow cytometers were set with the aim of measuring approximately 103–104 cells.
Plankton cells in the size range 10–50 µm were counted in a 1 mL Sedgewick-Rafter chamber for the Wadden Sea sample after the addition of FDA using epifluorescence microscopy (Reavie et al. Citation2010). The oLine D3HM was also used to count the 10–50 µm range. However, given the colour and fluorescence restrictions of the D3HM, any count would also include debris and not distinguish live from dead cells.
Finally, duplicate Lugol-preserved Wadden Sea samples were prepared using the Utermöhl sedimentation method (Utermöhl Citation1958) and counted on the inverted Zeiss microscope, assuming that most intact cells in the sample were living at the time of preservation. Two microscopists counted the observed phytoplankton in two different ways. One microscopist counted ‘entities’ i.e. a colony assembled of multiple cells was counted as one object, as this is comparable to flow cytometer counting, whilst the second microscopist counted every cell as a separate cell, even if found in colonies.
Statistics
The Coefficient of Variation (CV) was calculated for flow cytometer measurements as a measure of precision. It is the ratio of the standard deviation (SD) to the mean (SD/mean) × 100%. The relative precisions of the flow rates were also computed by dividing the 95% confidence interval (CI) of the mean flow rate by the mean flow rate. The 95% CI was calculated in Excel from n observations and the standard deviation (SD) as: ± t × SD/SQRT(n), with t from a t-table for t(0.975) with df = n−1 (df = degrees of freedom). The Kruskal-Wallis one-way ANOVA test statistic and the Dwass-Steel-Chritchlow-Fligner Test for All Pairwise Comparisons were made in SYSTAT. Linear regression and t-tests were also performed in SYSTAT. The significance level used was 95% (P < 0.05).
Results
Flow rates
The minimum and maximum flow rates of the different flow cytometers ranged from 9 µL/min to 869 µL/min, respectively (Table ). These were in the ranges reported by the manufacturers (Supplemental Table 1). At a low flow rate setting only one instrument (FACSCanto) had a relatively large variation (>25%). At high flow rates most instruments attained a good relative flow rate precision near or below 10% (Table ). Although a high flow rate can lead to a less stable sample flow, the enumeration precisions were not lower than at the low flow rates. The maximum flow rates of the instruments tested ranged nearly tenfold: from 0.1 to 0.9 mL/min. In other words, the analysis time of 1 mL sample was 1–10 min depending on the instrument.
Table 1. Mean flow rates (µL/min) of the flow cytometers at low and high settings ± relative precision (95% confidence interval of the mean flow rate/mean flow rate). The mean flow rates are averages of a total of 4 measurements performed over two different days (2 per day) for all flow cytometers, except the Attune 1, where only 3 measurements were taken.
Enumeration
Size calibration beads
The counts by standard microscopy, flow cytometry and holographic microscopy were comparable but variable for all four beads without a clear tendency among the three techniques (Table ). A Kruskal-Wallis one-way ANOVA test statistic was 2.3 (P > 0.05), and the Dwass-Steel-Chritchlow-Fligner Test for all pairwise comparisons did not reveal significant differences among the methods.
Table 2. Total averaged concentrations of beads/mL for the size calibration beads counted by three different methods: two standard (brightfield) microscopes, five flow cytometers (including both low and high flow rate measurements) and the holographic microscope (oLine D3HM). 44 µm beads were not counted with the oLine.
Size calibration beads counted at the two flow cytometer flow rates indicated that at high flow rates relatively fewer size calibration beads were counted. The slope (0.84) was significantly different from 1 (t-test, df = 16) indicating a significant underestimation (Figure ). In addition, the FS and FBG precisions were generally <25% although some values exceeded 50% at a high flow rate (Figure ). The comparison between the low and high flow rates indicated that at higher flow rates the CV of FS increased, hence precision decreased (Table ). The slope (1.55) was significantly different from 1 (t-test, df = 18) indicating a significant increase of the CV (Figure (A)). FBG precision between the low and high flow rates revealed that at higher flow rates the CV was systematically 8% higher, hence precision was 8% lower (Figure (B)).
Figure 1. Size calibration bead concentrations (beads/mL) measured by flow cytometry instruments at two different flow rates. The dashed line is the 1:1 ratio. The solid line is the linear regression line.
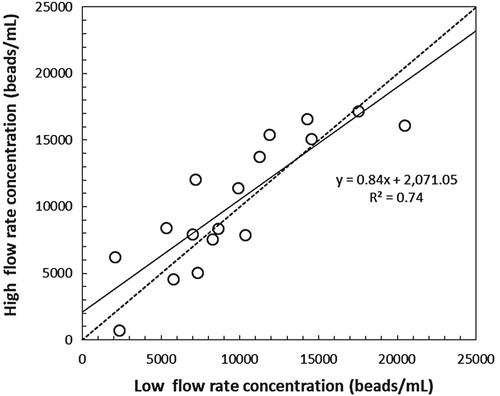
Figure 2. The precision of (A) Forward Scatter (FS) and (B) Fluorescence from Blue (excitation) to Green (emission) (FBG) expressed as coefficient of variation (%CV) for measurements of size calibration beads by flow cytometers at two different flow rates (high vs. low). The dashed line is the 1:1 ratio. The solid line is the linear regression line.
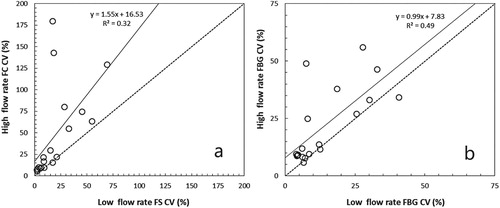
Table 3. Precision of forward scatter and green fluorescence (FBG) measurements expressed as the coefficient of variation in percent (%CV). Precision was measured for differently sized calibration beads at low and high flow rates (FR). For reasons of simplicity we only present the total average precision values calculated for all flow cytometers.
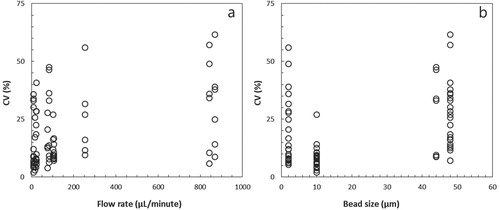
Except for the difference in slopes between FS and FBG precisions at low and high flow rates, the average precision for all bead sizes together was similar between FS and FBG and between low and high flow rates. However, in general, the precision of both FS and FBG at higher flow rates decreased (Figure (A)). A considerable variation in CV was also encountered for the different calibration bead sizes, except for the 10 µm beads which showed an average precision of 8% (Figure (B)).
Figure 3. Precision of FS and Green Fluorescence (FBG) measurements expressed as coefficient of variation (%CV) of four differently sized calibration beads as a function of (A) flow rate and (B) calibration bead size (µm).
Algal monocultures
Small cells, such as M. pusilla (2 µm), proved difficult to count by brightfield or holographic microscopy with the microscopy settings used in this study (400 × for the Zeiss and a 20 × objective for the oLine D3HM), irrespective of which counting chamber was used. The oLine D3HM gave an overestimation of the cell concentration because the black and white camera had difficulties distinguishing between cells and other small particles. Therefore, only one measurement for this species was made with this instrument. For the cells ≥10 µm, the different microscope techniques gave similar results (Table ). The highly concentrated P. minimum (10 µm) samples gave nearly identical concentrations when counted by brightfield and holographic microscopy. Good agreement was also achieved for the 50 µm P. belizeanum between epifluorescence and holographic microscopy. The counts from brightfield microscopy were notably higher.
Table 4. Average cell concentrations (duplicate counts) in cells/mL measured for three algal monocultures at low and high concentrations with three different microscopy methods. Dashed lines mean that no counts were made. (Mp = Micromonas pusilla, Pmin = Prorocentrum minimum, Pbel = Prorocentrum belizeanum).
The counts between the flow cytometer and brightfield microscope were very similar for M. pusilla at high concentrations despite the difficulty in counting M. pusilla with a microscope (Table ). In contrast, the differences between microscopy and flow cytometer counts were significant for P. minimum at both low and high concentrations and the largest difference was found for the biggest species P. belizeanum at high concentration. The smallest 95% CI (14%) for flow cytometry counts was achieved for M. pusilla cells at the highest concentration. The average CI of all five estimates was 55%. The largest CI was calculated for P. belizeanum (145%) at its high concentration due to the widely varying estimates of the different flow cytometers. The large size of the organism made it difficult to count accurately and some operators reported clogging of the instrument. Clogging was less problematic at the low P. belizeanum concentration where the confidence interval was reduced to 59%.
Table 5. Average cell concentrations (cells/mL) for three algal monocultures: Micromonas pusilla (Mp), Prorocentrum minimum (Pmin) and Prorocentrum belizeanum (Pbel) at two concentrations: ‘low’ and ‘high’. Averages are calculated from duplicate measurements by flow cytometers at two flow rates. The overall average is the mean of all flow cytometers ± 95% confidence intervals in absolute (no. of cells/mL) and relative numbers (%). Average counts for all microscope systems are given for comparative purposes from Table .
Cell counts obtained from the different systems showed that the cell concentrations in the three cultures were not as originally intended for the low and high concentration samples (10 and 1000 cells/mL, respectively). M. pusilla concentrations were in fact 10 × higher, P. minimum concentrations were 3 × higher and only the concentrations of P. belizeanum were more similar to the intended concentrations.
Wadden Sea sample
The microscopists differentiated the phytoplankton they observed as ‘entities’ (i.e. organism particles that might include single cells and multi-celled colonies such as chains, filaments and globular forms) and ‘cells’ (irrespective of whether it was a part of a multi-celled entity) (Table ). Cell counts with the bright field microscope were a factor of 4–6 times higher than entity counts. In the 2–10 µm size range, three flow cytometers delivered organism concentrations that were in the same order of magnitude as the entity microscope counts. Both the Accuri C6 and CytoSense delivered ≥ 10-fold higher counts compared to the entity microscope counts. In the 10–50 µm size range, most flow cytometers delivered organism concentrations that were comparable to the microscopic cell counts. The FACSVerse was in stark contrast to all other flow cytometers with very low counts in both size classes, probably reflecting technical problems.
Table 6. Average cell concentrations (cells/mL) determined for phytoplankton in the 2–10 and 10–50 µm size classes of Wadden Sea samples at two different flow rates. Averages are calculated from duplicate measurements and combine counts from low and high abundance samples for the flow cytometers. Brightfield 1 is the estimate of ‘entities’ (colonies counted as one ‘cell’) and brightfield 2 is the estimate of ‘single cells’ (all cells within a colony are counted as separate cells). Microscopists analyzed one sample each, whilst for the 10–50 µm size class two ‘single cell’ counts were made.
Higher flow rates generally resulted in a higher organism concentration estimate (Table ). The cell concentrations were significantly higher (21%, P < 0.05, t-test, df = 7) at higher flow rates. Only the Attune flow cytometers had higher cell counts at the low flow rate for the 2–10 µm size range.
The oLine D3HM was also used to count the objects in the 10–50 µm range. A total count of 3,376 objects was obtained (Table ). Given the lack of colour and fluorescence information for the D3HM system, this total count would also include debris. An initial manual check of the captured images of what was clearly identifiable as phytoplankton led to a count of 422 cells.
Discussion
Counts made by the different instruments, microscopes as well as flow cytometers, were mostly in the same order of magnitude but did show noticeable differences. In general, all instruments used during the experiments were capable of measuring 2–10 µm objects. In the size range 10–50 µm, and particularly at low flow rates, the Accuri C6 and FACSCanto systems reported clogging problems whilst the CytoSense system could have been affected by sedimentation effects in the sample tubing, whereby large (and heavy) objects will sink to the bottom before entering the injector for analysis. All other instruments were able to measure cells up to 50 µm in size. Flow cytometers are known to have problems with blockages, particularly with environmental samples (Vesey et al. Citation1994). Overall, higher flow rates resulted in lower calibration bead counts, but this was in contrast to the observations for the Wadden Sea sample where more phytoplankton cells were counted at higher flow rates. Higher flow rates result in more shear that may lead to the disruption of colonies into individual cells and enhanced particle counts. Colonies were not present in the cultures used. Phytoplankton counts in the Wadden Sea samples generally mismatched between different instruments, particularly for the 2–10 µm size range (Table ).
Flow cytometer counts and holographic microscope counts were similar for the 2 µm calibration beads, yet standard microscopy counts were clearly higher confirming previous findings that automated tools are more inclined to underestimate concentrations of particles (Kydd et al. Citation2017). In addition, microscope counts were done at low magnifications which would make the distinction of beads to other particles, such as debris, more difficult and may explain the higher concentrations reported. It was further noted that the flow cytometers delivered higher counts when using 44 µm beads compared to the microscopes, whilst for the 51 µm beads it was vice versa (Table ). We noted that microscopic counts are more accurate for larger beads because cytometers are limited by the size of the flow aperture. Less accurate cell counts for large cells using flow cytometers has been previously recognised (Cunningham and Buonnacorsi Citation1992). This was also reflected in the cell counts from flow cytometers for the monocultures, where abundances were clearly highly variable for the large P. belizeanum cells, especially at the high flow rates (Table ). Clogging or sedimentation problems already encountered with the calibration bead measurements most likely also affected flow cytometer systems for these samples. Counts between microscopy and flow cytometers for the smaller algal monocultures M. pusilla and P. minimum were generally more similar (Table ) and would be less affected by clogging or sedimentation problems.
A large variability between cell counts was observed for the Wadden Sea sample and reflects key problems encountered by both the flow cytometers as well as the microscopists. Counting results by a microscopist are possibly affected by a biased judgment of living cells and individual differences in sample handling and counting experience. In addition, microscopists are also affected by the need to measure the minimum dimension of each cell. Sizing is also a key issue for flow cytometers. The microscope counting of Lugol-preserved samples as either entities or single cells clearly demonstrates the discrepancy encountered between the way cells can be observed. Flow cytometers are not capable of making a distinction between single cells within a chain and will always count multi-cell colonies or aggregates as one entity (Veldhuis et al. Citation2005; Christaki et al. Citation2011; Zhou et al. Citation2012). Smaller cells will generally not be affected by disintegration processes due to the shear forces of the fluid flow, suggesting instead that the differences between the cytometer counts for the small size fraction are governed largely by flow cytometry gain settings that determine the sensitivity for the smallest cells as well as the signal threshold settings. Despite all efforts to work with optimal settings for acquiring data and the interpretation of the data obtained from the flow cytometers, it cannot be excluded that sub-optimal settings were inadvertently used.
Ideally, an indicative ballast water analysis should be done on board a vessel by a Port State control officer or a dedicated expert and the result should be available promptly to enable any non-compliance action before the vessel’s ballast water is discharged completely in the harbour. This study confirms that the use of microscopes is unsuitable for an indicative analysis of a ballast water sample because microscopes are, in the same way as other instruments, limited in their portability, and it can take approximately one hour to provide a result. Flow cytometers are also of limited use in Port State control activities because most of them are not portable and may also need comprehensive calibration after transport. However, flow cytometers may be used for applications where many samples need to be processed in a short period of time. One such example is the performance or proof-of-concept tests of ballast water treatment systems (BWTSs) because a large number of samples may be processed to an acceptable level of accuracy in a short period of time. With a large number of samples processed promptly, BWTSs may be optimised regarding the minimum required treatment (e.g. dosage of active substances or UV) to treat ballast water to a level of discharge compliance.
Results obtained by flow cytometers should be interpreted carefully and require further studies on several aspects: (1) Additional developments are required for an automated documentation of the minimum dimension of organisms. An improvement may be to consider installing a camera at an orthogonal angle and to measure size using image analysis such as the CytoSense flow cytometer (Malkassian et al. Citation2011). However, this will add to the sample analysis time. (2) Additional tests are required for natural samples, given that algal (mono-)cultures with healthy organisms grown under optimal conditions are not representative of samples that have been treated, and thus may contain much higher proportions of debris and dead cells. Detection technologies need to be challenged to identify living cells in sub-optimal conditions which are expected under the wide variety of physical, chemical and biological conditions at ports. (3) Finally, because regulatory criteria are based on cell concentrations, assessments of multi-celled entities need refinement so that accurate cell counts can be obtained from natural samples where chain formation is a common phenomenon.
When samples are analyzed for compliance, we recommend that at least three measurements of a sample are performed to establish a confidence interval of the mean. To prove compliance with ballast water management standards a detailed analysis with an accurate enumeration of cells according to their minimum dimension and, at the same time, a separation of living and dead organisms is needed. Unlike in certification testing of ballast water treatment systems, where samples include both untreated (high numbers) and treated (low numbers) samples, for compliance testing it would be anticipated that organism concentrations would be low, i.e. the variability associated with high concentrations of organisms would be of limited relevance. It is concluded that, with today’s organism detection technologies, a detailed ballast water analysis that strictly conforms to regulatory standards can only be performed to an acceptable level of accuracy and precision when the samples are processed by a trained microscopist. Flow cytometry on the other hand is a suitable technology for an indicative analysis of ballast water samples. Noting the shortcomings of the organism detection methods as stated some changes may eventually be needed in regulations as applied by Port State Control to enable a robust indicative analysis of ballast water samples, which in turn would enable prompt non-compliance actions to protect the environment from the release of non-compliant ballast water.
Acknowledgements
We express our grateful thanks to an endless number of helping hands at NIOZ, which were essential to make this workshop a success. Especially Anna Noordeloos, Alex Blin and Josje Snoek (NIOZ, Den Hoorn, The Netherlands) are thanked for the intensive preparations of this exercise.
Disclosure statement
No potential conflict of interest was reported by the authors.
ORCID
Louis Peperzak http://orcid.org/0000-0003-0691-2521
Eva-Maria Zetsche http://orcid.org/0000-0001-5460-5134
Stephan Gollasch http://orcid.org/0000-0003-4410-6969
George B.J. Dubelaar http://orcid.org/0000-0002-1678-6090
Roland Langelaar http://orcid.org/0000-0001-5896-082X
Aud Larsen http://orcid.org/0000-0001-5217-9274
Albert Mosselaar http://orcid.org/0000-0003-1638-5892
Euan D. Reavie http://orcid.org/0000-0001-8871-5809
August Tobiesen http://orcid.org/0000-0003-3779-5831
Additional information
Funding
References
- Christaki U, Courties C, Massana R, Catala P, Lebaron P, Gasol JM, Zubkov MV. 2011. Optimized routine flow cytometric enumeration of heterotrophic flagellates using SYBR green I. Limnol Oceanogr Methods. 9:329–339. doi:10.4319/lom.2011.9.329.
- Cunningham A, Buonnacorsi GA. 1992. Narrow-angle forward light scattering from individual algal cells: implications for size and shape discrimination in flow cytometry. J Plankton Res. 14:223–234. doi: 10.1093/plankt/14.2.223
- Gollasch S, David M. 2017. Algae viability over time in a ballast water sample. J Sea Res. 123 (Special Issue Ballast Water Management). doi:10.1016/j.seares.2017.04.005.
- Hofstraat JW, van Zeijl WJM, Peeters JCH, Peperzak L, Dubelaar G. 1990. Flow cytometry and other optical methods for characterization and quantification of phytoplankton in seawater. Environment and pollution measurement sensors and systems, Book 1269; Society of Photo Optical Engineers; Washington.
- Hoppenrath M, Elbrächter M, Drebes G. 2009. Selected microphytoplankton species from the North Sea around Helgoland and Sylt. Germany: Schweizerbart Science Publishers.
- [IMO] International Maritime Organization. 2015. Guidance on ballast water sampling and analysis for trial use in accordance with the BWM convention and guidelines (G2), BWM.2/Circ.42/Rev.1. London: International Maritime Organization.
- [IMO] International Maritime Organization. 2016. 2016 guidelines for approval of ballast water management systems (G8). MEPC. 279(70):1–40. London: International Maritime Organization.
- Joachimsthal EL, Ivanov V, Tay J-H, Tay ST-L. 2003. Flow cytometry and conventional enumeration of microorganisms in ships ballast water and marine samples. Mar Pollut Bull. 46:308–313. doi: 10.1016/S0025-326X(02)00401-0
- Kydd J, Rajakaruna H, Briski E, Bailey S. 2017. Examination of a high resolution laser optical plankton counter and FlowCAM for measuring plankton concentration and size. J Sea Res. doi:10.1016/j.seares.2017.01.003.
- Lund JWG, Kipling C, Le Cren ED. 1958. The inverted microscope method of estimating algal numbers and the statistical basis of estimations by counting. Hydrobiologia. 11:143–170. doi: 10.1007/BF00007865
- MacIntyre HL, Cullen JJ, Collier J. 2016. Classification of phytoplankton cells as live or dead using the vital stains fluorescein diacetate and 5-chloromethylfluorescein diacetate. J Phycol. 52(4):572–89. doi:10.1111/jpy.12415.
- Malkassian A, Nerini D, van Dijk MA, Thyssen M, Mante C, Gregori G. 2011. Functional analysis and classification of phytoplankton based on data from an automated flow cytometer. Cytometry Part A. 79A(4):263–275. doi: 10.1002/cyto.a.21035
- [NSF] National Sience Foundation-International. 2010. Generic protocol for the verification of ballast water treatment technology. Ann Arbor (MI): EPA.
- Peperzak L, Brussaard CPD. 2010. Phytoplankton viability assay for oil compounds in water. In: Timmis KN, editor. Handbook of hydrocarbon and lipid microbiology, book 5. Berlin, Heidelberg: Springer-Verlag; p. 4499–4508.
- Peperzak L, Brussaard CPD. 2011. Flow cytometric applicability of fluorescent vitality probes on phytoplankton. J Phycol. 47:692–702. doi: 10.1111/j.1529-8817.2011.00991.x
- Peperzak L, Gollasch S, editors. 2014. NIOZ Flow Cytometer Workshop, Comparing organism detection instruments in measuring 2–10 μm and 10–50 μm plankton cells. Final report, prepared for Interreg IVB Project Ballast Water Opportunity. p. 66.
- Reavie ED, Cangelosi AA, Allinger LE. 2010. Assessing ballast water treatments: evaluation of viability methods for ambient freshwater microplankton assemblages. J Great Lakes Res. 36:540–547. doi: 10.1016/j.jglr.2010.05.007
- Selvin R, Reguera B, Bravo I, Yentsch CM. 1988. Use of fluorescein diacetate (FDA) as a single cell probe of metabolic activity in dinoflagellate cultures. Biol Oceanogr. 6:505–511.
- Stehouwer PP, Liebich V, Peperzak L. 2013. Flow cytometry, microscopy, and DNA analysis as complementary phytoplankton screening methods in ballast water treatment studies. J Appl Phycol. 25:1047–1053. doi:10.1007/s10811-012-9944-8.
- Tang YZ, Dobbs FC. 2007. Green autofluorescence in dinoflagellates, diatoms, and other microalgae and its implications for vital staining and morphological studies. Appl Env Microbiol. 73:2306–2313. doi: 10.1128/AEM.01741-06
- Utermöhl H. 1958. Vervollkommnung der quantitativen phytoplankton methodik. Mitt Int Vereinigung Theoretische Angew Limnol. 9:1–38.
- Veldhuis MJW, Brussaard CPD, Noordeloos AAM. 2005. Living in a Phaeocystis colony: a way to be a successful algal species. Harmful Algae. 4:841–858. doi:10.1016/j.hal.2004.12.013.
- Veldhuis MJW, Cucci TL, Sieracki ME. 1997. Cellular DNA content of marine phytoplankton using two new fluorochromes: taxonomic and ecological implications. J Phycol. 33:527–541. doi: 10.1111/j.0022-3646.1997.00527.x
- Veldhuis MJW, Kraay GW. 2000. Application of flow cytometry in marine phytoplankton research: current applications and future perspectives. Sci Mar. 64:121–134. doi: 10.3989/scimar.2000.64n2121
- Vesey G, Narai J, Ashbolt N, Williams K, Veal D. 1994. Detection of specific microorganisms in environmental samples using flow cytometry. Meth Cell Biol. 42:489–522. doi: 10.1016/S0091-679X(08)61092-4
- Zetsche E, El Mallahi A, Meysman FJR. 2016. Digital holographic microscopy: a novel tool to study the morphology, physiology and ecology of diatoms. Diatom Res. 31(1):1–16. doi:10.1080/0269249X.2016.1140679.
- Zetsche E, Meysman FJR. 2012. Dead or alive? Viability assessment of micro- and mesoplankton. J Plankton Res. 34(6):493–509. doi: 10.1093/plankt/fbs018
- Zhou Q, Chen W, Zhang HY, Peng L, Liu LM, Han ZG, Wan N, Li L, Song LR. 2012. A flow cytometer based protocol for quantitative analysis of bloom-forming cyanobacteria (Microcystis) in lake sediments. J Environ Sci. 24:1709–1716. doi:10.1016/S1001-0742(11)60993-5.