
 ?Mathematical formulae have been encoded as MathML and are displayed in this HTML version using MathJax in order to improve their display. Uncheck the box to turn MathJax off. This feature requires Javascript. Click on a formula to zoom.
Abstract
In this paper, a risk cloud model (RCM) based on cloud model theory is proposed for evaluating risks in the nautical navigational environment (NNEt). To validate the method, the proposed strategy is applied to a risk evaluation of NNEt of the waters around the Hangzhou Bay Sea-Crossing Bridge and the results are compared with those of a conventional fuzzy theory-based evaluation approach. The results show that risk evaluations based on the proposed RCM are robust, can accommodate uncertainty, can leverage multi-channel information, and provide a full-featured analysis of NNEt. In addition, plots of the RCM droplets provide an intuitive depiction of the risk level, which is extremely beneficial in analyses of the results. Thus, the proposed RCM and implementation method is well-suited for use in conducting risk evaluation of NNEt.
1. Introduction
According to marine engineering scholars (Balmat et al. Citation2009; Kobylinski Citation2009; Mokhtari et al. Citation2011; Abramowicz-Gerigk and Burciu Citation2014; Sahin and Kum Citation2015; Zhang et al. Citation2016a; Tian et al. Citation2017; Akyuz and Celik Citation2018; Khan et al. Citation2018), water transportation system (WTS) consist of human, ship, and environment subsystems. In this context, the environment subsystem is equivalent to the nautical navigational environment (NNEt), which includes all factors that affect the safety of ships or facilities, such as wind, wave, current, tide, fog, visibility, channel length, channel width, channel water depth, channel bend, shipping route cross, ship traffic flow characteristics (e.g. ship traffic flow volume, ship traffic flow density, etc.), obstacles to navigation, navigational aids, etc.
Risk in NNEt refers to the possibility of an unsafe event or state occurring due to NNEt’s effect. The risk level of the NNEt typically reflects the likelihood of an unsafe event or state occurring. The higher the risk level, the more likely an unsafe event or state will occur. When analysing the risk (or safety) of NNEt, a risk evaluation is conducted to identify and analyse the potential hazards and provide a corresponding qualitative and/or quantitative determination regarding the risk level. Such evaluations are used to support safety management related decision-making (e.g. adopting preventive measures against risk) to ensure the safety of WTS. For example, literatures (Mokhtari et al. Citation2011; Sahin and Kum Citation2015; Tian et al. Citation2017) mainly focus on analysing the risk in NNEt.
However, evaluating the risk (or safety) of WTS is a complex undertaking (Chen et al. Citation2010). Likewise, uncertainty will arise when conducting risk evaluation of NNEt. Many evaluations involve the judgement of experts who are likely to provide quantitative results in the form of numerical values or qualitative results in the form of fuzzy language, depending on the professional background of the expert and their personal understanding of the system or hazard in question. Thus, risk assessments often involve elements of fuzziness and randomness. In order to make full use of the information related to the uncertainties in a given situation, and to obtain a reasonable and credible risk evaluation, it is essential that there is an accurate mapping between the qualitative and quantitative results, and that the associated qualitative knowledge has been captured.
Based on its transformative ability to rationalise both qualitative and quantitative information, in this paper, cloud model theory is applied to the comprehensive risk evaluation of NNEt to take full advantage of uncertain information during the evaluation process. The main work involves: (1) proposing a risk cloud model (RCM) for evaluating the risk of NNEt based on the conventional cloud model theory, and (2) carrying out a case study to validate the proposed method and summarising its advantages. The remainder of this paper is organised as follows. Section 2 gives a literature review. Section 3 introduces the basis of cloud model theory. Section 4 describes the construction of the proposed RCM for evaluating NNEt. Section 5 presents a case study in which the proposed method is applied to risk evaluation of the NNEt in the waters surrounding the Hangzhou Bay Sea-Crossing Bridge. Finally, the conclusions are presented in Section 6.
2. Literature review
In recent years, many theories and models have been developed for the risk analysis and evaluation of WTS under uncertainty. Ventikos et al. (Citation2017) applied a seismic-driven model for calculating the probability of accident occurrence, and derived results through a statistical analysis. Cao et al. (Citation2014) constructed probability–consequence-included risk matrix to evaluate the risk of accidents that caused injury to the crew. Based on the probability theory, Sidek et al. (Citation2008) proposed a general risk model to evaluate the frequency of grounding and collision accidents of high-speed vessels. Zhang et al. (Citation2016b) developed a Bayesian belief network model for predicting the consequences of accidents in the Tianjin port. Riahi et al. (Citation2013) made use of a Bayesian network and a ‘symmetric method’ by exploiting a conceptual and sound methodology to assess a seafarer’s performance. Mabrouki et al. (Citation2014) proposed a specific methodology based on the analytic hierarchy process (AHP) to analyse and assess operational risk within the port terminals at the RO–RO activity. Chen et al. (Citation2013a) evaluated the risk level of navigational environment of breakwater area based on AHP. Sii et al. (Citation2001) proposed a fuzzy-logic-based approach to evaluate risk in maritime engineering, and applied the model to evaluate fire risk in an offshore support vessel. Pak et al. (Citation2015) used a fuzzy analytical hierarchy process (FAHP) to evaluate the importance of factors and rank the safety levels of targeted ports in Korea from a captain’s perspective. Wang et al. (Citation2014) evaluated the annual and seasonal navigational environment risk along shipping routes by using the FAHP and geographic information science. Ren (Citation2010) evaluated ship traffic control safety based on the AHP and fuzzy theory. Cao et al. (Citation2017) evaluated the safety of an aging offshore jacket platform by integrating AHP and Grey Clustering. Tian et al. (Citation2017) built a risk evaluation model for NNEt based on the grey fixed weight cluster method and applied the model to Qiongzhou Strait case. In response to the uncertainties, Yang et al. (Citation2009), Mokhtari et al. (Citation2012), and Zhang et al. (Citation2016a) used evidential reasoning (ER) combined with the fuzzy theory to build models for risk analysis and evaluation of WTS. Lu et al. (Citation2015) established a model based on extenics theory for evaluating the safety of a ship’s anchoring.
The above-mentioned methods have certain advantages. For example, probability–statistics-based approaches focus on overcoming the challenges of randomness, while other methods focus on overcoming the difficulties caused by fuzziness. As mentioned earlier, a definitive, reasonable, and credible evaluation requires an accurate mapping between the qualitative and quantitative variables, and also must capture the essence of the qualitative knowledge and uncertainty, both in terms of the fuzziness and randomness. Thus, it is desirable that a new more appropriate method of risk evaluation be developed based on a combination of new and existing theories, methods, etc.
Scholars Li et al. proposed a membership cloud model (or cloud model) (Li et al. Citation1995), that combined the basic principles of probability theory and fuzzy set theory for application in the field of intelligent control (Li et al. Citation1998). That cloud model fully integrated fuzziness and randomness and provided a mapping between qualitative and quantitative information, and thereby functioned as a powerful tool for processing a combination of qualitative and quantitative information (Wang et al. Citation2010). More objectively, methods of knowledge representation and reasoning that are based on a cloud model are able to fully express the fuzziness and randomness of uncertainty and, to a certain extent, cloud model based handling methods can resolve missing information while gathering data (Wang and Liu Citation2012). Over time, the cloud model has been used in an expanded array of applications, and is now widely applied in the comprehensive evaluation of complex systems (Du et al. Citation2008).
There are some attempt cases on introducing cloud model theory to risk analysis and evaluation of WTS. Zhang et al. (Citation2010a) presented a novel safety assessment approach to marine traffic based on cloud models, and proved that the proposed algorithm was effective, intuitive, and superior to other methods. Yang et al. (Citation2013) presented a practical multi-criteria group decision-making method for decision-making under uncertainty, where the normal cloud model was adopted as one of effective means to handle the randomness and fuzziness of individual judgments. In order to treat the uncertainties of abstract concepts and qualitative information, Zhang et al. (Citation2010b) presented a novel comprehensive evaluation method for evaluating a seafarer's competency based on cloud models, and by using a simulation scheme proved that the proposed synthetic method was practical, able to generate intuitive, flexible, and reliable results which were consistent with human thinking and reasoning modes. To solve the quantisation problem of uncertain information that consisted of fuzziness and randomness, Hu et al. (Citation2012) introduced the cloud model to simulate risk in place of the probability distribution model, and proved that the cloud model based simulation results were more accurate, closely agreeing to the characteristics of original samples. In order to treat randomness and fuzziness, Zhu et al. (Citation2013) presented a cloud model for comprehensively evaluating ship's traffic adaptability, and performed an application study to prove that the proposed model was feasible, effective and could provide a more intuitive and reliable result. Aiming at a fairer evaluation result, in an early study Tian and Huang (Citation2015) presented a relatively simple risk evaluation model based on the one-dimensional normal cloud model, to as far as possible reflect the unity of fuzziness and randomness in the natural world, or in human knowledge.
As discussed, cloud model theory combines the basic principles of probability theory and fuzzy set theory, integrates fuzziness and randomness, and forms a mapping between qualitative and quantitative information, all of which makes it suitable for the comprehensive evaluation of complex systems. In this paper, cloud model theory is applied to the risk evaluation of NNEt.
3. Basis of the cloud model theory
3.1. Numerical characteristics of a cloud model
Nowadays, the cloud model theory has been developed based on the concept of cloud model firstly proposed by Li et al. (Citation1995). Mathematical definition of the cloud model can be found in the original paper (Li et al. Citation1995). A cloud model (sometimes called ‘cloud’ for short) effectively integrates three characteristic parameters, namely, the expected value (), entropy (
), and hyper entropy (
), to depict the randomness and fuzziness of a qualitative concept and to reflect the quantitative essential nature of the concept (Tseng et al. Citation2011). The cloud model with characteristic parameters (
,
and
) is denoted by the symbol
. Here,
is the expectation of quantitative expressions in the domain of discussion, and therefore regarded as the most typical sample of quantitative expressions;
is the uncertainty (or stochastic) measure of quantitative expression, and
is the uncertainty measure of entropy, which is determined by both the randomness and fuzziness of the entropy (Tian and Huang Citation2015).
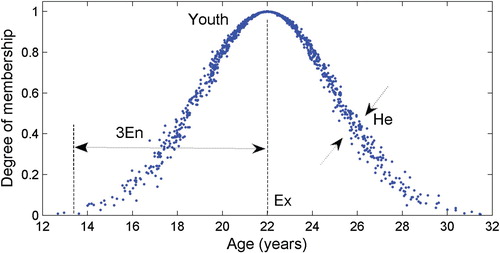
Generally speaking, while there are many examples of cloud models in the literature, the normal cloud model is the most common used (Li and Liu Citation2004). In this paper, all subsequent references to cloud models refer to the normal cloud model. For example, Figure shows a one-dimensional normal cloud model that indicates the uncertain expression ‘Youth’ (Tian and Huang Citation2015), which is a qualitative concept. In addition, quantitative values outside
are ignored as per the
rule that is typically applied in a normal cloud model (Li and Liu Citation2004; Wang et al. Citation2010; Yong Citation2011).
Figure 1. The normal cloud model indicating ‘Youth’.
3.2. Cloud generator and the algorithm
A cloud generator (CG) refers to hardware or software that is able to realise the transformation between a qualitative concept and a quantitative equation. There are two main types of cloud generators, namely, the forward cloud generator (CG+) and backward cloud generator (CG−). Examples of these are shown in Figure .
Figure 2. Cloud generators (left: the forward cloud generator; right: the backward cloud generator).
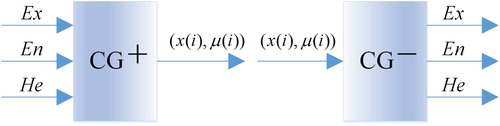
A forward cloud generator can realise the mapping from a qualitative description to a quantitative expression and produce droplets according to the numerical characteristics of a cloud, while a backward cloud generator can realise the transformation from a quantitative expression to a qualitative description and convert specific data to numerical characteristics to describe a qualitative concept. In Figure , a data point with the coordinate is called a cloud droplet:
is an element (a quantitative value) in the domain of discourse, and
is the degree of membership to a qualitative concept as for
.
The algorithm that enables the cloud generator’s function is called cloud generator algorithm. Correspondingly, there are two kinds of cloud generator algorithms: the forward/backward cloud generator algorithm respectively. Taking the normal cloud for example, the one-dimensional forward/backward normal cloud generator algorithm can be found in the literature (Lv et al. Citation2003).
4. Constructing RCM for evaluating NNEt
This section firstly introduces the variables for measuring risk, secondly constructs a RCM for evaluating NNEt, thirdly designs a reference scale for grading risk, and at last gives a step-wise approach to evaluate the risk of NNEt by using the RCM.
4.1. Variable settings for measuring risk
In the literatures related to risk evaluation of WTS (Chen et al. Citation2010; Hu et al. Citation2010; Xuan et al. Citation2013; Lu et al. Citation2015), five linguistic terms are often used to qualitatively demarcate the risk level: low (L), moderately low (ML), moderate (M), moderately high (MH), and high (H). The same linguistic terms are adopted for a qualitative evaluation in this study. The variables and their domains of discourse for measuring risk are as follows: (1) a linguistic variable called risk comment (rcmt) is used, which has five benchmark values: L, ML, M, MH, or H. That is, the domain of discourse of the linguistic variable is from L to H, and consists of five basic elements: L, ML, M, MH, and H. And, let be set of the five basic elements:
; (2) a numerical variable called risk degree (
), whose domain of discourse (i.e. the range of
) is [0 1], is used for the quantitative evaluation. These linguistic and numerical variables are adopted in this paper to indicate risk level. Furthermore, referring to the literature (Di et al. Citation1999), the domain of discourse of a numerical variable is considered to be a space capable of holding all types of language variables whose values are expressed by cloud models. With the above-defined variables and the designated domain of discourse, the relationship between rcmt and
is as shown in Table .
Table 1. Relationship between linguistic and numerical variables.
4.2. RCM: concept and meanings
Based on the above variables for measuring risk, this section puts forward the concept of RCM for risk evaluation of NNEt. The form and meanings of RCM are as follows.
Under the premise of the above variable settings, if the cloud model is able to comprehensively depict the risk level of an object, then the model
is referred to as a RCM for evaluating NNEt. In such a model, the expected value
is the mathematical expectation of the numerical variable
; as the randomness measure of
, the entropy
indicates the available range extending to both sides of the
; and as uncertainty measure of entropy
, the hyper entropy
is determined by both the randomness and fuzziness of
and essentially denotes the uncertainty measure about
. The entropy
and hyper entropy
together reflect the degree of uncertainty of the risk evaluation.
It should be noted that the RCM for use is the final result after all of the available risk evaluation information has been integrated. Thus, an RCM can be used as for comprehensive evaluation purposes.
With this in mind, the core work of completing an RCM for evaluating NNEt is to determine the parameters ,
and
. The process for computing these parameters is provided in 4.4.
4.3. Reference scale: the benchmark RCMs
A previous study presented an algorithm based on the golden section method to obtain characteristic parameters of the cloud models corresponding to five linguistic terms (Wang and Liu Citation2012). In this paper, the cloud models corresponding to the five linguistic terms used for measuring NNEt risk level are referred to as benchmark RCMs. Similarly, the algorithm described by Wang and Liu (Citation2012) is introduced here to determine the reference scales: calculating characteristic parameters of the benchmark RCMs. The algorithm is listed in Table .
Table 2. The golden section based algorithm for calculating the parameters of five benchmark RCMs.
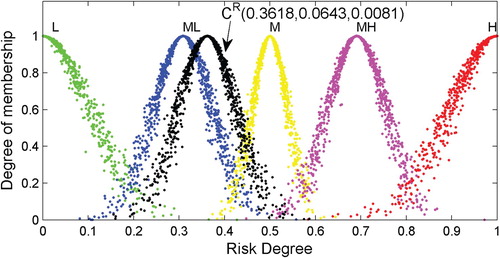
As per the parameter settings in the literature (e.g. the hyper entropy of the middle linguistic variable ‘moderate’ is set to 0.005) (Wang et al. Citation2010) and the algorithm listed in Table , the characteristic parameters of five benchmark RCMs are as shown in Table . Depictions of the five benchmark RCMs are shown in Figure , each of which contains 1000 droplets. Thus, with the golden section method, it is possible to establish mappings between a qualitative concept and quantitative expression, which can then be used as the reference scale in an evaluation.
Figure 3. Reference scale: appearances of benchmark RCMs corresponding to the five linguistic terms.
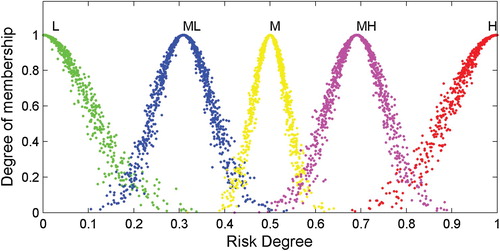
Table 3. Reference scale: parameters of benchmark RCMs corresponding to the five linguistic terms.
4.4. Process for computing RCM characteristic parameters
This paper summarises that three tasks need to be performed to compute RCM characteristic parameters with a concerned object.
Task 1: Obtaining an initial evaluation: the qualitative evaluation via expert investigation
In practice, the results of an evaluation are typically indicated qualitatively, as it is often convenient to express intuitive feelings this way. Therefore, a concise questionnaire is used to obtain the qualitative evaluation of an object of interest based on the judgement of an expert. An example questionnaire (the core part) is shown in Table , in which an expert is required to place a ‘✓’ in the appropriate space to indicate his evaluation of a particular object.
Table 4. An example questionnaire: the core part.
Task 2: Obtaining middle evaluation: the individual RCMs
After an initial risk evaluation of a certain object is obtained by consultation with an expert, the following method can be used to convert the initial qualitative evaluation to a quantitative result as a middle evaluation: the individual RCM.
Let be an individual RCM determined according to the
expert; then, the transformation from a qualitative evaluation to the individual RCM proceeds as follows:
(1)
(1)
where
represents the
expert;
and
is the total number of experts.
In other words, the individual RCM of a particular object is equal to the benchmark RCM corresponding to the linguistic term used by the expert. For example, if the expert evaluates an object using ‘moderately high’, the benchmark RCM
is recognised as the individual RCM of the object. Once Equation (1) has been applied, the individual RCMs as per respective experts can be determined.
Task 3: Obtaining a final evaluation: the RCM
As stated in 4.2, the RCM is a final comprehensive evaluation model. However, the process in Task 2 only determines the individual RCMs. Task 3 completes the process of determining the final RCM by synthesising the individual RCMs.
Suppose that there are individual RCMs defined according to Equation (1). Then, the final RCM
can be obtained by synthesising
as per Equation (2):
(2)
(2)
where the symbols
and
are defined as in Equation (1), and
is the weight of
, which indicates the authority of
. Since
is determined based on the judgement of the
expert,
can be considered to be the weight of the expert with respect to his authority relative to other experts, and the symbol ∘ represents an arithmetic operator.
At present, there are six operators that can be used (Xie and Chen Citation2012). In order to take full advantage of the uncertainty information and the influence of each cloud, Wang and Feng (Citation2005) proposed a method of generating a floating cloud that integrates multiple individual clouds based on a weighted average operator. The concept of a weighted average operator is therefore adopted in this paper, which means that ∘ specifically delegates (+, ·). Then, Equation (2) becomes Equation (3):
(3)
(3)
where the characteristic parameters are defined as follows:
(4)
(4)
With Equations (3) and (4), the individual RCMs can be combined to produce the final RCM
. The characteristic parameters of
can then be obtained for quantitative evaluation purposes. From this, it can be inferred that the final RCM corresponds to a linguistic term for qualitative evaluation. This term may correspond to one of the existing five or an undefined word/phrase which is located in the blanks among the existing five.
4.5. Step-wise approach to risk evaluation using the RCM
Generally, there are four steps when conducting a risk evaluation of NNEt using the proposed RCM:
Step 1: Determining the object of interest via a system analysis
As mentioned in Section 1, the system NNEt is composed of many elements. As per the literatures (Chen et al. Citation2013b; Sun et al. Citation2012), these elements can be classified into three categories: the natural environment, channel condition, and traffic environment. Thus, this system analysis may indicate the overall NNEt or a subcomponent (e.g. the natural environment, or a basic element such as ship traffic flow volume, etc.) of the NNEt should be used as the object to be evaluated.
Step 2: Obtaining initial evaluation via expert investigation
This step involves completing tasks 1. Using the above linguistic terms, questionnaires (the core part can be seen in Table ) are provided to the selected experts to obtain their initial qualitative evaluations of the object of interest.
Step 3: Achieving the applicable RCM indicated by the initial evaluation
This is the key step, which involves completing tasks 2 and 3. The qualitative evaluation from an expert is converted to an individual RCM using Equation (1). Then, with Equations (3) and (4), the individual RCMs are integrated into a final RCM
for evaluating the object of interest.
Step 4: Producing and plotting the cloud droplets for analysis purposes
With characteristic parameters, cloud droplets of a cloud model can be produced using the forward cloud generator, as mentioned in Section 3.2. Specifically, since an RCM is a normal kind, essentially the one-dimensional forward normal cloud generator algorithm (Lv et al. Citation2003) is used to produce cloud droplets according to the corresponding characteristic parameters of the final RCM.
A cloud droplet of an RCM is a data point with the coordinate , where
is the degree of membership about
. The one-dimensional forward normal cloud generator algorithm (Liu et al. Citation2003) can be used to produce N cloud droplets of an RCM. Then, by using the reference scale as the background, the generated cloud droplets can be plotted in the rectangular coordinate system to provide a visual representation of risk level and benefit analysis.
At last, the step-wise approach to risk evaluation of NNEt by using the RCM is shown in Figure .
5. Case study
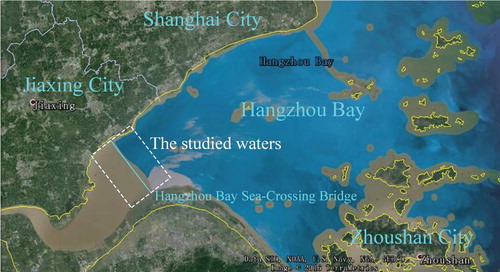
To validate the proposed method, the NNEt of the waters around the Hangzhou Bay Sea-Crossing Bridge is chosen for analysis. In so doing, the above-proposed model and technical approach are applied to evaluate the risk of considered NNEt in order to (1) directly show the risk level of the object of interest (i.e. the NNEt), and (2) verify the feasibility of the proposed method. The case study in this section proceeds corresponding to the steps described in Section 4.5 and in Figure .
5.1. Overview of the area of interest
The Hangzhou Bay is widely regarded as an ‘angry gulf’ as it has extremely complex hydrological and meteorological conditions (Wu et al. Citation2012). The construction of the bridge at the Hangzhou Bay Sea-Crossing significantly increased the risk to both moored and moving ships in the marine area, the largest of which is the potential for collisions between ships and the bridge (Liu Citation2011). The natural conditions of the waters in this area are detailed in the literature (Lv Citation2007; Fang Citation2009), along with clear instructions regarding the layout of the navigational channel, navigational aids, and safety requirements for moving ships (Xu and Jin Citation2002; Zhejiang Citation2008; Jiaxing Citation2011; Zhou Citation2015). As the referenced literature provides all relevant details on this area, these details will not be repeated here. The specific area of interest in this research is shown in Figure .
Figure 4. Step-wise approach to risk evaluation of NNEt by using the RCM.
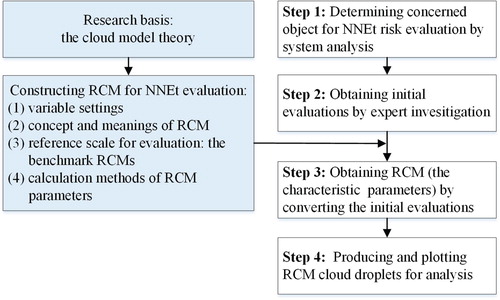
Figure 5. The specific area of interest.
5.2. Step 1: selecting objects of interest: the system factors used in the analysis
As mentioned above, there are many elements that constitute NNEt. As this is a preliminary study, only some of the listed factors are of interest here. As per the project plan, nine essential factors belonging to three categories in the NNEt are selected for analysis and are listed in Table .
Table 5. System analysis and the concerned object.
5.3. Step 2: obtaining initial evaluations: original data collection
After consulting maritime experts, ship crew members, port departments, shipping companies, and other maritime security departments, a total of 20 expert questionnaires are collected that contain initial evaluations of the selected factors (Zhou Citation2015). The original data representing initial evaluations are listed in Table .
Table 6. The initial qualitative risk evaluation of the concerned objects by 20 experts.
5.4. Step 3: achieving the applicable RCMs
The obtained 20 sets of original data include the initial qualitative risk evaluations provided by experts, and then are utilised to verify the efficacy of the proposed model and accompanying steps. Next, the transformation method in Equation (1) is employed to convert those initial evaluations to individual RCMs. Then, the weights of all the experts are set to before the individual RCMs corresponding to the 20 experts are synthesised using Equation (4). Finally, the three parameters describing a final RCM are obtained. The final RCMs of the objects of interest are shown in Table .
Table 7. Final RCM of the concerned object.
5.5. Step 4: plotting cloud droplets, result analysis, and discussion
After obtaining the RCMs shown in Table , 1000 droplets of each RCM are produced using the one-dimensional forward normal cloud generator algorithm. Then, the droplets of the corresponding RCMs are plotted in a plane rectangular coordinate system, as shown in Figures –.
Figure 6. RCM appearance of the object ‘Wind’.
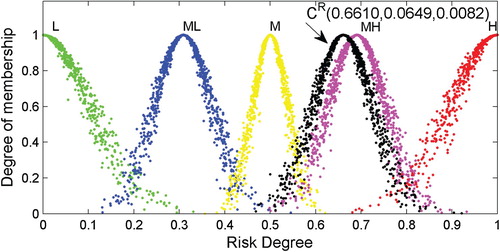
Figure 7. RCM appearance of the object ‘Current’.
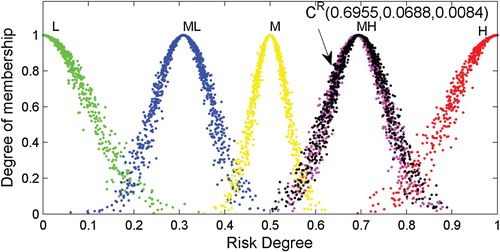
Figure 8. RCM appearance of the object ‘Fog and visibility’.
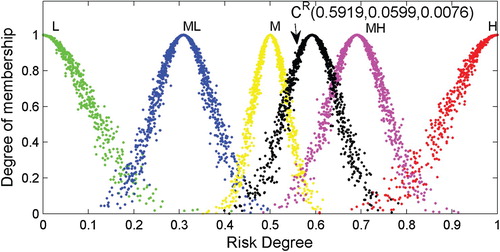
Figure 9. RCM appearance of the object ‘Channel width’.
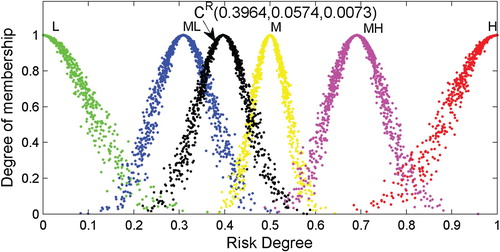
Figure 10. RCM appearance of the object ‘Channel water depth’.
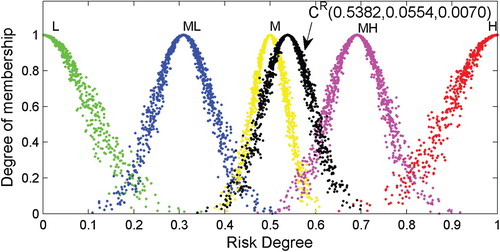
Figure 11. RCM appearance of the object ‘Shipping route cross’.
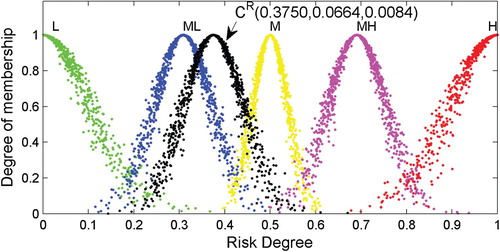
Figure 12. RCM appearance of the object ‘Ship traffic flow volume’.
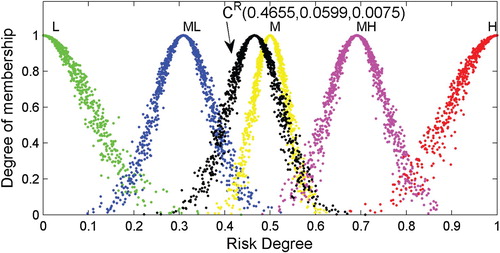
Figure 13. RCM appearance of the object ‘Obstacles to navigation’.
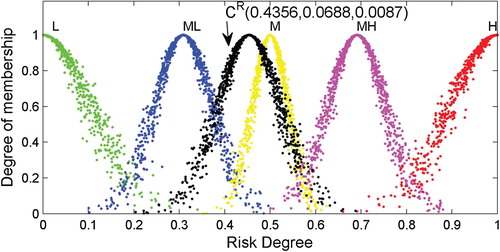
Figure 14. RCM appearance of the object ‘Navigational aids’.
As shown, the appearances of the RCMs are realised through the application of the proposed step-wise method to the data. In this way, a comprehensive risk evaluation of a particular object can be made based on an RCM. Generally, the expected value () depicts the ‘central tendency’ of the judgement of experts, while the discrete extent of the cloud droplets determined by the entropy (
) and hyper entropy (
) reflects the ‘uncertainty’ in the evaluation process and results.
As an example, consider the RCM for evaluating the object ‘Wind’. In a quantitative evaluation: (1) the expected value
denotes the expectation of
, and 0.6610 is the best sample to quantitatively indicate the risk level; (2) the entropy
denotes uncertainty measure of quantitative evaluation and reflects the stochastic characteristics of
, that
has a general distribution from 0.5 to 0.8, as shown in Figure ; (3) as a measure of uncertainty, the hyper entropy
indicates that the degree of membership of
(
) includes a certain amount of fluctuation in order to determine the thickness of the cloud, and the value
indicates that the RCM of ‘Wind’ has a similar thickness as the 2nd or 4th benchmark cloud (CML or CMH, whose hyper entropy is 0.008). Compared with benchmark clouds, the thickness of the RCM can be seen in Figure . Based on locations of cloud droplets in Figure , it can be seen that the RCM
is much closer to CMH. Thus, an intuitive expression ‘slightly lower than ML’ is valid in terms of a qualitative evaluation.
Quantitative and qualitative evaluations of specific objects of interest can be developed based on the appearances of the RCMs and droplets, which are similar to the analysis of the object ‘Wind’.
A comparison with the fuzzy theory-based approach is implemented to demonstrate the relative advantages of the proposed RCM-based method. In literature (Zhou Citation2015), fuzzy theory is applied to the construction of a model in order to determine the risk evaluation results for a particular object. In this approach, the degree of membership () to a qualitative term, the typical value (
) of a qualitative term and a defuzzification based on weighted average are employed to realise the final quantitative evaluation. For a particular object, the evaluation model based on fuzzy theory is:
(5)
(5)
where
is the fuzzy theory-based quantitative evaluation of risk degree;
represents the
benchmark linguistic term used for evaluation;
is the typical value of
;
is the degree of membership to
.
From the reference scale, the expectation of benchmark RCM (
) is used as the typical value of
:
. And, according to literature (Zhou Citation2015),
is calculated by using fuzzy statistics after obtaining the initial evaluations (Table ). Then applying Equation (5), the results of quantitative evaluation based on fuzzy theory are listed in Table .
Table 8. Quantitative evaluation based on fuzzy theory.
When the contents of Table are compared with those of Table , it can be seen that a fuzzy theory-based evaluation is only able to provide a single parameter for risk evaluation. Although it does provide the most likely qualitative value, which is consistent with the expected value () of an RCM, in terms of the ‘central tendency’ of a qualitative evaluation, the evaluation based on the fuzzy theory is unable to represent some of the uncertainty characteristics, such as randomness and fuzziness, while those uncertainties can be expressed by the entropy (
) and hyper entropy (
) of the RCM-based approach. In addition, plots of the RCM droplets, as in Figures –, are capable of intuitively indicating the risk level and are therefore beneficial when analysing the results.
6. Conclusion
In this paper, cloud model theory is introduced and the normal cloud model is employed as a tool for reciprocal transformation between qualitative and quantitative concepts. This background is used to propose a model for risk evaluation of NNEt, which includes the concept of an RCM and a method for calculating the associated characteristic parameters. A step-wise approach is presented for realising the risk evaluation of NNEt using RCM. The proposed method is then validated by way of a case study on the risk evaluation of NNEt of the waters around Hangzhou Bay Sea-Crossing Bridge, where it achieves the RCMs for evaluating nine objects of interest in the NNEt with regard to uncertainty. The work will add to the body of knowledge in this area, and thereby strengthen the foundation for future research.
A comparison is implemented in the case study to further demonstrate the relative advantages of the proposed RCM-based method. On the whole, the advantages of the proposed method for risk evaluation are as follows:
the proposed method performs evaluation by using the concept of multi-attribute decision-making (MADM) under uncertain information. For example, the evaluation process uses fuzzy information when an expert delivers his qualitative judgment, makes full use of random information when many experts independently express their views, and integrates individual comments to generate a comprehensive result;
RCM represents a better mode for risk evaluation, both quantitative and qualitative evaluations can be approached using risk cloud. The characteristic parameters of the comprehensive risk cloud can be used for quantitative evaluation, while the comprehensive risk cloud corresponds to some linguistic comment, which is located in the blanks among the five initial linguistic comments, for qualitative evaluation;
it is able to reflect ‘uncertainty’ while decision-making: risk evaluation. Risk evaluation by using RCM integrates fuzziness and randomness without losing knowledge-based information, and the result not only embodies the tendency of people’s judgments but also reflects the diversity of judgments. With an RCM, the expected value (
) depicts the ‘central tendency’ of experts’ judgments, and entropy (
Acknowledgements
Heartfelt appreciates are given to Mr Zhiyu ZHOU and Mr Yuhong RUN from Jiaxing Maritime Safety Adminstration of the People’s Republic of China for their conducting investigation, consulting experts, collecting the questionnaires, performing initial statistics and sharing their experiential knowledge. Sincere appreciates are delivered to scholars of the references for their outstanding contributions, and to the reviewers and editors for their helpful comments and suggestions.
Disclosure statement
No potential conflict of interest was reported by the authors.
Additional information
Funding
References
- Abramowicz-Gerigk T, Burciu Z. 2014. Safety assessment of maritime transport-Bayesian risk-based approach in different fields of maritime transport. Developments in maritime transportation and exploitation of sea resources. Vol. 2 – Proceedings of 15th International Congress of the International Maritime Association of the Mediterranean (IMAM 2013); A Coruna, Spain. p. 699–703.
- Akyuz E, Celik E. 2018. The role of human factor in maritime environment risk assessment: A practical application on ballast water treatment (BWT) system in ship. Hum Ecol Risk Assess. 24(3):653–666.
- Balmat JF, Lafont F, Maifret R, Pessel N. 2009. MAritime RISk Assessment (MARISA), a fuzzy approach to define an individual ship risk factor. Ocean Eng. 36(15):1278–1286.
- Cao AX, Bao XX, Ren XB. 2017. Safety assessment of an aging offshore jacket platform by integrating analytic hierarchy process and grey clustering method. J Ship Mech. 21(3):339–351.
- Cao L, Liu Z, Zhang S. 2014. Research of quantitative marine individual risk model based on probability theory. Proceedings of 2014 5th International Conference on Intelligent Systems Design and Engineering Applications (ISDEA 2014); Jun 15–16; Zhangjiajie, China. p. 781–784.
- Chen CH, Jiao ZL, Jiang FC. 2013a. Navigational environmental risk evaluation of breakwater based on the analytic hierarchy process. Adv Mat Res. 779-780:1648–1653.
- Chen H, Liu BS, Weng GL. 2013b. Comprehensive risk assessment of shipping environment in Luoyuan Bay. Navigation of China. 36(4):86–91.
- Chen HZ, Yang LB, Wang SW, Yan XP. 2010. High-risk waters identification and evaluation in China coasts. J Dalian Maritime Univ. 36(2):42–46.
- Di KC, Li DR, Li DY. 1999. The cloud theory application in spatial data mining and knowledge discovery. J Image Graph. 4(11):929–935.
- Du XY, Yin QJ, Huang KL, Liang DN. 2008. Qualitative quantitative transformation method and application based on cloud model. Eng System Electr. 30(4):772–776.
- Fang MS. 2009. New ideas on Hangzhou Bay sea-crossing bridge against wind, anti-collision with ship and anti-corrosion. Proceedings of 2009 academic forum on durability of bridge and earthquake disaster reduction; May 12–13; Fuzhou, China. p. 16–22.
- Hu SP, Fang QG, Zhang JP. 2010. The coastal water traffic safety risk assessment studies. Navigation of China. 33(1):50–55.
- Hu SP, Huang CH, Zhang H. 2012. Cloud model-based simulation of system risk of marine traffic by Monte Carlo algorithm. China Safety Sci J. 22(4):20–26.
- Jiaxing MSA. 2011. Supervision and management rules of Jiaxing vessel traffic system.
- Khan B, Khan F, Veitch B, Yang M. 2018. An operational risk analysis tool to analyze marine transportation in Arctic waters. Reliab Eng Syst Safe. 169:485–502.
- Kobylinski L. 2009. Risk analysis and human factor in prevention of CRG casualties. Int J Marine Navig Safe Sea Trans. 3(4):443–448.
- Li DY, Cheung D, Shi X, Ng V. 1998. Uncertainty reasoning based on cloud models in controllers. Comput Math Appl. 35(3):99–123.
- Li DY, Liu CY. 2004. The universality of normal cloud. Chinese Eng Sci. 6(8):28–34.
- Li DY, Meng HJ, Shi XM. 1995. Membership cloud and cloud generator. Comput Res Dev. 32(6):16–18.
- Lv HJ, Wang Y, Li DY, Liu CY. 2003. The application of reverse cloud in the qualitative evaluation. Chin J Comput. 26(8):1009–1014.
- Liu HQ. 2011. Collision risk analysis of ship against Hangzhou Bay sea-crossing bridge. China Maritime Safety. (9):48–51.
- Lu F, Li W, Zhang H. 2015. Safety assessment of ship anchoring based on the extenics. J Dalian Maritime Univ. 41(1):10–14.
- Lv ZD. 2007. Research on the key technologies and their implementation for Hangzhou Bay sea-crossing bridge. Xi’an: Chang'an University.
- Mabrouki C, Bentaleb F, Mousrij A. 2014. A decision support methodology for risk management within a port terminal. Saf Sci. 63:124–132.
- Mokhtari K, Ren J, Roberts C, Wang J. 2011. Application of a generic bow-tie based risk analysis framework on risk management of sea ports and offshore terminals. J Hazard Mater. 192(2):465–475.
- Mokhtari K, Ren J, Roberts C, Wang J. 2012. Decision support framework for risk management on sea ports and terminals using fuzzy set theory and evidential reasoning approach. Expert Syst Appl. 39(5):5087–5103.
- Pak J, Yeo G, Oh S, Yang Z. 2015. Port safety evaluation from a captain’s perspective: the Korean experience. Saf Sci. 72:172–181.
- Ren SY. 2010. Evaluation of ship traffic control safety based on analytic hierarchy process. Proceedings of the 2010 International Conference on Intelligent Computation Technology and Automation; May 11–12; Changsha, China. p. 237–240.
- Riahi R, Robertson I, Bonsall S, Jenkinson I, Wang J. 2013. A proposed methodology for assessing the reduction of a seafarer's performance with insufficient recuperative rest. J Marine Eng Technol. 12(2):11–28.
- Sahin B, Kum S. 2015. Risk assessment of Arctic navigation by using improved fuzzy-AHP approach. Int J Maritime Eng. 157(4):241–250.
- Sidek ARM, Prusty BG, Ray T. 2008. Determination of ship grounding and accident scenarios of a geographical area using risk analysis. Royal Institution of Naval Architects – International Maritime Conference, Pacific; Jan 29–31; Sydney, NSW, Australia. p. 249–258.
- Sii HS, Ruxton T, Wang J. 2001. A fuzzy-logic-based approach to qualitative safety modelling for marine systems. Reliab Eng Syst Saf. 73(1):19–34.
- Sun C, Nie DR, Zhang JP, Hu SP. 2012. Risk assessment of navigation environment of Waigaoqiao waters. Navigation of China. 35(2):68–71.
- Tian Y, Sun X, Chen L, Huang L. 2017. Risk assessment of nautical navigational environment based on grey fixed weight cluster. Promet Traffic Transport. 29(3):331–342.
- Tian YF, Huang LW. 2015. Risk evaluation of navigation environment of Yingongzhou channel based on single dimensional normal cloud model. Advances in Civil Engineering and Building Materials IV-Selected and Peer Reviewed Papers from the 2014 4th International Conference on Civil Engineering and Building Materials; Nov 15–16; Hong Kong, China. p. 137–140.
- Tseng KC, Hwang CS, Su YC. 2011. Using cloud model for default voting in collaborative filtering. J Converg Inf Technol. 6:68–74.
- Ventikos NP, Stavrou DI, Andritsopoulos A. 2017. Studying the marine accidents of the Aegean Sea: critical review, analysis and results. J Marine Eng Technol. 16(3):103–113.
- Wang HL, Feng YQ. 2005. The scale judgment matrix's improvement analytical method based on cloud model. Chinese J Manag Sci. 13:32–37.
- Wang J, Xiao WJ, Wang SW. 2010. An improved effectiveness evaluation method based on cloud model. Fire Control Command Control. 35(3):97–99.
- Wang JQ, Liu T. 2012. Uncertain language evaluation based on comprehensive cloud. Control Decis. 27(8):185–190.
- Wang JS, Li MC, Liu YX, Zhang HX, Zou W, Cheng L. 2014. Safety assessment of shipping routes in the South China Sea based on the fuzzy analytic hierarchy process. Saf Sci. 62:46–57.
- Wu QY, Fu YH, Jin YL. 2012. Test of anti-collision from a ship for the unnavigable section of Hangzhou Bay sea-crossing bridge. High Way. (4):128–133.
- Xie LJ, Chen Q. 2012. Aggregation operator selection in fuzzy comprehensive evaluation. Sci Technol Assoc Forum. (9):103–104.
- Xu J, Jin YL. 2002. Evaluation of navigation headroom and breadth limit of south sea-route of the Hangzhou Bay major bridge. Donghai Marine Sci. 20(4):42–49.
- Xuan SY, Li FM, Hu SP, Xi YT. 2013. The ship navigation risk assessment in Guangzhou port waters. Navigation of China. 36(4):96–99.
- Yang XJ, Yan LL, Zeng L. 2013. How to handle uncertainties in AHP: the cloud Delphi hierarchical analysis. Inf Sci (Ny). 222:384–404.
- Yang ZL, Wang J, Bonsall S, Fang QG. 2009. Use of fuzzy evidential reasoning in maritime security assessment. Risk Anal. 29(1):95–120.
- Yong LQ. 2011. A cloud-based model of multi-attribute decision making. Advances in Artificial Intelligence – Proceedings of 2011 International Conference on Management Science and Engineering; Sept 13–15; Rome, Italy. p. 438–444.
- Zhang D, Yan X, Zhang J, Yang Z, Wang J. 2016a. Use of fuzzy rule-based evidential reasoning approach in the navigational risk assessment of inland waterway transportation systems. Saf Sci. 82:352–360.
- Zhang J, Teixeira AP, Guedes Soares C, Yan X, Liu K. 2016b. Maritime transportation risk assessment of Tianjin port with Bayesian belief networks. Risk Anal. 36(6):1171–1187.
- Zhang XH, Liu ZJ, Jia CY. 2010a. A novel marine traffic safety assessment based on cloud models. Proceedings of the Second International Workshop on Education Technology and Computer Science; Mar 6–7; Wuhan, China. p. 60–63.
- Zhang XH, Liu ZJ, Wu ZL. 2010b. Cloud model based comprehensive evaluation of seafarers’ competency. Navigation of China. 33(4):65–70.
- Zhejiang MSA. 2008. Navigation safety management regulations for Hangzhou Bay sea-crossing bridge area (trial). Hangzhou: Zhejiang Maritime Safety Administration.
- Zhou ZY. 2015. Research on the safety assessment and countermeasures of Hangzhou Bay bridge navigation environment. Dalian: Dalian Maritime University.
- Zhu M, Wen YQ, Xiao CS, Hu QB. 2013. Comprehensive evaluation of LNG ship’s traffic adaptability based on cloud model. J Wuhan Univ Technol. 35(7):63–68.