
 ?Mathematical formulae have been encoded as MathML and are displayed in this HTML version using MathJax in order to improve their display. Uncheck the box to turn MathJax off. This feature requires Javascript. Click on a formula to zoom.
ABSTRACT
Suez Canal is one of the shortest navigational routes between east and west. Vessels that transit the Canal should normally save distance, time and operating cost. During the current economic recession and low fuel prices, longer shipping routes may be chosen to avoid the Canal transit fees. Harsh weather conditions may be encountered along these lengthy routes resulting in higher stresses and structural fatigue damage on ship’s hull, which would impact structural safety and affects the cost of ship maintenance. This paper quantifies ship structural fatigue damage along the routes: Suez Canal transit versus the Cape of Good Hope. Several voyages of an Aframax tanker along these routes are selected and evaluated for fatigue damage using a route-specific spectral fatigue damage assessment approach. Fatigue accumulation during the tanker lifetime, for each trade route, is computed as the sum of all the encountered sea states having caused fatigue damage along that route. Results are presented as fatigue damage and fatigue life for each trade route. Results show that in addition to saving in distance and time, less accumulated fatigue is achieved along the Suez Canal route.
1. Introduction
Shipping companies normally choose to trade along navigating route among available alternatives based on mostly economic aspects, i.e. minimum distance, operating costs and cargo availability. However, along a voyage, a ship would be subject to external weather influences, e.g. sea waves, winds and currents. Sea waves are major external loads that create stresses on a ship’s hull, as a result of mainly vertical wave bending moments. Many service stations forecast weather and many computer programs help ship operators by continues evaluation of minimum time tracks for common trade routes. These programs predict and compute a ship’s speed, time of arrival, fuel consumption and stresses in sea and port conditions based on many different alternatives of each trip, and for every month of the year. Fatigue damage is not commonly used in voyage planning and calculations that may be embedded in voyage planning.
For international trade ships, normally fatigue assessment design life is assumed not to be less than 20 years. The accumulated fatigue damage is not supposed to exceed the value of 1.0 (Beghin, Citation2006). However, early cracks may appear in a relatively newly built ship, for example, some oil tankers operated along routes of Alaska were subject of investigation and research. This research exhibited a large number of structural fatigue cracks, which were attributed to the increased use of high strength steel in increasingly large size tankers and for the severe weather they face in the Gulf of Alaska. Most of these studies concentrated on the reduction of operating cost and risks involved with their operation including fatigue risk (Tuohan, et al., Citation2012). Therefore, the response of a ship to waves needs to be calculated per voyaging operating condition.
1.1. Cape of Good Hope
The Cape of Good Hope is one of the main competitors to the Suez Canal that witnessed increased traffic during the current petroleum market recession and low bunker prices (Eldaly, Citation2017). Panama Canal and the Arctic Northern Sea Routes are other alternatives, less in priority, that are left for other research projects. For slow steaming contracts, we assumed reduction of fuel consumption of 35 Ton/day. Table illustrates the example of an Aframax tanker in trips of comparison, one along the Suez Canal route and the other is around the Cape, which shows a saving of more than $96,000 for the Cape route during economic recession and as per the prices of bunker prices, given in Figure . The assumption in Table is based on and restricted to the available data that were used in this research.
Figure 1. Yearly average of bunker market prices 2007–2017.
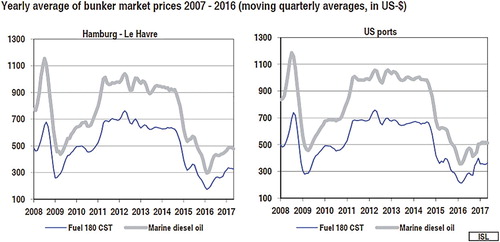
Table 1. Cost comparison as per route option for the Aframax tanker.
However, the Suez Canal saves, as shown in Table , about 42% of sailing distance from the Arab/Persian Gulf region to Europe and almost 30% of the steaming distance to the USA. Normally, ships above the Suezmax size are employed along the Cape route for Suez Canal depth restriction, if not to be lightered in SUMID petroleum line between South-Suez and West-Alexandria in Egypt, but ironically during economic recessions other less in-depth ships are employed for the same lengthy route for saving cost for the reduced bunker price. Table shows 4 voyages of assumptions and estimated time of sailing on 15 kt., i.e. the slow steaming speed of a selected Aframax tanker targeted by this research.
Table 2. Steaming time on assumed 4 voyages.
Bunker prices have reached a low value in March 2016, i.e. around $300 and recently increased to below $500 (ISL, Citation2017). In addition, freights and hire rates for tankers have reached a significant reduction as well in March 2016 (ISL, Citation2016). Consequently, oil transport market has undergone some incredible changes. The significant drop in petroleum prices increased the demand for tonnage as buyers of cheap oil took the opportunity to stockpile (DNV-GL, Citation2016). As a result, large tankers may be operated around the Cape of Good Hope when transiting oil from the Gulf region to Europe and East coast of North America perhaps in round voyages. Container ships as well may slow steam the same lengthy route; Suezmax and even Aframax tankers that can pass the Canal in loaded condition may be employed along this lengthy route to avoid the Canal fees (U.S. Department of Transport, Citation2013). During economic recessions (2009–2011), some companies such as A.P. Moller-Maersk, CMA CGM and the Kuwait National Petroleum Company moved part of their traffic to the Cape of Good Hope. As traffic through the Canal depends on the dynamics linked to oil prices trend; slow steam is followed by ships around Africa during low bunker prices era (Energy Information Administration, Citation2014).
Normally a ship owner would benefit more for lengthy voyages under time charter parties as the ship is hired for more periods of time and under such contracts, charterers pay for bunker. On the other hand, charterers are to benefit more for avoiding the Suez Canal relatively high transit fees, avoiding guarding cost in piracy regions, e.g. Somalia and for low bunker consumption with slow steam (Eldaly, Citation2017).
SUEZMAX (∼200,000 dwt) and even AFRAMAX (∼119,999 dwt) tankers (U.S. Department of Transport, Citation2013) that can pass the Canal in loaded condition may be employed along this lengthy route to avoid the Canal fees. Again in 2015–2017 some oil majors and container tycoons moved part of their traffic to the Cape of Good Hope. As traffic through the Canal also depends on the dynamics linked to the oil price trend; what is so-called slow steam is followed by shipping companies around Africa during low bunker prices (U.S. Energy Information Administration, Citation2014).
Security attacks in Somalian coast against ships are adding another commercial and operational burden to ships passing Suez Canal. However, data suggest a decrease in the number of piracy incidents in recent years. At least in 2012, the phenomenon has yielded a burden of $63.5 million in ransoms and associated fees. Guarding costs about 3000–5000 USD per trip per single voyage. Additionally, costs have also been borne at large through heightened insurance premiums (Shelala, Citation2014).
Consequently, the Cape of Good Hope is targeted by this research for many relevant reasons, e.g.:
Current petroleum prices, and low bunker prices, as shown in Figure ; bunker prices are around the $300US in 2016, however, it recovered a bit in 2017 but still below average (ISL, Citation2017) i.e. a benefit for the Cape route.
Security guarding cost, in choke point along the route of Bab Elmandab, i.e. increases voyaging cost.
Relatively high Suez Canal fees,
Low freight rates and hire money, as shown in Figure .
Figure 2. Time Charter rates for the Aframax tanker.
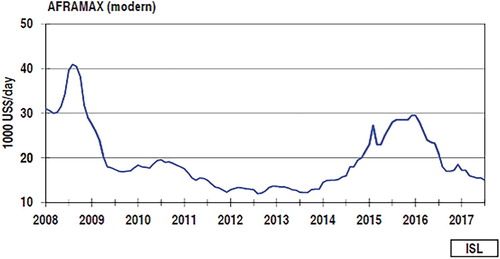
Figure shows the latest time charter rates for Aframax tankers, subject of this research, for the period 2014–2017, where the least average (<$16,000) come for the year 2017 that was dropped from $30,000 in 2016, i.e. almost the half.
Hire money of time charter parties witnessed reduction during current economic recession that is adding other commercial burdens to ship operators. Table shows the reduction in time charter rates for all types of tankers over the period 2016 and 2017. Suezmax size saw the highest change over the previous year (−33.3%), then comes the Aframax with the second loss of −28.6%, which reflects the less demand for these particular sizes of tankers compared to the VLCCs and product carriers which saw reduction of only −19.1% and −25.0%, respectively. All of tankers, particularly Suezmax and Aframax sizes suffer recession that leaded owners to send ships for longer voyages around the Cape (ISL, Citation2017).
Table 3. Reduction in time charter rates for all types of tankers (2016–2017).
2. Fatigue damage along a ship route
Service performance has shown that fatigue strength is one of the major concerns in the structural performance of modern tankers (Beghin, Citation2006).
Fatigue strength determines the lifetime for a tanker (Nguyen, et al., Citation2010). Nguyen et al. (Citation2012, Citation2013) investigated the applicability of spectral methods for the estimation of fatigue damage to a tanker’s main deck longitudinal stiffener during a voyage considering time-dependent corrosion. Moreover, Yingguang (Citation2010) calculated fatigue life of a dredging barge’s structural detail by using a spectral approach and compared it with the results of IACS R 56. Furthermore, Wengang et al. (Citation2010) estimated the fatigue accumulated fatigue damage of a container ship during a voyage using a simple fatigue estimation model.
Additionally, Wengang et al. (Citation2012) presented theoretical development and validation of a fatigue model that is useful for ship routing for better utilisation of the materials and structures by wise operation of ship. They concluded that fatigue damage could be decreased by 50% if awareness and knowledge of fatigue in ship route planning are employed. Furthermore, Wengang et al. (Citation2012) and Bitner-Gregersen et al. (Citation1995) numerically evaluated fatigue damage for different ship routes using the Global Wave Statics (GWS) data. They tabulated an Aframax tanker response for different routes and different ocean areas. Finally, Bitner-Gregersen et al. (Citation1995) used spectral fatigue to examine the effect of different stiffener types on hull girder strength and consequently fatigue life in the Aframax tanker. On the other hand, Abd El-Kader (Citation2012) and Badran & Abd El-Kader (Citation2012) used the same approach of spectral fatigue assessment but on a beam theory of the overall midship section of an Aframax tanker operated in the red sea.
3. Case study
The ship analysed in this study is an existing Aframax double hull tanker in operation. The main particulars of the Aframax tanker are presented in Table .
Table 4. Main particulars of the selected Aframax tanker.
This research investigates a double hull tanker voyaging for its lifetime (25 years) along four routes of assumptions. Voyaging is expected to be 85% of the lifetime in both of the full and ballast loading conditions, as per the IACS common structure rules (CSR) (IACS, Citation2014). The 15% remaining time is assumed to be spent in port operations for loading and discharging or under maintenance and repair.
Fatigue damage for a structural detail in the midship section is calculated along the four routes in different loading conditions, full load and ballast load, by using a route-specific spectral fatigue damage approach.
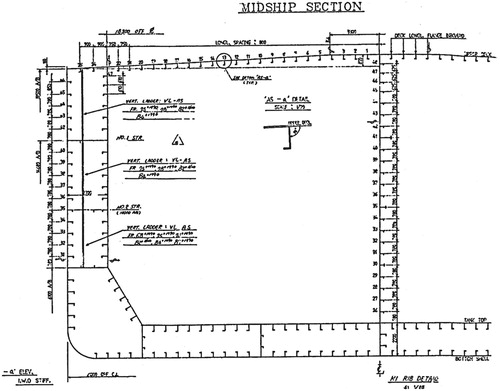
The structural detail considered in this study is a main deck flat bulb FB longitudinal stiffener in an Aframax midship section. The Response Amplitude Operator (RAO) of the vertical wave bending moment at the midship section RAOM, V for ballast and full load condition is first obtained by using seakeeping analysis based on transfer function and the IACS CSR. RAOs were obtained for 9-wave encounter angles (0–180° with step of 22.5°) for ballast and loaded conditions. For the purpose of relative comparison of fatigue damage for different routes, particularly if overall lifetime of a ship is considered a speed reduction of 15 KT is seen suitable as an average (Kwon, Citation1981; IMO, Citation2009).
In this research, the stress due to the vertical wave bending moment is considered the most dominant stress affecting the fatigue life of the selected structural detail. Fatigue contributions from horizontal bending or torsion are not considered in this paper. As the determination of the torsional response as well as the horizontal bending response of the hull are generally required in large deck opening ships, e.g. dry bulk (DNV, Citation2014). Whipping and springing calculations may be necessary for large container vessel (Barhoumi & Storhaug, Citation2014) but are not used in our case scenario. Figure shows details of the selected midship section. The circled deck longitudinal stiffener is chosen for fatigue calculation that is marked $1 and comes with the dimensions as follows: 125 × 12 FB.
Figure 3. Midship section of the selected Aframax tanker with the selected FB in circle.
4. Encountered sea states along each route
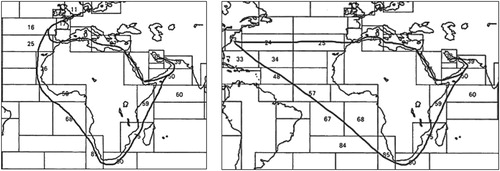
The Global Wave Statistics (GWS) data provide nearly worldwide coverage of wave climate in 104 sea areas. Based on 130 years of ship visual observations, and quality enhanced data; they provide a stable climatic average (BMT, Citation1986). A route-specific wave scatter diagram is constructed for each of the voyages considered in this study. The scatter diagram for the Gulf Region to Europe trading route, using Suez Canal, was obtained by combining wave zones (or sea areas) 11, 16, 17, 25, 26, 27, 37, 38, 39 and 50 from GWS. The scatter diagram for the Gulf Region to Europe trading route, using Cape of Good Hope, was obtained by combining wave zones 11, 16, 17, 25, 36, 38, 39, 50, 58, 59, 60, 68, 69, 75, 84, 85 and 90. The scatter diagram for the Gulf Region to the USA using Suez Canal was obtained by combining wave zones 23, 24, 25, 26, 27, 37, 38, 39 and 50. The scatter diagram for the Gulf Region to the USA using Cape of Good Hope was obtained by combining wave zones 23, 24, 33, 34, 38, 39, 48, 50, 56, 57, 59, 60, 67, 68, 69, 75, 84, 85 and 90.
The number of observations, , in each cell, of the combined wave scatter diagram is obtained as:
(1)
(1)
where
is the combined number of observations,
is the number of observations in the ith sea area and
is the number of considered sea areas along the route.
Figure shows the tanker routing options from the Middle East to Europe and US trough Suez Canal and around Africa along the specific GWS sea areas.
Figure 4. Tanker routing options and GWS sailing areas: Gulf region to/from EU and USA.
5. Spectral fatigue analysis and research methodology
Fatigue life can be estimated by many approaches, e.g. finite element analysis (FEA), rainflow counting (RFC) and spectral analysis. FEA are sometimes used for hot spot stress assessment with potential fatigue cracking, on the other hand, RFC gives most accurate fatigue life prediction but it requires a time domain stress history. The spectral approach, adopted in this study, is fast in calculation and it conveniently relies on spectral information that is easier to obtain from limited data. Spectral fatigue analysis is based on S–N curves and Palmgren–Miner’s linear damage summation rule, i.e. Pierson–Moskwitz spectrum. The fatigue strength is described using the characteristic S–N curve.
(2)
(2)
where
is the fatigue strength exponent,
is the fatigue strength coefficient,
is number of cycles to failure and
is the constant amplitude stress range.
Palmgren–Miner rule is used, i.e. the total or cumulative fatigue damage D that can be obtained by the linear summation of the individual damage from all the considered stress range intervals. Damage is expressed mathematically by:
(3)
(3)
where
is the number of cycles a structure detail can withstand at stress range Si,
is the number of cycles to failure at stress range Si, as determined by the appropriate S–N curve, and
is the total number of stress range blocks (IACS, Citation2014).
According to IACS CSR (IACS, Citation2014), the cumulative fatigue damage ratio DM should always be less than 1, otherwise the fatigue capability of the structure is not acceptable, as follows:
(4)
(4)
is the cumulative fatigue damage ratio for the applicable loading condition,
= 1 for full load condition and 2 in ballast condition.
The cumulative fatigue damage for each relevant condition is taken as per the CSR (IACS, Citation2014).
Summation of the short-term damages over all the encountered sea states in a specific wave scatter diagram would result in defining the total fatigue damage of the selected structural element. Therefore, total fatigue damage ratio expression is given by
(5)
(5)
where
is the zero up-crossing period,
is the gamma function,
is the zero up-crossing frequency of the stress response in Hz,
is the total number of considered stress range intervals,
is the band width parameter for the ith considered sea state,
is the coefficient taking into accounts the change in the slope of the S–N curve,
is the probability of occurrence for individual sea state,
is the standard deviation,
is the fatigue strength exponent and
is the fatigue strength coefficient, where
and
where
is the area under response spectral curve,
is the second-order moment and
is the fourth moment under the spectral curve.
Once fatigue damage D is obtained, fatigue life can then be calculated by
(6)
(6)
Methodology: Along each route, the GWS specific tables were selected and then accumulation of all encountered sea waves, zero crossing periods and marginal probability was obtained. The output results were collected in a new accumulated table of each route. Spectral analyses, i.e. Pierson–Moskwitz spectrum, were done for each wave heading, 9-wave encounter angles, per each wave height and zero crossing period to obtain the fatigue damage. Summation of fatigue damage for each voyage per 2 loading conditions, i.e. full load and ballast load for 85% of the lifetime of the ship (IACS, Citation2014) the other 15% were left for dry docking and cargo operation, as per CSR. Corrosive and air environment were inserted in calculations.
Figure shows a flow chart diagram of the research methodology adopted in this research. Moreover, Table shows a sample of the resultant wave scatter diagram along one of the voyages, i.e. voyage 2 from the Gulf Region to Europe via Suez route. The highest joint probability of wave height and period depicts the wave zero crossing period class (Tz) for each wave height (Hs).
Figure 5. A flow chart diagram for the adopted route-specific spectral fatigue damage assessment approach.
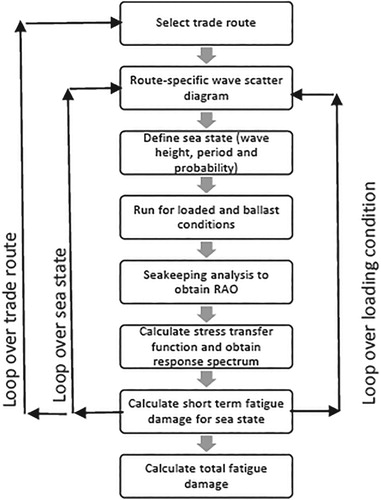
Table 5. Sample of resultant combined wave scatter diagrams marginal probability accumulation: Gulf Region to Europe using Suez Canal route.
6. Results and discussion
Fatigue damage for the tanker’s main deck longitudinal stiffener was calculated. Maxsurf Seekeeper Module version 16 was used for calculation. For each sea state in the wave scatter diagram, nine headings were considered from (0°–180°) at a 22.5° step, i.e. 0°, 22.5°, 45°, 67.5°, 90°, 112.5°, 135°, 157.5° and 180°. RAOs were obtained for the nine headings from the tanker’s data. Thus, the total number of runs for each route is: (number of loading conditions) × (number of sea states) × (number of headings) = 2×((15 × 3) + 12) × 9 = 1026 runs. For lifetime of the ship, it is assumed that there is an equal probability of vessel heading relative to the direction of the waves.
Results of the calculations of fatigue damage were plotted as shown in Figures and and illustrated fatigue damage for each heading angle (0°–180°), in loaded and ballast conditions along the 4 voyages of assumptions. Maximum values of fatigue damage were found along the 0° and 180° headings, however, in following seas particularly during ballast voyages the values of fatigue damage is witnessed to be higher than heading seas for the higher stern ship flare, and of course the least values witnessed in 90° heading.
Figure 6. Tanker fatigue damage/Gulf Region to Europe voyages.
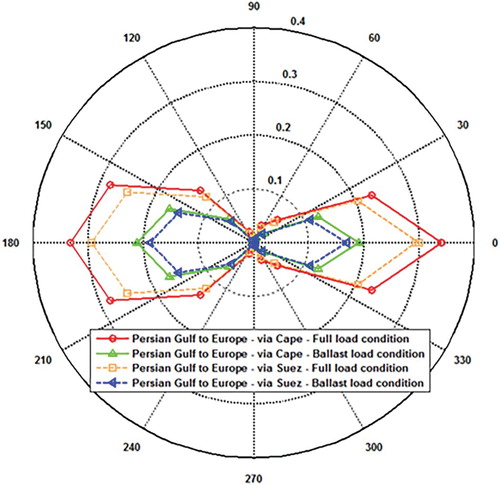
Figure 7. Tanker fatigue damage/Gulf Region to US voyages.
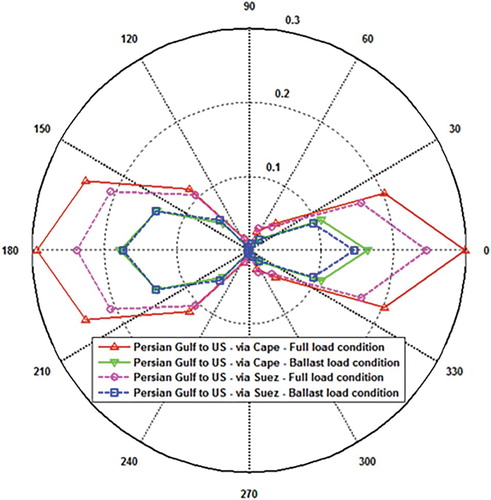
As per a simulation of the 4 round voyages, as shown in Table , voyages along Suez Canal were less in fatigue damage in all ballast and loading cases to both sides of destinations. Furthermore, the shorter distance via the Suez route resembles less fatigue in all cases of assumptions, however, in some cases the sea states were higher than the Cape route particularly in the north Atlantic Ocean in USA voyages. Along the voyages to Europe, Suez Canal route resembles value of 0.113 less than the Cape of Good Hope and it would increase the fatigue life of the ship by about 3.04 years. Meanwhile, the voyages to the USA were less in fatigue damage through Suez routes by 0.097 than the Cape, and higher in fatigue life by 3.324 years.
Table 6. Results of fatigue damage along the 4 voyages.
To sum up, it is easily recognised that Suez Canal routes resemble less fatigue damage than the Cape of Good Hope in both loaded and ballast voyages along all the studied routes, as for the less voyaging distance a ship would be less in exposure to fatigue-related factors. Meanwhile, the total fatigue damage is found for both destinations. In conclusion, a ship would be better utilised along the route of Suez Canal.
7. Conclusions
This research is an example for comparing the fatigue damage for alternative routes, that may be difficult to be used as a tool for decision making, on a case by case bases, yet it shows how a ship may suffer additional stresses and fatigue damage along high-wave seas, particularly for mass production transport of oil. This is because, for instance, vessels on tramp shipping, charterers are selecting the route and not the ships’ operators. Consequently, although all other factors as freight rates, bunker prices, cargo availability, inter alia, will play a role in their selection of route, the accumulation of fatigue damage will not really affect their decision and planning, yet fatigue calculation may be embedded in voyage planning.
On the other hand, particularly, in mass production transport, time savings and costs may be important for route selection; Suez Canal route provides saving in sailing distance of about 42% to Europe and 30% to the USA additionally it saves more than 11% of total fatigue damage in all cases for tankers originating from Middle East. An approach for a route-specific spectral fatigue damage assessment was developed in this work and applied for an Aframax tanker for the various trade routes. A route-specific combined wave scatter diagram was generated using data from GWS and used as input for spectral fatigue analysis. Fatigue accumulation in a structural detail during the tanker whole service period, for each trade route, was computed as the sum of all the encountered sea states that caused fatigue damage along that route.
Results of this study can be used by ship operators for selection of an optimum route that minimises fatigue damage. Suez Canal authority may benefit from claiming that using the canal is more convenient to ships’ hull. By minimising fatigue damage, structural safety would be improved and may positively affect the overall ships’ hull integrity.
Acknowledgement
Appreciation to Dr Tarek Elsayed, may the God bless his sole, gave all guidance and efforts for the success of this research. His support, enthusiastic encouragement and useful critiques helped in calculations of spectral fatigue. Moreover, special thanks to Captain Adel Eldaly, the operation manager of a tanker shipping company, for his support with full drawings of a current operating double hull tanker subject of this research.
Disclosure statement
No potential conflict of interest was reported by the authors.
ORCID
Mohamed Essallamy http://orcid.org/0000-0003-0588-790X
References
- Abd El-Kader M. 2012. Fatigue assessment of novel stiffened double hull tanker structures designed by IACS Common Structural Rules. MSc thesis. Alexandria: Alexandria University.
- Badran S, Abd El-Kader M. 2012. A new quantitative fatigue life assessment using alternative stiffened panels in midship section. Eur J Sci Res. 90(4):473–492.
- Barhoumi G, Storhaug M. 2014. Assessment of whipping and springing on a large container vessel. Int J Naval Archit Ocean Eng. 6(2):442–458. doi: 10.2478/IJNAOE-2013-0191
- Beghin D. 2006. Fatigue of ship structural details. s.l.: The Society of Naval Architects and Marine Engineers.
- Bitner-Gregersen EM, Cramer EH, Løseth R. 1995. Uncertainties of load characteristics and fatigue damage of ship structures. Mar Struct. 8(2):97–117. doi: 10.1016/0951-8339(94)00013-I
- BMT. 1986. Global wave statistics. London: British Maritime Technology, Unwin Brothers Limited.
- DNV. 2014. Fatigue assessment of ship structures: Classification note No. 30.7. Høvik: Det Vorske Veritas.
- DNV-GL. 2016. Tanker update. No. 1/2016. Høvik: DNV-GL.
- Eldaly A. 2017. Marine Operation Manager, Pyramid Navigation Company [Interview] (15 Dec. 2017).
- Energy Information Administration. 2014. Country analysis brief: Egypt. s.l.: Country Analysis Brief: Egypt.
- IACS. 2014. Common structural rules for bulk carriers and oil tankers. s.l.: International Association of Classification Societies [IACS].
- IMO. 2009. Second IMO GHG study. London: [IMO] International Maritime Organization.
- ISL. 2016. Shipping statistics and market review. Vol. 60, No. 1/2. Bremen: [ISL] Institute of Shipping economics and Logistics.
- ISL. 2017. Shipping statistics and market review. Vol. 61, No. 8. Bremen: [ISL] Institute of Shipping Economics and Logistics.
- Kwon Y-J. 1981. The effect of weather, particularly short Sea waves, on ship speed performance. Seoul: University of Newcastle.
- Nguyen K, Garbatov T, Guedes S. 2010. Spectral fatigue analysis of a ship structural detail – A practical case study. Int J Fatigue. 32(Feb):310–317.
- Nguyen K, Garbatov T, Guedes S. 2013. Spectral fatigue damage assessment of tanker deck structural detail subjected to time-dependent corrosion. Int J Fatigue. 48:147–155. doi: 10.1016/j.ijfatigue.2012.10.014
- Nguyen K, Garbatov Y, Soares G. 2012. Fatigue damage assessment of corroded oil tanker details based on global and local stress approaches. Int J Fatigue. 43:197–206. doi: 10.1016/j.ijfatigue.2012.04.004
- Sea Distances. 2018. Sea-Distances.Org. [accessed 2016 Jun 1]. https://sea-distances.org/.
- Shelala RM. 2014. Maritime security in the Middle East and north Africa: a strategic assessment. Washington, DC: Center for Stratigic & International Studies.
- Tuohan C, Jianli Z, Dong-Myung B. 2012. A rapid estimation method of structural fatigue analysis for a 17k Ton DWT oil tanker. 11:184–190.
- U.S. Department of Transport. 2013. Panama canal expansion study. Phase I Report: Developments in trade and national and global economies. Boston, MA: Economic Development Research Group, Inc.
- U.S. Energy Information Administration. 2014. World oil transit chokpoints. s.l.: U.S. Energy Information Administration.
- Wengang M, Ringsberg JW, Rychlik I. 2012. Application of a ship-routing fatigue model to case studies of 2800 and 4400 TEU container vessels. J Eng Mar Env. 226(3):222–234.
- Wengang M, Ringsberg JW, Rychlik I, Storhaug G. 2010. Development of a fatigue model useful in ship routing design. J Ship Res. 54(4):281–229.
- Yingguang W. 2010. Pectral fatigue analysis of a ship structural detail – a practical case study. Int J Fatigue. 32:310–317. doi: 10.1016/j.ijfatigue.2009.06.020