
 ?Mathematical formulae have been encoded as MathML and are displayed in this HTML version using MathJax in order to improve their display. Uncheck the box to turn MathJax off. This feature requires Javascript. Click on a formula to zoom.
Abstract
Pressure sensor used in marine hydrographic survey is an important device for the deep sea detection, the tsunami forecast and the marine engineering. Owing to its mature technology process and low production cost, silicon piezoresistive sensor is widely applied in the field of industrial pressure measurement. However, its temperature effect can result in non-negligible dynamic error, which cannot meet requirement of deep sea environment. The silicon-on-sapphire pressure sensor based on stress cup structure is presented. The output voltage values show a high deviation in the range of −6∼50°C due to temperature drift. In order to minimise this temperature effect, a temperature compensation algorithm is proposed to realise 0.03% accuracy in the full scale 60 MPa range. Compared with a reference commercial sensor in deep sea experiment, the test pressure sensors exhibit minor error, excellent similarity and coherence. This numerical method provides a new research direction for environmental self-adaptive sensor. It can be emphasised that this sensor will have a good application prospect in unattended long-term ocean observation system.
1. Introduction
Seawater pressure value supplies an equivalent spatial coordinate for the measurement of ocean parameters, and it is the most critical factor for ocean data comparison and detection (Drushka et al. Citation2014; Yara et al. Citation2014). As an important part of deep sea scientific exploration, high accuracy pressure measurement has become the focus of research. By using deep sea pressure sensor, fine pressure measurements have made on the seafloor to detect the vertical deformation of the submarine volcano (Chadwick et al. Citation2006). The high resolution pressure sensor installed on the seafloor can measure the pressure changes induced by the tsunami, which is useful for tsunami wave research (Rabinovich and Elé Citation2015). For the study of living deep-sea multicellular organisms, high accuracy pressure measurement is helpful to establish a stable hydrostatic pressure environment in a special aquarium system (Koyama et al. Citation2002). The pressure value plays an important role in the deep sea manned submersible, which provides the guarantee for the safe operation (Pan and Cui Citation2010). Pressure sensor is generally applied in marine monitoring integrated systems such as tsunami warning apparatus, water level gauge, tide gauge, CTD (Conductivity-Temperature-Depth) measurement instrument, surface buoy, underwater mobile platform and submarine observation networks (Laugere et al. Citation2002; Wood et al. Citation2004). With the development of ocean observation technology, high accuracy, low power consumption and miniaturised pressure sensor has attracted more and more attention (Dusek et al. Citation2013).
Silicon piezoresistive pressure sensor based on semiconductor silicon material has high sensitivity, quick response, low cost and mature preparation process, which is widely used in the field of industrial measurement (Chou et al. Citation2009; Niu et al. Citation2014). However, due to the temperature characteristic of semiconductor, there is a temperature drift on sensor’s sensitivity and accuracy, which restricts its application in deep sea large scale pressure measurement (Otmani et al. Citation2011; Guo et al. Citation2017). For reducing temperature influence, the fabrication process of semiconductor sensitive component should be optimised (Boukabache et al. Citation2000). On the other hand, a series of compensation methods, like adding some passive resistors, applying constant current source and using several P-N junctions have been reported also (Sun et al. Citation1997; Melvas and Stemme Citation2003; Sun et al. Citation2004). Nevertheless, the results from these compensation methods are still vulnerable to the change of external environment. Besides, low accuracy, high cost and non-compensation in real time are still disadvantages for these methods. The algorithm compensation method does not require additional requirements and components, just using data analysis and processing, it can obtain high accuracy and stable compensated results (Paniagua and Dénos Citation2002; Li et al. Citation2016). There are many neural network compensation algorithm methods to calibrate the nonlinear characteristics of pressure sensor (Pramanik et al. Citation2006; Guo et al. Citation2009). However, due to the long training time and complex data processing, these methods are not conducive to deep-sea engineering applications.
In order to meet the requirement of high accuracy pressure measurement in deep sea, the temperature characteristic of silicon-on-sapphire piezoresistive pressure sensor with a measuring range of 0∼60 MPa has been tested. According to these experimental data, a temperature compensation algorithm is investigated. The output voltage polynomial with multiple correction temperature coefficients is established to effectively eliminate the temperature drift of sensor. The pressure sensor with temperature compensation algorithm is verified by the practical deep sea experiment, which achieves the same excellent performance as the commercial sensor. It is concluded that this algorithm method can bring a lot of advantages (such as high accuracy, miniaturisation and intelligence) for deep sea pressure sensor, resulting in a broader application.
2. Experimental details
2.1. Silicon-on-sapphire pressure sensor
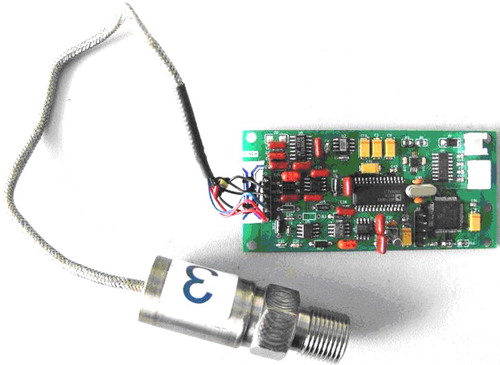
A high performance silicon piezoresistive pressure sensor should manifest good linearity, high sensitivity and sustained stability. It is very important to choose a reasonable design, including substrate material, sensitive structure and packaging technology. With similar structure and lattice constant as monocrystalline silicon (Molianen et al. Citation1994; Stuchebnikov Citation2005), the moncrystalline sapphire (α-Al2O3) is selected as substrate material. Meanwhile, the coefficient of thermal expansion of sapphire is close to titanium alloy, which is beneficial to marine sensor packaging. As shown in (a), the stress cup is designed as main sensitive structure. The pressure is exerted on the back of this stress cup for obtaining high response frequency. Considering the maximum 60 MPa pressure and high accuracy, the thickness of cup bottom and cup wall are chosen as 0.3 and 3 mm, respectively, in order to avoid the self-induced oscillation such as second harmonic. Furthermore, taking into account the external mechanical impact and vibration, the cup height and cup diameter should be fixed as 5 and 4 mm, respectively. (b) presents four silicon strain resistances are grown in the direction of monocrystalline silicon with the form of Wheatstone bridge. When the pressure is detected, this bridge has a relative output voltage. As a hexagonal crystal, the sapphire (α-Al2O3) has a very small toughness and a large rigidity. It is difficult to make molecular contact with cover material based on material deformation. The electrostatic packaging technology is applied to improve sensor firmness and reliability. After this packaging process, there is no inclusion between silicon-on-sapphire and titanium alloy (Campabadal et al. Citation2006). Using hydrogen treatment, grinding and polishing, the bonding surface can achieve excellent smoothness and flatness. And then, the electrostatic bonding operation is completed in high vacuum environment under 600°C temperature and 3000 V direct voltage (Uemoto et al. Citation2011). The amplification circuit and data acquisition circuit are connected to pressure sensitive structure and its output voltage value can be read directly by computer through RS232 communication serial port (as shown in ). In actual operation, the whole circuit board will be placed in a titanium alloy cylinder to against seawater pressure.
Figure 1. Main internal structure of pressure sensor (a) stress cup based on sapphire substrate and (b) diffusion pressure sensitive silicon resistor.
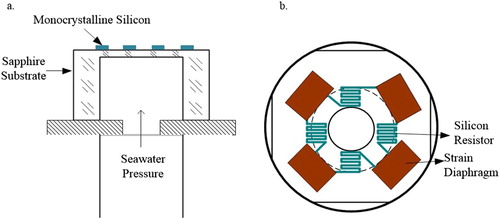
Figure 2. Pressure sensor and data processing circuit.
2.2. Temperature characteristic experiment
From sea surface to deep sea, there is a great change in temperature and pressure. Before pressure sensor work in a real background, it is necessary to know about its temperature characteristic in a simulated experimental environment. As shown in , this simulated pressure test system consists of a liquid pressure tank, a resistance heater, a pressure pump, an internal reference pressure gauge, an internal reference thermometer and a refrigerant fluid tank. When the experiment is performed, the sensor will be placed in the liquid pressure tank. The pressure pump is active to increase liquid pressure in this tank. The temperature change mainly depends on resistance heater and refrigerant fluid. With 0.005°C temperature accuracy and 0.01% pressure accuracy, the internal thermometer and pressure gauge are used as reference devices. The temperature and pressure reference equipments are calibrated regularly to ensure the standard operating accuracy. According to data from reference instruments, the entire standard pressure and temperature test environment is precisely set by Programmable Logic Controller-PLC cabinet. This simulated test system can make the regulation of temperature (from −6°C to 50°C) and pressure (from 0 to 60 MPa) simultaneously. Through the data cable, the corresponding curves are automatically displayed, which is very useful to find the rule of temperature characteristic on test sensor.
Figure 3. Simulated pressure test system.
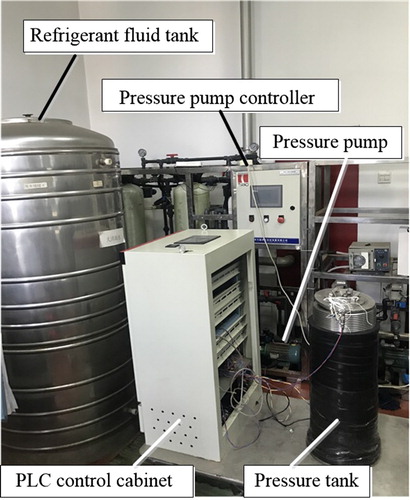
Figure 4. Output voltage of pressure sensor Vp at different standard temperatures for different standard pressures.
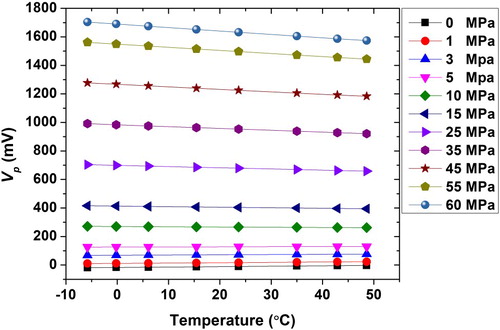
presents a series of output voltage values Vp under different pressures with the variation of temperature. It is found that Vp is not stable at the different temperatures, and its value is seriously affected by the temperature in high pressure range. Specifically, the output voltage under 60 MPa at 48.60°C is very close to the values under 55 MPa between −5.80°C and −0.20°C. This result can cause the pressure measurement data to confuse. Due to the low output voltage resolution, test sensor is not applicable in deep sea environment. Unlike high pressure range, the temperature effect is relatively small from 0 to 15 MPa, it is still difficult to achieve high accuracy measurement level.
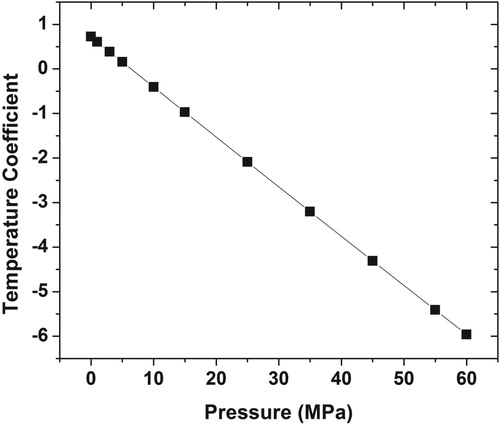
Furthermore, the slope of Vp as function of different temperatures under the fixed pressure values have been fitted. Considering that the temperature effect has been presented by these slopes, the temperature coefficients based on fitted slops are shown in . It is observed that a linear relation between temperature coefficient and pressure. In low pressure range, temperature coefficient is positive, and it becomes negative with the increase of pressure. For 5 MPa pressure, the temperature has minimal effect on the sensor. Moreover, the maximum temperature coefficient is found under 60 MPa pressure, which can confirm the above obtained inference in . In the following discussion, a new temperature compensation algorithm will be introduced to reduce the temperature effect.
Figure 5. Temperature coefficient as function of pressure values.
3. Temperature compensation algorithm
Unlike the other relative complex methods, the temperature compensation algorithm does not need additional high performance devices and strict standard environment, which is considered as a simple and low cost way to realise high accuracy data acquisition. Using this algorithm, the output voltage at different temperatures is converted to the value at a fixed room temperature. This method can successfully avoid the influence from different temperatures on the voltage and correct its value at a standard temperature. Finally, by using the pressure calibration coefficients at room temperature, the compensated voltage can be transferred to equivalent corrected pressure value.
Based on the empirical formula of Wheatstone bridge, the output voltage Vp under any pressure can be presented by a polynomial based on room temperature condition. This formula of polynomial is presented below:
(1)
(1)
Here,
is the output voltage of pressure sensor at a standard room temperature T0. w0 is temperature correction coefficient at the room temperature T0. w1 and w2 are linear and nonlinear temperature correction coefficient under any pressure, respectively. In our experiment, T0 is set to 23.65°C obtained from internal reference thermometer. The temperature correction coefficient is normally empirical values, which depend on different pressure sensitive materials.
According to Equation (1), the equivalent matrix is developed to calculate the temperature correction coefficient. Its formula is shown as:
(2)
(2)
In the first test, the output voltages (,
and
) under a standard pressure at three temperatures (T1, T2 and T3) should be noted. By comparing with the voltage value
under the same standard pressure at standard room temperature T0, these temperature correction coefficients (w0, w1 and w2) can be calculated.
By deducing (1), every output voltage Vp can be corrected to its voltage at standard room temperature T0 with the above calculated temperature correction coefficients. This temperature compensation algorithm is explained below:
(3)
(3)
Here, the compensation output voltage Vpc at different temperature is taken as
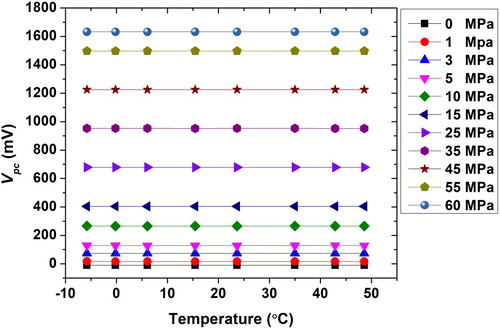
at standard room temperature T0. By using this temperature difference polynomial accompanied with temperature correction coefficients, the temperature drift can be reduced effectively. gives the compensation output voltage Vpc from different temperatures under a series of standard pressure values. It is observed that every Vpc under the same pressure is rarely affected by temperature. Their values are nearly stable and the attendant temperature drift is largely eliminated. Meanwhile, in the pressure range of 0∼60 MPa, all the output voltages of sensor are very easily distinguished and it can obtain a high voltage resolution.
Figure 6. Temperature compensated voltage of pressure sensor.
In order to verify the effect of temperature compensation algorithm, the error between compensation pressure value and standard pressure value should be studied. A transfer polynomial is generally used to calculate the corrected pressure value corresponding to compensating voltage Vpc, and its formula is shown as:
(4)
(4)
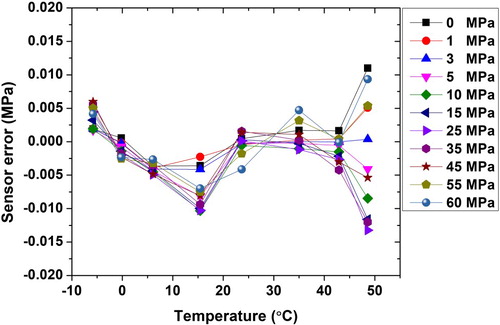
where, P is the real pressure value. a0, a1, a2 and a3 are the pressure calibration coefficients, and their values are obtained by fitting this polynomial with a series of pressure calibration experiments at the standard room temperature T0. According to data from , all the output compensating voltages are transferred to equivalent corrected pressure values. shows the error between the equivalent pressure value P and the value from the internal reference pressure gauge. It can be clearly seen that the error fluctuates around zero point, and the maximum value of pressure error is found between −0.015 and 0.015 MPa. It is concluded from the results that the compensated sensor reaches a high accuracy 0.03% in the full pressure range of 0∼60 MPa. By applying this temperature compensation algorithm, the experimental pressure values with temperature drift are well corrected, and it is successful to realise the independence of temperature change. Without complex data processing and additional standard device, this method only needs several parameters from calibration experiments at a standard room temperature to achieve high accuracy data acquisition.
Figure 7. Pressure sensor error under different standard pressure values.
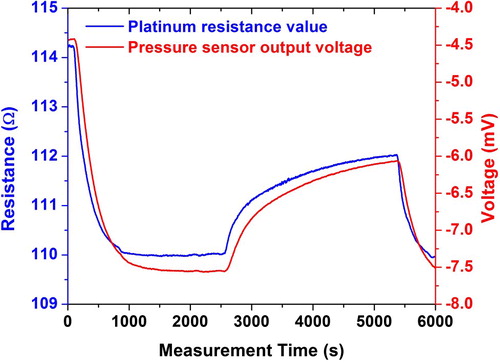
In practical application, in order to realise the real-time temperature compensation, a platinum resistance as reference thermometer is integrated with sapphire substrate to obtain the change of environmental temperature in time. Due to different sensitive materials, there is a mismatch of response time between thermometer and pressure sensor, which can cause excessive and deficit voltage compensation. presents two curves about the change of platinum resistance and compensating voltage with the variation of temperature in a period of 6000 s. It is found that the curve of platinum resistance is not agreed with the output compensating voltage, and it brings excessive data compensation. The low-pass filter with time constant 100 s is connected with our platinum resistance to ensure the synchronisation of two sensors.
Figure 8. Response speed between platinum resistance and output voltage.
In deep sea profile testing, a large amount of environmental data should be obtained and processed rapidly. With powerful data processing ability, Microcontroller Unit (MCU) chip is used for the rapid data collection of temperature and pressure. Furthermore, considering that regular calibration and compensation are performed in the laboratory, conventional sensors are not suitable for long-term marine environment observation. By loading the compensation algorithm and other background correction parameters into MCU chip, it can realise the environment self-adaptive function, which is considered as an important part of the future smart marine monitoring system. On the other hand, this chip is also convenient to be combined with the other marine sensors, which is able to form a complex observation system.
4. Deep sea pressure test
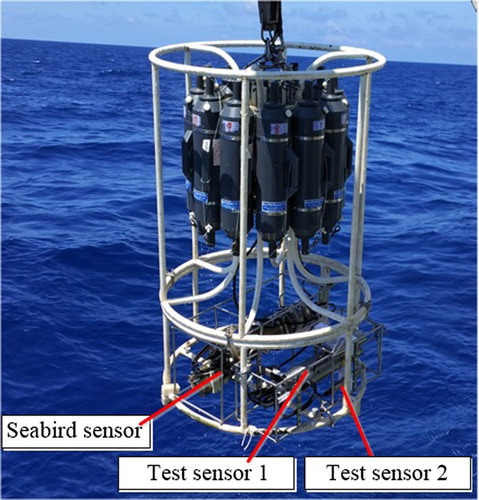
A deep sea pressure test has been performed in the South China Sea (18°39.160’N, 120°14.525’E). During the 10 days test period, the maximum sea current and surface wave is 2 m/s and 2.8 m, respectively. All the experimental devices are transported by the Chinese marine research ship, and they are mounted on a shelf. A commercial digiquartz pressure sensor integrated in Seabird Company instrument (CTD-911) is used to provide the reference values for deep sea pressure measurement, whose accuracy reaches 0.015% in the full pressure range of 0∼70 MPa. As shown in , test sensor 1 is integrated on a home-made CTD instrument, and test sensor 2 is placed on the side. All three instruments are at the bottom of shelf to make sure the pressure sensors at the same depth. The whole of shelf is attached to the winch on the ship, and three sensors inside make the pressure measurement at the same time with the release of rope. The data from three pressure sensors are used for comparison and analysis.
Figure 9. Deep sea profile test.
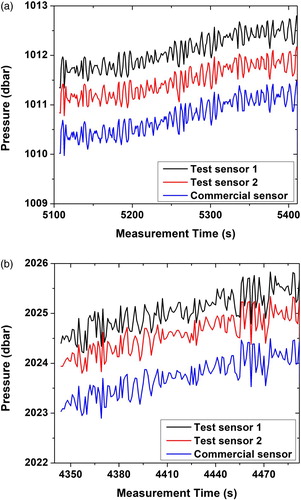
This shelf has been released directly to the bottom of the sea for realising the profile measurement of seawater salinity with the carried CTD instruments. And then, this device is retrieved along the previous trace, and the winch speed is controlled at several depths to complete the pressure measurements at different depths. gives the pressure values from three pressure sensors at about 4000 and 3000 m depth. It can be observed that the pressure data from three sensors have the same trend over the measurement time. The data from test sensor 2 is closer to the value from the commercial sensor. The maximum measured pressure error between test sensor 1 and reference sensor is controlled within 1.8 dbar, and the accuracy reaches 0.03% in the full scale of range. presents the measured pressure values from 2000 and 1000 m depths. It is observed that the pressure variations from three sensors are very similar, and the pressure error compared with the reference commercial pressure sensor is less than 1.8 dbar.
Figure 10. Data comparison with different sensors (a) Pressure measurement at about 4000 m depth and (b) about 3000 m depth.
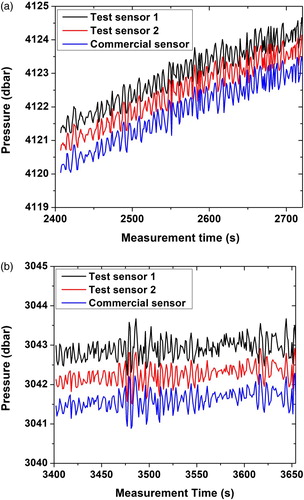
Figure 11. Data comparison with different sensors (a) Pressure measurement at about 2000 m depth and (b) about 1000 m depth.
According to the above deep sea test curves, two test sensors show an excellent dynamic characteristic like the high accuracy commercial digiquartz pressure sensor. The deep sea measurement accuracy of test sensor is consistent with that in the laboratory standard device. Compared with the expensive commercial sensor, the silicon-on-sapphire pressure sensor with programmable temperature compensation algorithm has the advantages of low cost and miniaturisation, and it is flexible to be integrated with the other equipments.
5. Conclusions
Pressure sensor is considered as a necessary ocean reference device for the deep sea exploration and marine resource exploitation. In this paper, a silicon-on-sapphire piezoresistive pressure sensor with a stress cup structure and a series of packaging technologies are presented. In a standard experimental condition, the temperature drift of this sensor from −6°C to 50°C is observed. A simple and low cost temperature compensation algorithm is proposed to reduce temperature drift on the output voltage of sensor. Temperature compensation model with correction coefficient is established to achieve 0.03% high accuracy in the full pressure range of 0∼60 MPa. In the actual deep sea pressure measurement, experimental results indicate that two test sensors have the same performance as the commercial digiquartz pressure sensor. The maximum measurement error between test pressure sensor and commercial sensor is reduced to 1.8 dbar after compensation. Compared with other sensors, this low cost piezoresistive pressure sensor with compensation algorithm and background coefficients is feasible to realise the environment self-adaptive function. The intelligent behaviour is implanted into the marine complex system to adapt deep sea unattended long-term observation.
Disclosure statement
No potential conflict of interest was reported by the authors.
Additional information
Funding
References
- Boukabache A, Pons P, Blasquez G, Dibi Z. 2000. Characterisation and modeling of the mismatch of TCRs and their effects on the drift of the offset voltage of piezoresistive pressure sensors. Sens Actuators A. 84(3):292–296. doi: 10.1016/S0924-4247(00)00406-4
- Campabadal F, Carreras JL, Cabruja E. 2006. Flip-chip packaging of piezoresistive pressure sensors. Sens Actuators A Phys. 132(1):415–419. doi: 10.1016/j.sna.2006.02.052
- Chadwick WW, Nooner SL, Zumberge MA, Embly RW, Fox CG. 2006. Vertical deformation monitoring at Axial Seamount since its 1998 eruption using deep-sea pressure sensors. J Volcanol Geotherm Res. 150(1–3):313–327. doi: 10.1016/j.jvolgeores.2005.07.006
- Chou TL, Chu CH, Lin CT, Chiang KN. 2009. Sensitivity analysis of packaging effect of silicon-based piezoresistive pressure sensor. Sens Actuators A. 152(1):29–38. doi: 10.1016/j.sna.2009.03.007
- Drushka K, Gille ST, Sprintall J. 2014. The diurnal salinity cycle in the tropics. J Geophys Res Oceans. 119(9):5874–5890. doi: 10.1002/2014JC009924
- Dusek J, Kottapalli AGP, Woo ME, Asadnia M, Miao J, Lang JH, Triantafyllou MS. 2013. Development and testing of bio-inspired microelectromechanical pressure sensor arrays for increased situational awareness for marine vehicles. Smart Mater Struct. 22:014002. doi: 10.1088/0964-1726/22/1/014002
- Guo SW, Harald E, Kimiko C, Anita F. 2009. Mary hoffman high temperature smart-cut SOI pressure sensor. Sens Actuators A. 154(2):255–260. doi: 10.1016/j.sna.2009.03.011
- Guo ZS, Lu C, Wang YS, Liu DF, Huang MG. 2017. Design and experimental research of a temperature compensation system for silicon-on-sapphire pressure sensors. IEEE Sens J. 17(3):709–715. doi: 10.1109/JSEN.2016.2633324
- Koyama S, Miwa T, Horii M, Ishikawa Y, Horikoshi K, Aizawa M. 2002. Pressure-stat aquarium system designed for capturing and maintaining deep-sea organisms. Deep Sea Res Part I. 49(11):2095–2102. doi: 10.1016/S0967-0637(02)00098-5
- Laugere F, Lubking GW, Bastemeijier J, Vallkoo MJ. 2002. Projected design of an electronic for capacitively coupled four-electrode conductivity detection in capillary electrophoresis microchip. Sens Actuatros B Chem. 83(1–3):104–108. doi: 10.1016/S0925-4005(01)01051-6
- Li J, Hu G, Zhou Y, Zou C, Peng WSMJA. 2016. A temperature compensation method for piezoresistive pressure sensor utilizing chaotic lons motion algorithm optimized hybrid kernel LSSVM. Sensors. 16(10):1707. doi: 10.3390/s16101707
- Melvas P, Stemme G. 2003. A diode-based two-wire solution for temperature compensated piezoresistive pressure sensor. IEEE Trans Electron Devices. 50(2):503–509. doi: 10.1109/TED.2003.809026
- Molianen H, Leppävuori S, Uusimäki A. 1994. Laser-induced chemical vapour deposition in piezoresitive pressure sensor fabrication. Sens Actuators A Phys. 41(1–3):150–155. doi: 10.1016/0924-4247(94)80104-5
- Niu Z, Zhao Y, Tian B. 2014. Design optimization of high temperature piezoresistive pressure sensor for high sensitivity. Rev Sci Instrum. 85(1):015001. doi: 10.1063/1.4856455
- Otmani R, Benmoussa N, Benyoucef B. 2011. The thermal drift characteristics of piezoresistive pressure sensor. Phys Proc. 21:47–52. doi: 10.1016/j.phpro.2011.10.008
- Pan BB, Cui WC. 2010. An overview of buckling and ultimate strength of spherical pressure hull under external pressure. Marine Struct. 23(3):227–240. doi: 10.1016/j.marstruc.2010.07.005
- Paniagua G, Dénos R. 2002. Digital compensation of pressure sensors in the time domain. Exp Fluids. 32(4):417–424. doi: 10.1007/s003480100355
- Pramanik C, Islam T, Saha H. 2006. Temperature compensation of piezoresistive micro-machined porous silicon pressure sensor by ANN. Microelectron Reliab. 46(2–4):343–351. doi: 10.1016/j.microrel.2005.04.008
- Rabinovich AB, Elé MC. 2015. Deep-ocean measurement of tsunami waves. Pure Appl Geophys. 172(12):3281–3312. doi: 10.1007/s00024-015-1058-1
- Stuchebnikov VM. 2005. Silicon-on-sapphire structures as a material for piezoresistive mechanical transducers. J Commun Technol Electron. 50(6):622–637.
- Sun Y, Sun X, Sun B, Meng Q. 1997. Projected electric drift of the bridge offset for pressure sensor and its utilization. Sens Actu A Physical. 58(3):249–257. doi: 10.1016/S0924-4247(97)01399-X
- Sun YC, Gao ZB, Tian LQ, Zhang Y. 2004. Modelling of the reverse current and its effects on the thermal drift of the offset voltage for piezoresistive pressure sensors. Sens Actuators A Phys. 116(1):125–132. doi: 10.1016/j.sna.2004.01.064
- Uemoto M, Kobayashi T, Sasaki Y, Shimada K, Izawa K, Hasegawa SI, Kobayashi JI, Sakurai F. 2011. Component analyses of silver brazing filler metals by inductively coupled plasma atomic emission spectrometry: a collaborative study for standardization. Anal Methods. 3(5):1116–1121. doi: 10.1039/c0ay00663g
- Wood S, Nulph A, Howell B. 2004. Application of autonomous underwater vehicles characterization of the physical environment for development of environment based navigation systems. Sea Technol. 45(12):10–14.
- Yara Y, Fuji M, Yamano H, Yamanaka Y. 2014. Projected coral bleaching in response to future sea surface temperature rises and the uncertainties among climate models. Hydrobiologia. 733(1):19–29. doi: 10.1007/s10750-014-1838-0