
 ?Mathematical formulae have been encoded as MathML and are displayed in this HTML version using MathJax in order to improve their display. Uncheck the box to turn MathJax off. This feature requires Javascript. Click on a formula to zoom.
Abstract
With the rapid transition towards Industry 4.0, many industries have recognised the need to develop intelligent maintenance systems and predictive analytics tools that are able to optimise the performance of complex assets throughout their entire lifecycle. This paper adopts a machine learning (ML) technology to enhance the resilience of marine propulsion systems by predicting mean-time between failures (MTBF) and prioritising condition-based maintenance (CBM) activities. The factors considered for the analysis include a series of attributes (in total 16 features) which directly or indirectly represent the state of the system subject to degradation. From the results obtained, it is found out that the feed-forward neural network (FFNN) has the least mean square errors (MSE) and, thus, it is the most suitable method for numerical and discretized estimations. The results from a greedy search algorithm also show that two attributes of ‘gas generator rate of revolutions’ and ‘gas turbine rate of revolutions’ are the most significant parameters influencing system reliability, and therefore, they require closer monitoring. Furthermore, a decision support system (DSS) dashboard is designed to help marine propulsion system operators make informed maintenance decisions and find an improved balance in their spare parts inventory.
1. Introduction
The maritime industry is responsible for transporting a large proportion of global trade of goods. However, the resilience of maritime systems has received little attention to date. The maintenance costs account for about 20% to 30% of total operating expenses in the maritime sector. These costs are mainly related to downtime and financial burden of unexpected failures in ship systems (Lazakis and Ölçer Citation2016). Detecting and diagnosing marine engine failures play a very important role in safe navigation of marine vessels. Preventing these failures in a proactive way ensures uninterrupted cruising speed for long distances. It also can improve the ship’s overall environmental footprint and even reduce fuel consumption (Tsaganos et al. Citation2020).
The ship components usually exhibit uncertain lifetime due to severe service conditions and environmental influences. Therefore, the use of stochastic models can support the quantification of the uncertainty associated with lifetime prediction parameters in order to achieve an optimal maintenance plan (Kimera and Nangolo Citation2020a). The safety and reliability of ship systems depend on the effectiveness of the maintenance plans that are in place to preserve or restore equipment items. Some systems in the maritime industry undergo time-based maintenance tasks that involve periodic checking, cleaning, and replacement of components to avoid sudden failures. The selection of an appropriate time interval for the maintenance of critical components is an important consideration in the development of a maintenance plan. Inappropriate selection of the maintenance interval may result in either unexpected failures (when the system health is not continuously monitored and the components fail between maintenance cycles) or excessive maintenance, repair, and equipment replacement (when the system is maintained very frequently). For this reason, the topic of optimal preventive maintenance interval has attracted the attention of many researchers (Emovon et al. Citation2017; Karatuğ et al. Citation2023).
With the evolvement of Industry 4.0, it is necessary to improve the efficiency of maintenance and repair operations, overhauls, as well as the spare parts procurement process (Hosseini et al. Citation2020). In recent years, some cutting-edge technologies such as artificial intelligence (AI) and Internet of Things (IoT) have made a significant impact on the maintenance practices of industrial equipment. Recently, machine learning (ML) technology has shown great potential in the field of condition-based maintenance (CBM) and predictive maintenance (PdM) (Çınar et al. Citation2020). This may be due to an increase in the amount of data being generated by smart connected devices and the recent advances in the area of data analytics. The ML technology is capable of handling multi-dimensional and multi-variate data and extracting hidden relationships among data items (Wuest et al. Citation2016). Therefore, it can provide powerful predictive solutions for CBM and PdM of industrial equipment. However, the efficiency of a ML technology depends on the type of technique used (Carvalho et al. Citation2019). Among all statistical methods, the ML techniques are the most suitable choices for dealing with highly dimensional problems, where hundreds or thousands of physical variables such as temperature, pressure, voltage, current, flow, etc. are involved (Susto et al. Citation2015). Due to the large number of parameters involved, and the existence of non-linear relationships among variables, finding an optimal maintenance schedule can become a very challenging task.
A brief review of the literature shows that ML techniques can be helpful in improving the resilience of industrial facilities and marine infrastructure. It is crucial to predict the time to failure of equipment in order to avoid unexpected downtime and optimise maintenance activities. To bridge the aforementioned gap, the main contributions of this work are as follows:
This paper develops a method based on ML technology to estimate the time between failures and then cluster and rank the maintenance activities for a marine propulsion system.
We propose a method to reduce dimensions of the problem and optimise the features selection by a Taguchi method and Genetic Algorithm (GA).
A decision support system (DSS) is also designed to support CBM services as well as optimising the spare parts supply by identifying the type and quantity of the parts required for repair or replacement.
The remainder of the paper is organised as follows. Section 2 reviews the state-of-the-art maintenance strategies and highlights the importance of CBM in maritime industry. It also discusses the role of data mining and ML techniques in solving maintenance decision-making problems and reviews the applications of ML techniques in shipping industry. Section 3 presents the proposed methodology in detail. Section 4 reports the results of applying ML algorithms to a dataset that is publicly available on the repository of the University of California in Irvine (UCI) (Repository Citation2014). Dataset has been produced from a sophisticated simulator of a gas turbine mounted on a frigate characterised by a COmbined Diesel eLectric And Gas (CODLAG) propulsion plant type. We conduct a classification process with ML algorithms by using RapidMiner software. RapidMiner is a data science software platform that provides an integrated environment to support all steps of the ML process, including data preparation, predictive analytics, data visualisation, and model validation and optimisation. Finally, section 5 concludes the research and provides recommendations for future research.
2. Research background
2.1. Maintenance strategy selection
In recent decades, the focus of maintenance management systems has gone beyond just repairing or replacing critical parts to more sophisticated knowledge-based systems of fault detection and diagnostics. In the era of modern industries, maintenance is as much important as the manufacturing process as it plays a prominent role in avoiding unexpected failures and ensuring production efficiency. The development of an optimal maintenance strategy can help companies provide action plans that include specific recommendations on how to keep their assets safe and serviceable (Arjomandi et al. Citation2021). Relying on traditional methods to optimise maintenance strategies for components with a high probability of failure may lead to loss of production and poor operational efficiency (Animah and Shafiee Citation2021). Choosing the best maintenance strategy for industrial application has always been a huge challenge (Lazakis et al., Citation2016). The cost-effectiveness of a maintenance strategy depends on the proper planning of the repair activities as well as the availability of spare parts. Identifying the root causes of machine failures as well as the patterns of such failures is a prerequisite for optimal maintenance planning. On the other hand, ensuring availability of spare parts is essential for manufacturers to support after-sales maintenance and repair services and avoid unnecessary inconveniences to customers.
In general, maintenance strategies can be classified into three types: corrective maintenance, preventive maintenance, and CBM (Coraddu et al. Citation2016). Under the corrective maintenance strategy, the equipment or system is allowed to run until it fails and then it is repaired or replaced. Preventive maintenance (PM) is a strategy that involves routine repairs according to a defined time interval or usage level of the asset. CBM is a maintenance strategy that has attracted the attention of many researchers in recent years (Asuquo et al. Citation2021; Kimera and Nangolo Citation2022). This strategy stipulates that maintenance should only be performed when certain indicators show signs of performance degradation or impending failure. For this purpose, it incorporates all diagnosis, process and performance data, maintenance histories, operator logs and design information to make timely maintenance decisions. CBM provides the ability to increase the equipment reliability and improve the efficacy of maintenance operations based on the data gathered from condition monitoring systems. Condition monitoring systems include various tools that are used to record and evaluate different parameters such as vibration, acoustic, temperature, flow signal and oil colour. The data is then processed to determine the health status of the equipment and predict the remaining useful life (RUL) (Pascual Citation2015). An optimal maintenance plan is then prepared based on the predicted health condition of the equipment so that a preventive repair/replacement can be performed when there is a high risk of failure (Liao et al. Citation2006; Vachtsevanos et al. Citation2006).
2.2. ML techniques in maintenance management
In recent years, data mining has gained tremendous popularity in the maintenance management of industrial assets. Data mining includes various analytical tools such as statistical database systems that are used to determine relationships between data in large databases (Sharma et al. Citation2013). ML is a subset of AI that enables computer systems to learn from previous experience (i.e. data observations) and improve their behaviour for a given task (Nguyen et al. Citation2019). The progression in ML and its widespread application is due to the ability to produce accurate results and analysis (Ayo-Imoru and Cilliers Citation2018).
ML algorithm development includes historical data selection, data preprocessing, model selection, model training, model validation, and model deployment. The steps involved in developing an ML algorithm can be specified as feature representation (inputs), feature extraction and selection, ML method application, and outputs (Zhang et al. Citation2019). Knowledge discovery and model classification problems require the selection of a subset of features to represent the models. This is because the classifier’s performance and the classification cost are sensitive to the selection of features used to construct the classifier. Genetic algorithm (GA) provides an attractive method to find near-optimal solutions for optimisation problems. Yang and Honavar (Citation1998) introduced a method of selecting a subset of features using GA. Their experiments showed the potential of this method in the selection of feature subsets for the design of automatic neural networks for pattern classification and knowledge discovery. Lapa et al. (Citation2006) used GA to determine the best maintenance strategy with considering several factors, including: the possibility of corrective maintenance, preventive maintenance costs, downtime, the impact of maintenance on the reliability of the entire system, etc. Rostami et al. (Citation2021) applied a variety of meta-heuristic methods to eliminate redundant and irrelevant features from high-dimensional datasets and they found out that GA outperformed other features selection methods such as particle swarm optimisation (PSO), ant colony optimisation (ACO), and artificial bee colony (ABC).
The Taguchi method is one of the best experimental methods used to find the minimum number of experiments performed within acceptable limits for factors and levels. The method is known as an offline quality control method that can improve product or process performance at low cost. Chatsirirungruang (Citation2010) proposed an approach based on GA and the Taguchi method to apply computer-aided engineering in dynamic robust parameter design. Hou et al. (Citation2007) integrated the parameters design of the Taguchi method, response surface method and GA to set the optimum parameters for a nanoparticle milling process. Ouyang et al. (Citation2017) implemented a combined Taguchi method and radial basis function neural network to determine optimum parameters in methanol steam reforming.
Artificial neural networks (ANNs) have great potential in predicting the potential failure modes of equipment (Krenek et al. Citation2016). ANNs are widely used to solve tasks such as association, classification, clustering, pattern recognition, image processing, control, optimisation, and modelling. Clustering is a process of grouping data into multiple clusters such that the data within a cluster has maximum similarity and data between clusters has minimum similarity. Davies Bouldin index (DBI) is a measure used to evaluate the validity of clusters in a clustering problem. This measure is based on an approximate estimate of the distance between clusters and their dispersion to obtain the final value representing the quality of the partition (Thomas et al. Citation2013). Karo et al. (Citation2017) used the DBI measure to validate a partitional clustering technique for a spatial clustering application.
Numerous algorithms have been proposed in the literature to predict the RUL of systems and components subjected to condition monitoring. However, in cases where data is ubiquitous, determining the most suitable strategy for life extension based on CM data and RUL estimates is a challenging task (Ochella et al. Citation2021). Tian (Citation2012) developed an ANN approach to estimate the RUL of pump bearings. In their model, the condition monitoring measurement values at the current and former inspection points were taken as inputs, and the pump bearing’s life percentage was estimated as the output value. Saon and Hiyama (Citation2010) proposed an ANN model to improve the accuracy of RUL predictions for a bearing system. Huang et al. (Citation2007) developed a back propagation neural network model to predict the RUL of ball bearings. Wu et al. (Citation2007) proposed an ANN model to estimate the life percentile and failure times of roller bearings. Li et al. (Citation2018) proposed a novel deep convolutional neural network-based method for predicting the RUL of industrial assets. To show the effectiveness of their method, they tested it on the popular C-MAPSS aircraft engine dataset.
Lazakis et al. (Citation2018) proposed an ANN approach to predict the exhaust gas temperature in ship engines and then validated the forecasted results by comparing them with actual observations recorded on board the ship. Arif-Uz-Zaman et al. (Citation2017) predicted the failure times of an equipment using text mining methods and based on the data recorded in maintenance logs. Lu et al. (Citation2018) applied the ANN technique to predict life percentage of offshore wind turbine components by leveraging the condition monitoring information. The estimates were then used to develop an opportunistic CBM optimisation approach for wind turbines. Kutyłowska (Citation2015) applied the ANN technique to predict the failure frequency in a water supply system. It was found out that the ANN trained by quasi-Newton approach produces good convergence. Rohani et al. (Citation2011) estimated the maintenance cost of a tractor by using the ANN technique. Ahmadzadeh and Lundberg (Citation2013) proposed an ANN method to predict the RUL of grinding mill liners. de Jonge et al. (Citation2016) proposed an approach for clustering of CBM activities in systems consisting of multiple critical units with the objective of minimising the total maintenance costs. Deris et al. (Citation1999) adopted a GA approach to determine the start times of maintenance activities and optimise the ship availability in the Royal Malaysian Navy. Galar et al. (Citation2015) proposed a hybrid model for predicting the health condition as well as the RUL of a system based on the operational degradation data. Vintr and Vintr (Citation2011) developed a model to predict the mean operating time between failures of a group of rolling bearings. Jagtap et al. (Citation2020) applied a PSO method to evaluate the performance of subsystems in a thermal power plant. A simulation model based on Markov probabilistic method was proposed to estimate the availability of the system. The results showed that the turbine lubrication subsystem and generator excitation have the most influence on system availability. Coraddu et al. (Citation2016) presented two methods of regularised least squares (RLS) and support vector machine (SVM) to predict the degradation of gas turbines in a marine propulsion system. To evaluate the effectiveness of the proposed approaches, they conducted some experiments on the data generated from a gas turbine simulator.
Failure prediction plays an important role in proactive fault management, being the first stage of the process. Mean-time between failures (MTBF) and mean-time to failure (MTTF) are two critical key performance indicators (KPIs) used in reliability theory. bin Bandan et al. (Citation2019) introduced an instantaneous MTTF estimation technique for electronic chips. Erozan (Citation2019) used MTBF and MTTF information to identify and rank the critical components in a manufacturing system. Braglia et al. (Citation2012) proposed a multivariate statistical approach to support the classification of mechanical components. They used MTBF to identify and cluster operating parameters that influence the reliability. Das Chagas Moura et al. (Citation2011) performed a comparative analysis to evaluate the effectiveness of SVM method in predicting failure times and reliability of engineering components based on time series data. The comparison showed that SVM was superior or comparable to other techniques. Liao and Yang (Citation2017) proposed a greedy algorithm with water injection model to optimise maintenance schedules for multi-component systems considering system reliability. The objective function was to minimise the maximum execution time with different faulty machines.
2.3. Application of ML in shipping industry
Coraddu et al. (Citation2015) used Machine Learning (ML) methods to develop effective CBM and PdM models for a naval vessel gas turbine propulsion plant. İnceişçi and Ayça (Citation2022) studied the data obtained from an LM-2500 type ship engine and applied the regression method and ANN algorithm to predict the faults in a ship machinery. The authors compared the performance of different regression models, including linear regression, decision tree regression, k-nearest neighbours regression, random forest regression, Bayesian ridge regression, extra tree regression and linear SVR regression. It was found out that the ANN algorithm predicted the faults more accurately than regression models. Gupta et al. (Citation2022) demonstrated how the ML methods can be applied to estimate the hydrodynamic performance of a ship based on the recorded in-service data. Karvelis et al. (Citation2021) proposed deep learning methods for structural health monitoring of ship hulls. Berghout et al. (Citation2021) developed a deep supervised learning approach for CBM of naval propulsion systems. Cheliotis et al. (Citation2020) proposed data-driven ML methods for fault detection in shipboard systems. Zhang et al. (Citation2022) presented a big data analytics method based on ML to evaluate the risks associated with ship grounding in real environmental conditions. Kimera and Nangolo (Citation2020b) proposed a predictive maintenance approach using ML to develop an early failure warning system for ballast pumps on ship repair yards. The ML methodology was used to process and analyse the dock pump operating parameter with the aim of drawing inferences from data via MATLAB.
The review of the literature outlined the importance of using ML technology to discover the pattern of failures in marine vessels and accordingly mitigate conditions that may adversely affect the safety. However, it was found out that very little research has been conducted on the failure prediction and CBM planning of ship propulsion systems. To overcome this research gap, this study examines the use of advanced unsupervised and supervised ML techniques in failure clustering and maintenance prioritisation for marine propulsion systems. The efficiency of the proposed methods is compared with other methods reported in the literature, such as the regression algorithm (as a kind of supervised ML technique) that was used by Coraddu et al. (Citation2016) to predict the degradation rate of gas turbines on vessel propulsion system.
3. The proposed method
The success in implementation of CBM technology relies on the capability of data-driven models in detecting system anomalies. For this reason, the effective use of ML algorithms is one of the objectives pursued in this research. The present study aims to estimate the times between failures, rank and prioritise maintenance activities, and plan spare parts requirements for repair services. To achieve this aim, we propose a methodology as shown in Figure .
Figure 1. The proposed methodology.
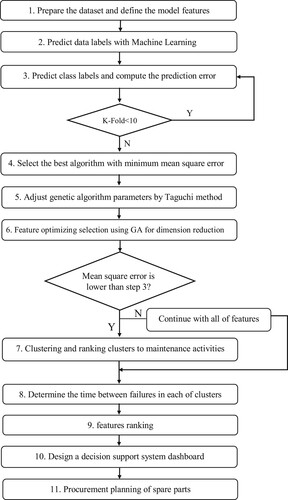
The steps of the proposed methodology are discussed in detail in the following paragraphs: In the first step, the datasets are prepared in accordance with the conditions of the problem, and they are then integrated into the model. In the second step, the unnecessary attributes are removed, and the prediction labels are determined based on the features available in the dataset. The third step includes the analysis of label features. It entails the evaluation of two classes of data-mining algorithms as well as supervised ML techniques in terms of their accuracy. The algorithms consist of classification techniques with numeric features (such as neural network algorithm, linear regression, k-nearest neighbours, and deep learning) and classification techniques with discretizing numerical features (such as neural network algorithm, decision tree, generalised linear model (GLM) regression, and random tree algorithm). In the fourth step, the performance of each classifier is assessed in terms of reliability and impartiality based on cross-validation, with the aim of providing a systematic approach for assessing the classification and measurement of accuracy. In this paper, we use a ten-stage K-fold Cross Validation (KCV) technique. In this technique, the data are divided randomly by the samples in the training and prediction sets. Since each sample is used for prediction, cross-validation uses the data effectively and eliminates the emphasis on using only one subset of prediction with good performance. Therefore, it is possible to interpret the results of various experiments and the overall accuracy by utilising the standard deviation measure. The key parameter in the KCV technique is the parameter k that defines the number of folds. In most cases, the choice of k is usually 5 or 10.
In the fifth step, the input dataset is divided into two categories of training and test data. Training is carried out with each type of the classification algorithm with discretizing numeric features. The discretization process is known as one of the most important data preprocessing tasks in data mining and it is a necessary step before processing of numerical data. By discretizing the numeric features, we enable the nominal estimation. Many of the classification algorithms have high efficiency in classifying nominal classes. After training, the test data is integrated, and the model learning is tested. We record the accuracy and error rates of each type of classification algorithms. These processes are repeated ten times based on the ten-stage KCV technique. The metrics of total prediction error and the root mean square error are calculated. Finally, the algorithm with the highest accuracy and lowest error rate in predicting the label in both classes of algorithms is chosen.
In the sixth to eleventh steps, the parameters affecting the performance of GA method such as population size, number of generations, p-initialize, p-mutation, and p-crossover are adjusted by a Taguchi method. With accurate adjustment of the parameters, it is possible to achieve more attribute reduction without decreasing the average fit precision after the preprocessing operation. In addition, it is necessary to reduce the dimensions of the problem to increase computational speed. Thus, the GA should specify the most important features of the input dataset, so that ultimately the classification can be carried out on the selected features. In this stage, the number of levels at which the parameters should be varied are specified. Therefore, the selected levels of each of the parameters are determined and then the Taguchi method is applied to identify the number of required tests. The obtained results from each stage of the experiments (such as the accuracy and error rate) are analysed, and then the optimal values of each parameter of the GA are determined. In each step, the selected classifier examines the accuracy and error rate of the algorithm. The optimal values of each parameter are incorporated in the GA model to identify and select the effective features. This exploratory approach is typically used to find the optimal solution for optimisation and search problems. The objective of dimensionality reduction is to find the optimal, or, in other words, the best solution from all possible solutions. The results obtained from the dimensionality reduction and the classification algorithm are analysed, and then improvements of the problem-solving conditions are examined. Dimensionality reduction increases the processing speed and decreases the storage size. By selecting the feature suggested by the GA method, the remaining features can be eliminated from the computational process, enabling to reduce the dimensionality of data. If the optimality is proven and no changes is observed in the accuracy and error rates, the selected features are continued to be used in the model, otherwise, the other features should be involved in the process of solving the problem.
In the twelfth and thirteenth steps, the DBI technique is used to determine the number of optimised clusters. The number of clusters in a dataset (that is often referred to as ‘k’ in the K-means clustering method) is an input parameter to the algorithm. The maintenance activities in each cluster are prioritised using the K-mean clustering method. According to the prior nominal classification (healthy, appropriate, moderate, deteriorating, and failure), the time between failures as well as the health rate of each cluster are determined. In each stage, clusters are prioritised and ranked, and the superior cluster is determined for performing maintenance activities.
In the fourteenth step, the priority of examining the features in each cluster is determined by a greedy-search algorithm. This algorithm chooses the best option according to the problem’s conditions. The neural network algorithm evaluates the accuracy rate at each stage of searching and determining the priority of attributes. In the fifteenth and sixteenth steps, a decision support system is designed to help with spare parts inventory management. This system supports the users in the decision-making process for repairing or replacing the parts, based on the information provided from the previous stages. Utilising such system will improve the effectiveness of maintenance decisions as it provides users technical solutions about the inspection method and the parts that need to be repaired or replaced. Also, this system allows the procurement planning of spare parts, by considering the priority of each attribute, the number of failures, and the number of spare parts required to carry out the maintenance activities.
4. Case study
This Section presents the results of testing the proposed methodology on a big dataset which is generated from a sophisticated simulator of a gas turbine propulsion plant. The steps of the implementation phase are as follows:
4.1. Prepare the dataset and define the model features
Data preparation is the process of transforming raw data so that data scientists and analysts can run it through ML algorithms and uncover insights or make predictions. In this step, unnecessary features are removed, the predictive tags are determined, and eventually, the titles of the features are added to the dataset and stored in conventional formats such as CSV or Excel files. Based on the first step of the method, the dataset from the UCI repository was tested to evaluate the performance of the proposed methods. This dataset entails a set of criteria including sixteen features and two predictive labels (classes) with titles of compressor decay state coefficient (CDSC) and turbine decay state coefficient (TDSC) which indirectly indicate the state of the system that has achieved performance impairment and stored in the dataset over the parameter’s space. In particular, the CDSC has been investigated in the domain [1; 0.95] and the TDSC in the domain [1; 0.975]. Table presents the features of the dataset.
Table 1. Features and predictive labels.
The propulsion system behaviour has been described with these parameters: ship speed (linear function of the lever position lp); compressor degradation coefficient kMc; turbine degradation coefficient kMt. Therefore, each possible degradation state can be described by a combination of the (lp, kMt, kMc) triple.
4.2. Predict data labels by ML
After preparing the dataset and defining the features, the prediction labels (the features that should be predicted) are identified. To apply supervised ML techniques, the features are classified according to two labels. The classification algorithm is executed by using RapidMiner software (https://rapidminer.com/). According to the method, in each of steps only one of the prediction labels is used and another label is removed to prevent the reciprocal effects.
4.2.1. Introduce the label of CDSC as the predictive class label
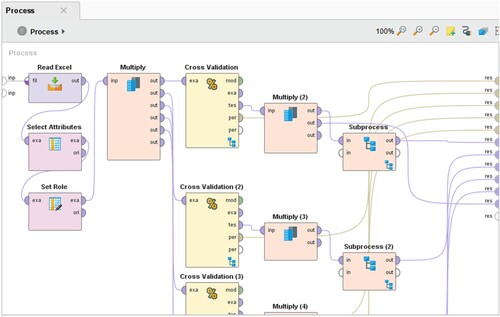
In this stage, first, the label of CDSC is introduced as the predictive label and the label of TDSC is eliminated from the calculation. Figure presents how different kinds of classification algorithms are used to predict the label of CDSC.
Figure 2. The predicting label of CDSC.
The results obtained from the KCV validation for classification algorithms including the feed-forward neural network (FFNN), linear regression, K-nearest neighbour (KNN), gradient boosted trees, and deep learning algorithms are given in Table . The column of the sum of prediction errors – which is a computational attribute – represents the sum of the prediction errors with the actual state of the dataset and it is used to report the accuracy and error rate for making comparison between two or more algorithms.
Table 2. The results of classification algorithms for prediction of CDSC.
As can be seen, the FFNN algorithm has the lowest sum of prediction errors. Therefore, this technique is selected. Table presents the results for prediction of CDSC based on the FFNN algorithm.
Table 3. The results for prediction of CDSC based on the feed-forward neural network (FFNN) algorithm.
4.2.2. Introduce the label of TDSC into the model as the predictive class label
In this stage, the label of TDSC is introduced as the predictive label. Table presents the root mean square errors obtained by different algorithms used for predicting the label of TDSC.
Table 4. The results of different classification algorithms for predicting TDSC.
Based on the results reported in Tables and , it is seen that the FFNN algorithm produced the lowest sum of prediction errors. Therefore, it can be concluded that the neural network algorithm has the necessary conditions to be selected as an algorithm to classify the numeric features. Furthermore, the KNN provides an appropriate response time as the candidate algorithm.
4.3. Predict the class labels based on discretizing numeric features by ML and compute the prediction error of the method
The previous step presented the evaluations performed in numerical estimation mode. However, the studied features can be discretized by specifying the range for further investigation. Many supervised ML algorithms require a discrete feature space. The purpose of using this type of classification in this study is to analyse more algorithms under different prediction conditions.
4.3.1. Discretizing the class label of CDSC
Table gives the discretization of the CDSC label – which is in the range of [0.95; 1] – with 0.125 intervals for proper and decay classes, and 0.025 intervals for the middle class, which is generally classified into five classes of intact, proper, middle, decay, and spoiled.
Table 5. Discretization of the CDSC label attribute.
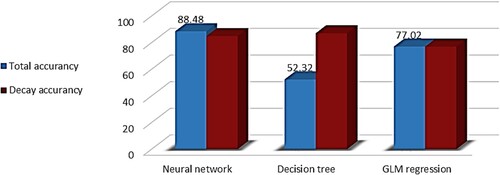
In the evaluation stage, we compare the results of the analysis with other well-known algorithms in the ML field, which are not usable in the numerical estimation model. We also compare the FFNN method – as the basic algorithm – with other algorithms in terms of the accuracy of detection. As shown in Figure , the neural network algorithm, the decision tree algorithm and the generalised linear model (GLM) in regression analysis achieved the total accuracy and decay accuracy of 88.48 and 87.75, 52.32 and 87.04, and 77.02 and 77.07, respectively. Algorithms such as decision tree and naïve Bayes were also analysed, but the accuracy of these algorithms was very low and therefore they were not displayed in Figure .
Figure 3. The performance of different algorithms in discretized mode for the CDSC label attribute.
4.3.2. Discretizing the class label of TDSC
Table provides the classification of the TDSC label with intervals of 0.00624 for proper and decay classes and 0.01249 for the middle class, which is divided into five classes of intact, proper, middle, decay, and spoiled.
Table 6. Discretization of the TDSC label attribute.
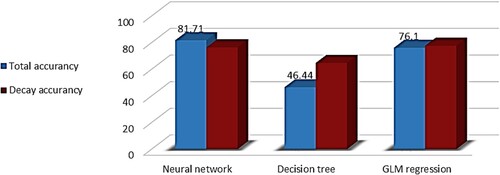
Figure shows the comparison of predictive algorithms with the discretized TDSC label. As shown in the Figure, the FFNN algorithm, the decision tree, and finally, the GLM regression analysis have achieved the accuracy and deteriorating accuracy of 91.14 and 88.94, 50.59 and 91.14, and 89.94 and 87.23, respectively. The random tree and naïve Bayes algorithms failed to achieve satisfactory accuracy rates. The results indicated good performance of the decision tree algorithm in a particular class; however, the accuracy rate was not good.
Figure 4. The performance of different algorithms in discretized mode for the TDSC label attribute.
4.4. Select the best algorithm for classification in the proposed method
Based on the results in sections 4.2 and 4.3, it is concluded that the FFNN algorithm has higher accuracy rate than the supervised and unsupervised ML methods. Therefore, we use this algorithm to classify the input data and deliver the desired output.
4.5. Adjust GA parameters using Taguchi method
To reduce the dimensions of the problem and make the computations faster, it is necessary to determine the most important features of the dataset and then perform the classification on the selected features. For this purpose, the GA is used to reduce the dimensions of the problem. To apply the GA, the parameters of initialisation population, generation, mutation, and crossover must be carefully adjusted. Therefore, the Taguchi method is applied to obtain the best combination of these parameters. In general, the Taguchi method reduces the number of tests required for optimisation and increases the accuracy of the results. Table presents the effective parameters in the GA and their selective levels. To determine the most efficient levels of each parameter, we used the Taguchi method and Minitab 17 software (https://www.minitab.com/en-us/products/minitab/) and the number of tests was set to 27. In each experiment, the parameters of the GA are set based on Tables and . In each step of calculations, the sum of prediction errors is measured by a neural network algorithm, and it is recorded for each row in the C6 (resp) column.
Table 7. Parameters and factors along with their levels.
Table 8. The results of the Taguchi method for adjusting the parameters of the genetic algorithm.
Now, we should extract the optimal values of the model parameters. For this purpose, after completing all 27 tests and recording sum of prediction errors in the relevant column, the Taguchi analysis was performed using the Minitab 17 software. The results obtained from the Taguchi analysis are presented in Figure .
Figure 5. The results of the Taguchi analysis.
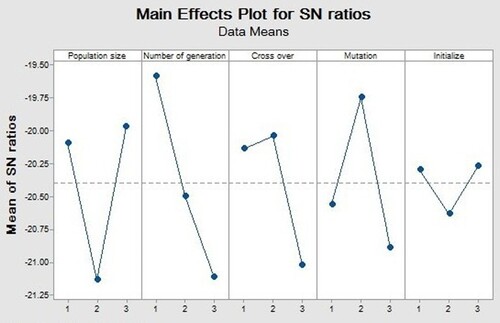
As shown in Figure , the optimum number of each parameter for adjusting the parameters of GA is obtained. The population size of the algorithm is adjusted at its third level (15). Similarly, the number of generations is adjusted at the first level (20) and the cross over is adjusted at the second level (0.2). Furthermore, mutation level is tuned at the second level (0.05) while initialisation is set at the first level (0.3). By adjusting the optimum numbers of each parameter in GA, the sum of prediction errors was obtained as 7.1. This is the lowest sum of prediction errors against all the results in Figure . Thus, the parameters of the method are adjusted according to Table , in order to obtain the maximum computational efficiency.
Table 9. Optimal parameter values calculated by the Taguchi method.
4.6. Features optimising selection using GA for dimensionality reduction
In accordance with the obtained results in the previous step, the GA is configured with optimal parameters and the linear regression is used as the fitness function in the GA, due to its relatively appropriate accuracy and high response speed. Figure presents the features optimising selection by GA.
Figure 6. Features optimising selection using genetic algorithm.
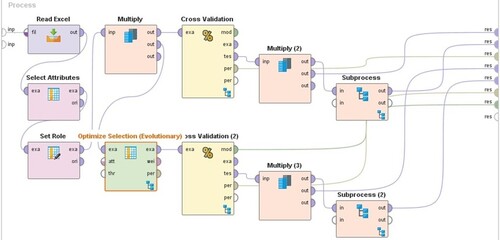
Table presents the normal mode (with all the features) and the proposed plan (features optimising selection). Based on the results, it can be concluded that compared with the normal classification mode, GA has managed to reduce the dimensions without altering the mean square root error. Dimensionality reduction affects the speed and accuracy of the computational analysis. The proposed design was able to reduce the response time from 166 s to 145 s.
Table 10. Comparing normal mode and dimensionality reduction by features optimising selection.
Based on Table , the features of GTT (gas turbine shaft torque), lp (lever position) and v (ship speed) extracted from the GA are removed from the method.
4.7. Cluster and rank maintenance activities
Based on the results obtained from the previous steps, we use a clustering algorithm to determine the priority and ranking of maintenance activities in each cluster. Therefore, the first step for clustering is to determine the suitable number of clusters.
4.7.1. Validate the clustering algorithm using the Davies-Bouldin index method
The optimal number of clusters is determined by the DBI method. As shown in Table , the value of DBI measure in the nineteenth cluster was calculated as infinite. Therefore, the value of k in the K-means algorithm was determined as 19.
Table 11. The results for the optimal number of clusters obtained from the DBI method.
4.7.2. Clustering
After executing the supervised learning process, the unsupervised learning process is applied. In this section, the clustering algorithm is performed using the K-means algorithm to determine the priority of maintenance operations in each cluster. Figure shows the results obtained for one of the clusters by considering CDSC label discretization.
Figure 7. The results obtained for one of the clusters by RapidMiner software.
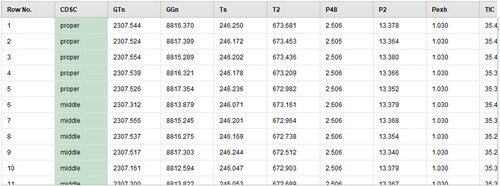
Table shows the validated data clusters based on CDSC feature discretization. It also reports the number of samples per cluster as well as the number of hours that each cluster has been in a specific situation. The durations when the ship was operational were considered in simulation times and the durations when the ship was non-operational for any reason were not included in the simulation.
Table 12. The validated clusters for performing maintenance activities.
4.7.3. Rank the clusters for maintenance activities
The criterion for carrying out maintenance activities is when the ship has a failure state. Therefore, the cluster numbers zero, one, two, five, six, eight and thirteen – which had no samples in the failure state (the cluster with intact situation 0) – were not included in Table . On the other hand, calculating the priority of performing maintenance activities is based on the healthy rate of the cluster. Any cluster with a lower healthy rate will have higher priority for maintenance. This rate is obtained by Equation (1):
(1)
(1)
where
is the healthy rate,
is the number of samples in the cluster, and
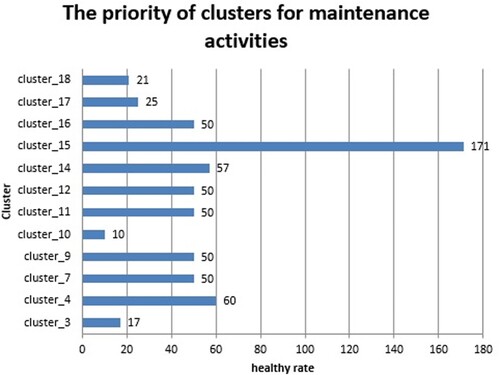
is the samples recorded in the failure status of the cluster. Based on the aforementioned information, the clusters 10 and 15 have the highest and lowest priority, respectively. Figure displays the priority of clusters for maintenance.
Figure 8. The priority of clusters for maintenance.
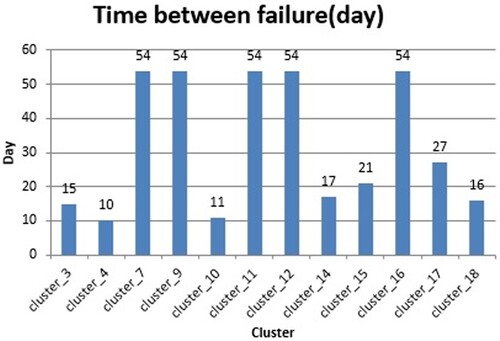
4.8. Determine the mean-time between failures in each cluster
Figure shows the time between failures (in days) in each cluster. For example, cluster 3 has 375 h of simulation time and it was out of service for 21 h. Thus, it is available to operate for 354 h. If we divide 354 h by 24 h of a day, we obtain an approximate number of 15 days, that indicates the mean number of available days.
Figure 9. The time between failures (in days) in each cluster.
4.9. Optimal features selection in each cluster and features ranking to maintenance activities
According to the previous step, cluster 10 has the highest priority for maintenance. The greedy-search algorithm is used to search any features for elimination. Therefore, features selection is performed by utilising the removal algorithm with a backward strategy. Finally, the classification accuracy is measured and evaluated by the neural network (selected classifier) and Kappa coefficient. Table presents the ranking of features in clusters 10 by considering the CDSC label.
Table 13. Ranking of features in cluster 10 by considering the CDSC label.
4.10. Design a decision support system dashboard
A decision support system dashboard is designed to help ship operators with predictive maintenance decisions and provide them recommendations about spare parts requirements for repair services. This system can handle complex maintenance tasks and operations and seamlessly automate repair workflows. However, creating such system requires information from human experts and computer programmes that use ML technology. Table gives some technical recommendations on how to examine different parts of the ship propulsion system and what underlying causes may be resulting in system failure.
Table 14. Technical recommendations on the examination of ship propulsion system.
Figure illustrates the graphical user interface (GUI) of the decision support system designed for this research. By searching the features in the interface, some technical suggestions are given on spare parts requirements for the repair or replacement services.
Figure 10. The graphical user interface (GUI) of the decision support system.
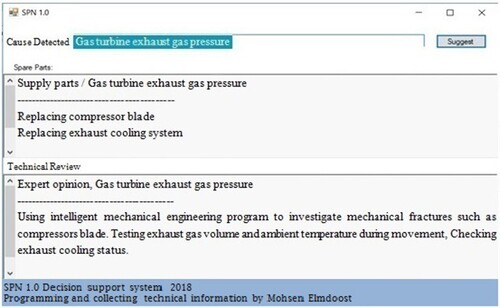
The GUI was designed by the PHP programming language and MySQL. The capabilities of our GUI software are high compatibility with Windows versions, being web based, capability of auto-suggestion, high search speed, and the ability to visualise the processes and provide technical suggestions for set up, repair, and replacement of the parts.
4.11. Procurement planning of spare parts
Table presents an example of the number of spare parts required to be supplied based on the priority of each attribute.
Table 15. Procurement planning of spare parts.
5. Conclusion and future research
This study proposed a machine learning (ML) method to predict the average time between failures, rank and prioritise condition-based maintenance (CBM) activities and plan spare parts supply for a combined diesel electric and gas propulsion system in ship vessels. The system status was determined by estimating instantaneous time-to-failure and then a maintenance action was carried out to prevent unexpected shutdowns. We used two methods including a supervised learning method and an unsupervised learning method to analyse the data. The performance and benefits of using ML technology in turbine and compressor degradation modelling were evaluated. It was found that the ML model reduced the root mean square error of time-to-failure predictions whilst identifying the root causes of failure and providing an appropriate response time through data dimensionality reduction. The data dimensionality reduction resulted in performing the analysis only on the effective features. The method also analysed the priority of addressing the cluster and specifying the priority for failure causes in each cluster. The most common causes of failure were found to associate with compressor and gas turbine.
The proposed method showed a basic and academic process that can be used in the commercial field by defining new policies and making some adjustments in the implementation process. To illustrate the results obtained from the clusters, experts’ opinions were elicited. A decision support system in the form of supplementary software was also designed to provide recommendations on spare parts inventory management and technical issues. This system can support ship operators in evaluating the system performance based on the analysis of condition monitoring data. Finally, a plan was proposed for the spare parts procurement, based on the lead time information, the expected demand, and the priority of components. By finding the priority of the features and the results obtained from the clustering algorithm, we analysed the potential problems related to components such as motor, gearbox, or lubrication, and then proposed some solutions for CBM.
The followings are some recommendations for future research:
To develop a more comprehensive planning for maintenance as well as unified procurement planning of spare parts in the entire ship system, more features from different ship components (such as ship rudder and steerage, fuel, lubrication, motor-cooling system, compressed air) can be investigated in the future. For this purpose, more data must be collected to examine the features related to other components in the system.
As each cluster provided various priorities for different features, to prioritise the execution of maintenance tasks, it is essential to propose a method that can address the order as well as priority of the features in all the clusters simultaneously.
Procurement planning of spare parts can be carried out by considering the quantity of spare parts in each cluster and priority of each attribute and frequency of failures of each attribute.
Many industrial plants collect data from historical databases such as work orders and equipment downtime. By combining the ANN methodology with text mining approaches as proposed in Arif-Uz-Zaman et al. (Citation2017), an accurate estimation of times to failure can be provided.
By recording the information about failures and using association rules, the relationships between different components of the system can be discovered. It will help to predict more accurately when the next failure is likely to happen, and which part may cause the failure.
By collecting data about the duration of time spent on maintenance activities, cost of repair or replacement, and the cost of spare parts supply, in addition to predicting the budget required for maintenance operations, some suggestions can be made on how to reduce maintenance costs.
Disclosure statement
No potential conflict of interest was reported by the author(s).
Additional information
Notes on contributors
Mohsen Elmdoost-gashti
Mohsen Elmdoost Gashti graduated in MSc Industrial Engineering (Systems Optimization) from University of Tehran, Iran. His research interests include the use of machine learning and data science in intelligent maintenance systems.
Mahmood Shafiee
Mahmood Shafiee is a Professor and Chair of Energy Resilience at the School of Mechanical Engineering Sciences, Director of Surrey's Energy Research Centre (SERC), as well as Fellow of Institute for Sustainability (IfS) at the University of Surrey, UK. His research interests lie in the fields of Sustainable Energy Technologies; Energy Materials and Structures; Risk and Resilience of Energy Systems; Energy Structural Integrity and SHM; Non-Destructive Testing and Evaluation (NDT&E); Inspection and Maintenance; and Sensors; as well as the use of Industry 4.0 Digital Technologies (such as Digital Twins, Internet of Things, and Cyber-Physical Systems) in Smart Energy Grids.
Ali Bozorgi-Amiri
Ali Bozorgi-Amiri is an Associate Professor of Industrial Engineering at the School of Industrial Engineering and Head of Business Process Engineering and Resource Management Research Centre (BPERM) at the University of Tehran, Iran. His research interests lie in the fields of Data-Driven Decision Making, Business Process Redesign, Operations Management, Supply Chain Resilience and Humanitarian logistics. He has published several papers in related filed in refereed journals and conferences.
References
- Ahmadzadeh F, Lundberg J. 2013. Remaining useful life prediction of grinding mill liners using an artificial neural network. Miner Eng. 53:1–8. doi:10.1016/j.mineng.2013.05.026.
- Animah I, Shafiee M. 2021. Maintenance strategy selection for critical shipboard machinery systems using a hybrid AHP-PROMETHEE and cost benefit analysis: a case study. J Marine Eng Technol. 20(5):312–323. doi:10.1080/20464177.2019.1572705.
- Arif-Uz-Zaman K, Cholette ME, Ma L, Karim A. 2017. Extracting failure time data from industrial maintenance records using text mining. Adv Eng Inf. 33:388–396. doi:10.1016/j.aei.2016.11.004.
- Arjomandi MA, Dinmohammadi F, Mosallanezhad B, Shafiee M. 2021. A fuzzy DEMATEL-ANP-VIKOR analytical model for maintenance strategy selection of safety critical assets. Adv Mech Eng. 13(4):1–21. doi:10.1177/1687814021994965.
- Asuquo MR, Wang J, Phylip-Jones G, Riahi R. 2021. Condition monitoring of marine and offshore machinery using evidential reasoning techniques. J Marine Eng Technol. 20(2):93–124. doi:10.1080/20464177.2019.1573457.
- Ayo-Imoru R, Cilliers A. 2018. Continuous machine learning for abnormality identification to aid condition-based maintenance in nuclear power plant. Ann Nucl Energy. 118:61–70. doi:10.1016/j.anucene.2018.04.002.
- Berghout T, Mouss LH, Bentrcia T, Elbouchikhi E, Benbouzid M. 2021. A deep supervised learning approach for condition-based maintenance of naval propulsion systems. Ocean Eng. 221:108525. doi:10.1016/j.oceaneng.2020.108525.
- bin Bandan MI, Bhattacharjee S, Jali SK, Pradhan DK. 2019. Instantaneous mean-time-To-failure (MTTF) estimation for checkpoint interval computation at run time. Microelectron Reliab. 98:69–77. doi:10.1016/j.microrel.2019.04.009.
- Braglia M, Carmignani G, Frosolini M, Zammori F. 2012. Data classification and MTBF prediction with a multivariate analysis approach. Reliab Eng Syst Saf. 97(1):27–35. doi:10.1016/j.ress.2011.09.010.
- Carvalho TP, Soares FA, Vita R, Francisco RDP, Basto JP, Alcalá SG. 2019. A systematic literature review of machine learning methods applied to predictive maintenance. Comput Ind Eng. 137:106024. doi:10.1016/j.cie.2019.106024.
- Cheliotis M, Lazakis I, Theotokatos G. 2020. Machine learning and data-driven fault detection for ship systems operations. Ocean Eng. 216:107968. doi:10.1016/j.oceaneng.2020.107968.
- Çınar ZM, Abdussalam Nuhu A, Zeeshan Q, Korhan O, Asmael M, Safaei B. 2020. Machine learning in predictive maintenance towards sustainable smart manufacturing in industry 4.0. Sustainability. 12:8211. doi:10.3390/su12198211.
- Coraddu A, Oneto L, Ghio A, Savio S, Figari M, Anguita D. 2015. Machine learning for wear forecasting of naval assets for condition-based maintenance applications. In: Proceedings of the international conference on electrical systems for aircraft, railway, ship propulsion and road vehicles. Aachen, Germany. doi:10.1109/ESARS.2015.7101499.
- Coraddu A, Oneto L, Ghio A, Savio S, Anguita D, Figari M. 2016. Machine learning approaches for improving condition–based maintenance of naval propulsion plants. J Eng Mari Environ. 230(1):136–153. doi:10.1177/1475090214540874.
- Chatsirirungruang P. 2010. Application of genetic algorithm and taguchi method in dynamic robust parameter design for unknown problems. The International Journal of Advanced Manufacturing Technology. 47(9-12):993–1002. doi:10.1007/s00170-009-2248-8.
- Das Chagas Moura M, Zio E, Lins ID, Droguett E. 2011. Failure and reliability prediction by support vector machines regression of time series data. Reliab Eng Syst Saf. 96(11):1527–1534. doi:10.1016/j.ress.2011.06.006.
- de Jonge B, Klingenberg W, Teunter R, Tinga T. 2016. Reducing costs by clustering maintenance activities for multiple critical units. Reliab Eng Syst Saf. 145:93–103. doi:10.1016/j.ress.2015.09.003.
- Deris S, Omatu S, Ohta H, Kutar LCS, Samat PA. 1999. Ship maintenance scheduling by genetic algorithm and constraint-based reasoning. Eur J Oper Res. 112(3):489–502. doi:10.1016/S0377-2217(97)00399-8.
- Emovon I, Norman RA, Murphy AJ. 2017. The development of a model for determining scheduled replacement intervals for marine machinery systems. Proce Inst Mech Eng, Part M: J Eng Mari Environ. 231(3):723–739. doi:10.1177/1475090216681345.
- Erozan İ. 2019. A fuzzy decision support system for managing maintenance activities of critical components in manufacturing systems. J Manuf Syst. 52:110–120. doi:10.1016/j.jmsy.2019.06.002.
- Galar D, Thaduri A, Catelani M, Ciani L. 2015. Context awareness for maintenance decision making: A diagnosis and prognosis approach. Measurement (Mahwah N J). 67:137–150. doi:10.1016/j.measurement.2015.01.015.
- Gupta P, Rasheed A, Steen S. 2022. Ship performance monitoring using machine-learning. Ocean Eng. 254:111094. doi:10.1016/j.oceaneng.2022.111094.
- Hosseini S, Kalam S, Barker K, Ramirez-Marquez JE. 2020. Scheduling multi-component maintenance with a greedy heuristic local search algorithm. Soft comput. 24(1):351–366. doi:10.1007/s00500-019-03914-7.
- Hou T-H, Su C-H, Liu W-L. 2007. Parameters optimization of a nano-particle wet milling process using the taguchi method, response surface method and genetic algorithm. Powder Technol. 173(3):153–162. doi:10.1016/j.powtec.2006.11.019.
- Huang R, Xi L, Li X, Liu CR, Qiu H, Lee J. 2007. Residual life predictions for ball bearings based on self-organizing map and back propagation neural network methods. Mech Syst Signal Process. 21(1):193–207. doi:10.1016/j.ymssp.2005.11.008.
- İnceişçi, F. K., & Ayça, A. K. (2022). Fault analysis of ship machinery using machine learning techniques. International Journal of Maritime Engineering, 164. doi:10.5750/ijme.v164i1.769.
- Jagtap HP, Bewoor AK, Kumar R, Ahmadi MH, Chen L. 2020. Performance analysis and availability optimization to improve maintenance schedule for the turbo-generator subsystem of a thermal power plant using particle swarm optimization. Reliab Eng Syst Saf. 204:107130. doi:10.1016/j.ress.2020.107130.
- Karatuğ Ç, Arslanoğlu Y, Soares CG. 2023. Review of maintenance strategies for ship machinery systems. J Marine Eng Technol. doi:10.1080/20464177.2023.2180831.
- Karo IMK, MaulanaAdhinugraha K, Huda AF. 2017. A cluster validity for spatial clustering based on davies bouldin index and polygon dissimilarity function. In: Proceedings of the second international conference on informatics and computing. Jayapura, Indonesia. doi:10.1109/IAC.2017.8280572.
- Karvelis P, Georgoulas G, Kappatos V, Stylios C. 2021. Deep machine learning for structural health monitoring on ship hulls using acoustic emission method. Ships Offsh Struct. 16(4):440–448. doi:10.1080/17445302.2020.1735844.
- Kimera D, Nangolo FN. 2020a. Maintenance optimization for marine mechanical systems. Proc Inst Mech Eng, Part M: J Eng Mari Environ. 234(2):446–462. doi:10.1177/1475090219882601.
- Kimera D, Nangolo FN. 2020b. Predictive maintenance for ballast pumps on ship repair yards via machine learning. Transp Eng. 2:100020. doi:10.1016/j.treng.2020.100020.
- Kimera D, Nangolo FN. 2022. Reliability maintenance aspects of deck machinery for ageing/aged fishing vessels. J Marine Eng Technol. 21(2):100–110. doi:10.1080/20464177.2019.1663595.
- Krenek J, Kuca K, Blazek P, Krejcar O, Jun D. 2016. Application of artificial neural networks in condition based predictive maintenance. In: Recent Developments in Intelligent Information and Database Systems; p. 75–86. doi:10.1007/978-3-319-31277-4_7.
- Kutyłowska M. 2015. Neural network approach for failure rate prediction. Eng Fail Anal. 47:41–48. doi:10.1016/j.engfailanal.2014.10.007.
- Lapa CMF, Pereira CMN, de Barros MP. 2006. A model for preventive maintenance planning by genetic algorithms based in cost and reliability. Reliab Eng Syst Saf. 91(2):233–240. doi:10.1016/j.ress.2005.01.004.
- Lazakis I, Dikis K, Michala AL, Theotokatos G. 2016. Advanced ship systems condition monitoring for enhanced inspection, maintenance and decision making in ship operations. Transp Res Procedia. 14:1679–1688.
- Lazakis I, Ölçer A. 2016. Selection of the best maintenance approach in the maritime industry under fuzzy multiple attributive group decision-making environment. Proc Inst Mech Eng, Part M: J Eng Maritime Environ. 230(2):297–309. doi:10.1177/1475090215569819.
- Lazakis I, Raptodimos Y, Varelas T. 2018. Predicting ship machinery system condition through analytical reliability tools and artificial neural networks. Ocean Eng. 152:404–415. doi:10.1016/j.oceaneng.2017.11.017.
- Li X, Ding Q, Sun J-Q. 2018. Remaining useful life estimation in prognostics using deep convolution neural networks. Reliab Eng Syst Saf. 172:1–11. doi:10.1016/j.ress.2017.11.021.
- Liao H, Elsayed EA, Chan L-Y. 2006. Maintenance of continuously monitored degrading systems. Eur J Oper Res. 175(2):821–835. doi:10.1016/j.ejor.2005.05.017.
- Liao W, Yang X. 2017. Parallel machines scheduling problem with maintenance using greedy algorithm. In: Proceedings of the international conference on industrial engineering and engineering management, Singapore. doi:10.1109/IEEM.2017.8289965.
- Lu Y, Sun L, Zhang X, Feng F, Kang J, Fu G. 2018. Condition based maintenance optimization for offshore wind turbine considering opportunities based on neural network approach. Appl Ocean Res. 74:69–79. doi:10.1016/j.apor.2018.02.016.
- Nguyen G, Dlugolinsky S, Bobák M, Tran V, García ÁL, Heredia I, Malík P, Hluchý L. 2019. Machine learning and deep learning frameworks and libraries for large-scale data mining: a survey. Artif Intell Rev. 52(1):77–124. doi:10.1007/s10462-018-09679-z.
- Ochella S, Shafiee M, Sansom C. 2021. Adopting machine learning and condition monitoring PF curves in determining and prioritizing high-value assets for life extension. Expert Syst Appl. 176:114897. doi:10.1016/j.eswa.2021.114897.
- Ouyang K, Wu H-W, Huang S-C, Wu S-J. 2017. Optimum parameter design for performance of methanol steam reformer combining taguchi method with artificial neural network and genetic algorithm. Energy. 138:446–458. doi:10.1016/j.energy.2017.07.067.
- Pascual DG. 2015. Artificial intelligence tools: decision support systems in condition monitoring and diagnosis. 1st ed. CRC Press.
- Repository, U. I. M. L. 2014. Condition based maintenance of naval propulsion plants data set. http://archive.ics.uci.edu/ml/datasets/condition(based(maintenance(of(naval(propulsion(plants.
- Rohani A, Abbaspour-Fard MH, Abdolahpour S. 2011. Prediction of tractor repair and maintenance costs using artificial neural network. Expert Syst Appl. 38(7):8999–9007. doi:10.1016/j.eswa.2011.01.118.
- Rostami M, Berahmand K, Forouzandeh S. 2021. A novel community detection based genetic algorithm for feature selection. J Big Data. 8(1):1–27. doi:10.1186/s40537-020-00398-3.
- Saon S, Hiyama T. 2010. Predicting remaining useful life of rotating machinery based artificial neural network. Comput Math Appl. 60(4):1078–1087. doi:10.1016/j.camwa.2010.03.065.
- Sharma S, Agrawal J, Agarwal S, Sharma S. 2013. Machine learning techniques for data mining: A survey. In: Proceedings of the international conference on computational intelligence and computing research. Enathi, India. doi:10.1109/ICCIC.2013.6724149.
- Susto GA, Schirru A, Pampuri S, McLoone S, Beghi A. 2015. Machine learning for predictive maintenance: A multiple classifier approach. IEEE Trans Ind Inf. 11(3):812–820. doi:10.1109/TII.2014.2349359.
- Thomas JCR, Peñas MS, Mora M. 2013. New version of Davies-Bouldin index for clustering validation based on cylindrical distance. In: Proceedings of the 32nd International Conference of the Chilean Computer Science Society, 11-15 November 2013, Temuco, Chile.
- Tian Z. 2012. An artificial neural network method for remaining useful life prediction of equipment subject to condition monitoring. J Intell Manuf. 23(2):227–237. doi:10.1007/s10845-009-0356-9.
- Tsaganos G, Nikitakos N, Dalaklis D, Ölcer AI, Papachristos D. 2020. Machine learning algorithms in shipping: improving engine fault detection and diagnosis via ensemble methods. WMU J Maritime Aff. 19(1):51–72. doi:10.1007/s13437-019-00192-w.
- Vachtsevanos G, Lewis FL, Roemer M, Hess A, Wu B. 2006. Intelligent fault diagnosis and prognosis for engineering systems. Wiley Hoboken; p. 456. ISBN: 978-0-471-72999-0.
- Vintr Z, Vintr M. 2011. An assessment of mean time between failures for a group of rolling bearings. In: Proceedings of the International Conference on Quality, Reliability, Risk, Maintenance, and Safety Engineering, 17-19 June, Xi'an, People’s Republic of China.
- Wu S-j, Gebraeel N, Lawley MA, Yih Y. 2007. A neural network integrated decision support system for condition-based optimal predictive maintenance policy. IEEE Trans Systems, Man, and Cyber-Part A: Syst Hum. 37(2):226–236. doi:10.1109/TSMCA.2006.886368.
- Wuest T, Weimer D, Irgens C, Thoben K-D. 2016. Machine learning in manufacturing: advantages, challenges, and applications. Prod Manuf Res. 4:23–45. doi:10.1080/21693277.2016.1192517.
- Yang J, Honavar V. 1998. Feature subset selection using a genetic algorithm. In: Liu H., Motoda H., editor. Feature extraction, construction and selection: A data mining perspective. p. 117–136.
- Zhang M, Kujala P, Hirdaris S. 2022. A machine learning method for the evaluation of ship grounding risk in real operational conditions. Reliab Eng Syst Saf. 226:108697. doi:10.1016/j.ress.2022.108697.
- Zhang W, Yang D, Wang H. 2019. Data-Driven methods for predictive maintenance of industrial equipment: A survey. IEEE Syst J. 13(3):2213–2227. doi:10.1109/JSYST.2019.2905565.