
Abstract
Background: Brain development in early childhood is a key determinant of later cognition, social achievement and educational success. Head circumference (HC) measurements are a simple method to assess brain growth, yet reports of these measurements are uncommon in nutritional surveys of undernourished children.
Objective: To evaluate HC measurements in a population of rural Nepali children and relate these measurements to demographics, health and diet.
Methods: An observational study of head growth was nested within a longitudinal evaluation of a livestock-based agricultural intervention in rural Nepal. Between 538 and 689 children (aged 6 months to 8 years) were measured (height, weight, HC) at each of six survey visits. A total of 3652 HC measurements were obtained. Results were converted to Z-scores (WHO Anthro).
Results: Mean head circumference Z-scores (HCZ) diminished progressively over the first 4 years of life; a decline of 30% occurred between 3 and 4 years of age (−1.73 to −2.45, P < 0.0001). Overall, 56% of HCZ were <−2. Gender-adjusted HCZ (but not other measurements) were significantly lower for girls than boys [mean (SD) −2.31 (1.0) vs −1.99 (0.094), P < 0.0001]; girls more often had microcephaly (61% vs 50%, P < 0.0001). For children <3 years of age, HCZ were better in those who had eaten two or more animal-source foods (ASFs) within the previous 24 h [−1.69 (.05) vs −2.08 (0.10), P = 0.001] than in those who had eaten none or only one; HCZ correlated with the number of ASFs consumed (P < 0.001). Regression analyses demonstrated that the main determinants of HCZ were age, weight-for-age Z-scores (WAZ) and gender; 43% of the variance in HCZ in younger children was explained by WAZ and ASF consumption.
Conclusion: HCs reflect brain size in young children; brain size is linked to cognitive function. Poor head growth represents another facet of the ‘silent emergency’ of child undernutrition. Routine HCZ assessments may contribute to better understanding of the links between poverty and cognitive development.
Introduction
Brain size relates to functional abilities. Children with microcephaly may exhibit significant cognitive and behavioural impairment, including disorders of personality, social behaviour and executive function (planning and decision-making).Citation 1 − Citation 3 Such difficulties may not be fully manifest until adolescence or young adulthood, as shown for example in India, South Africa and Chile.Citation 4,5 Brain development in early childhood is therefore a key determinant of later cognition, social achievement and educational success.Citation 4 − Citation 15 Poor brain growth may result from adverse prenatal exposures (such as maternal use of alcohol), intrauterine growth retardation and/or prematurity, birth asphyxia, environmental deprivation, undernutrition, micronutrient deficiencies and other factors. Such exposures affect brain size and function. All forms of undernutrition, particularly lack of dietary animal-source foods and other key nutrientsCitation 13,16 − Citation 19 can impair brain growth and function in young children. During the period of most rapid brain growth (from the last trimester of pregnancy to the first 9–12 months of life), undernutrition can specifically inhibit brain size, reduce brain DNA content, and impair myelinisation, cortical dendritic growth and neurotransmitter content.Citation 20 − Citation 22 Some of these changes may be permanent, even if other factors (food intake, health and other environmental influences) later improve. Except under rare circumstances (such as craniofacial malformations, severe rickets), head circumference (HC) relates directly to brain size, brain protein and DNA content and number of neurons.Citation 20
Therefore, in conjunction with age-specific measures of height, weight and mid-upper arm circumference (MUAC), HC measurements provide a useful index to the health and well-being of children, and may also suggest patterns of child cognitive and developmental status. Health policy-makers must recognise the importance of brain growth in young children as a crucial public health concern. However, little is known about longitudinal measures of head growth in undernourished populations, or about the relationship of HC to child health, child diet, other anthropometric measures or other demographic factors.
Numerous studies have documented the poor growth of Nepali children, especially in rural areas. According to the 2011 Nepal Demographic and Health Survey, the nutritional status of Nepali children is extremely poor. Roughly 41% of children were stunted (reflecting inadequate nutrition over a long period of time and/or recurrent or chronic illness) and 11% were wasted (reflecting acute undernutrition linked to severe illness and/or serious food deprivation).Citation 23,24 However, there have been only a few published reports describing the head growth of Nepali children rather than their ponderal or linear growth; most of these describe urban, better-nourished populations.Citation 25 − Citation 27 Therefore, to better understand the patterns of head growth in a population with a high rate of undernutrition, a longitudinal assessment of HC measurements among a group of young rural Nepali children was conducted. These findings were then related to other growth parameters, child health, diet and other child and household characteristics.
Methods
Study design
This observational study of head growth was nested within a comprehensive 48-month longitudinal evaluation of the efficacy of a livestock/community development intervention on household characteristics and child growth, including a planned analysis of HC as a primary outcome. The intervention was provided by Heifer International Nepal; the intervention did not specifically address child health, growth or nutrition. As part of this larger study, growth measurements were obtained from all children aged 6 months to 8 years within each participating household. During the first 24 months of observation, the prevalence of microcephaly (HCZ<–2) was found to be 53%.Citation 28
The study was conducted in three districts of Nepal, in the Terai (Chitwan, Nawalparasi) and hills (Nuwakot) regions. The project areas are largely populated by low-income subsistence farmers. For the purposes of this study, three pairs of comparable communities in each district were matched on the basis of geographical location (including altitude), size, local natural resources, employment opportunities, availability of health care, type of agriculture practiced and other demographic features (predominant castes, family income and educational levels). A staggered intervention design was used, with paired communities randomly assigned to receive Heifer development activities either starting after the baseline survey (Group One) or 12 months later [T12 (time 12 months after baseline)] (Group Two). Group One communities thus participated in Heifer community development activities throughout the entire 48 months. Group Two communities participated in Heifer activities for 36 months.
The intervention consisted of a programme of participatory community development activities led by Heifer field staff, focused on tools for poverty alleviation, citizen empowerment and community development. These activities were based in women’s self-help groups which met weekly or biweekly with trained facilitators and with a strong focus on optimisation of livestock management. At the conclusion of the initial 12-month curriculum, each participating household received one or two goats. Notably, the Heifer training curriculum did not specifically address child nutrition, growth or health. Details of the intervention have been described elsewhere.Citation 28
Household surveys and child anthropometry were conducted at baseline and at 6, 12, 18, 24 and 48 months (T6, T12, T18, T24 and T48 months). The survey consisted of a 116-item questionnaire completed with the female head of household or her designee and based on standardised tools developed by ‘Measure DHS’, specifically the version used in the Nepal Demographic and Health Survey.Citation 29 Data collection was undertaken by an independent local field-research NGO (Nepal Technical Assistance Group). Supervisors monitored the performance and activities of the enumerators, and conducted daily reviews of the data collection. Enumerators were trained for 4 days at the beginning of the project, followed by field pilot testing in three non-participating villages. Ongoing refresher training and quality control activities were provided to monitor and maintain inter-observer reliability.
Participants
Child age was determined by inspection of birth certificates. Growth measurements were obtained for all children aged between 6 months and 8 years in the participating households. Children who met the age criteria were enrolled in the study at the first visit at which they were eligible. All enrolled children were followed for the duration of the study. For some analyses, children were classified into the following age groups: 6–12, 13–24, 25–36, 37–48, 49–60, 61–72, 73–84 and >84 months. The groups of particular interest were 6–36 months as head growth is most rapid during this time and children in this age range have the highest risks of morbidity, mortality and nutritional compromise.Citation 9,22,30,31 Children with obvious physical or neurological disabilities (e.g. cleft lip, cerebral palsy, Down syndrome) were excluded. Anthropometric measurements were deferred if children had severe illness at the time of the survey.
Anthropometry
The primary outcome of this investigation was child HC measurement. This measurement was evaluated in the context of the child’s other growth parameters, particularly weight and height. Weight was measured with Seca 354 electronic scales (Hamburg, Germany) accurate to 10 g. Before each measurement, scales were calibrated using standardised weights. Supine lengths were obtained for children <3 years (using a Seca BabyMat 210) and standing heights for those >3 years (barefoot and with the head in the auriculo-orbital plane using a portable Seca 213 stadiometer accurate to three mm). MUAC was measured with disposable insertion tapes accurate to 1 mm (Harlow Printing) midway between the tip of the olecranon and acromion processes. HC was measured with disposable paper tapes at the maximum occipito-frontal measurement. For each growth parameter, measurements were obtained twice and the results averaged. In accordance with World Health Organization standards, if results of HC measurements were more than five mm discrepant, a third measurement was obtained and the outlier discarded.Citation 32 Results were converted to gender-specific Z-scores using WHO Anthro and Anthro Plus (WHO, version 3.2.2).Citation 33 The WHO Anthro Plus programme does not include HC calculations for children >61 months of age. Therefore, for HCs of children in this age range, Z-scores were calculated using means and standard deviations derived from Nellhaus curves for boys and girls.Citation 31 These curves were established using measurements compiled from populations of African-American, Japanese, Alaskan Eskimo and Caucasian children (from Scotland, Philadelphia, Belgium, Switzerland, England, Sweden, Finland and Czechoslovakia). Although South Asian children were not included in the development of these curves, this standard has been widely accepted for international use.Citation 34 The prevalence of stunting, wasting and microcephaly was determined according to World Health Organization standardsCitation 32 (measurements <−2 standard deviations (SD) for age (comprising the lowest 2.3% of the population). This definition for microcephaly is also endorsed by the American Academy of Neurology and other authorities.Citation 35,36
Child health
Morbidity related to fever, diarrhoea or respiratory symptoms was also assessed. After community-based pilot testing, a health score was devised which reflected the presence or absence of these symptoms during the previous 2 weeks for each child, as reported during a standardised interview with the child’s mother at each survey time. The health score was tested for both inter-rater and test–retest reliability in field testing prior to use in the study. In addition, detailed interviews were conducted with participants in pilot tests to ascertain reliability of the questions used in the final survey instrument. Field supervisors also re-interviewed a subset of 20% of respondents regarding child health symptoms during each survey to verify responses. To ensure validity, results were compared with those obtained in the national Nepal Demographic and Health SurveyCitation 23 and were within the reported confidence intervals. For some analyses, these scores were dichotomised as ‘worse’ (for children with two or more illnesses in the past 2 weeks) or ‘better’ (no or only one illness in the past 2 weeks).
Child diet
Dietary information was available at the baseline, T12, T24 and T48-month surveys. Child diet was assessed by asking the mother to recall whether or not the child had consumed each of 17 different food groups within the previous 24 h. Although 24-h recall is not a perfect survey instrument and might not accurately measure foods consumed occasionally, the survey methods were designed to be as exact as possible. Detailed interviews were conducted with participants in pilot tests to ascertain accuracy; during field surveys, supervisors re-interviewed a subset of survey participants to maintain quality. The total number of animal-source foods consumed by the child during the previous 24 h was calculated. For some analyses, the food groups which comprised animal-source foods (e.g. milk or other dairy products, eggs, fish, meat or offal) were aggregated. The results were dichotomised into two categories: ‘yes’ if the child had consumed any of these food items and ‘no’ if not.
Statistical analysis
Data were entered and analysed using JMP 8.1 (SAS, Cary, NC). Analyses included descriptive statistics as well as t-tests and ANOVA with Bonferroni post hoc tests to correct for multiple comparisons (e.g. analysis of HCZ and age, location of residence, health and ASF consumption), a series of χ 2 tests (e.g. analysis of gender and ASF consumption), correlations [height-for-age Z score (HAZ), WAZ, HCZ], calculations of variance inflation factors to assess colinearity (e.g. of growth measurements) and multiple regression analyses (e.g. HCZ and individual child characteristics). Dependent variables (child gender, age, dietary consumption of ASF, health scores) were evaluated with histograms to verify normal distributions. Child HCs were also analysed in relation to secondary variables including region, assignment to Group One or Group Two and other household characteristics (socio-economic status, maternal education, household land and animal ownership). Results are shown for each survey time (538–689 HC measurements) and/or for the entire data-set (3652 HC measurements).
Ethics
The 48-month longitudinal study was approved by the Nepal Health Research Council (NHRC, Reference #845, Renewal #1496), the human investigation review board in Nepal endorsed by the Office of Protection Office for Human Research Protections and the United States Department of Health and Human Services.Citation 37 All clinical investigation was conducted according to the principles expressed in the Declaration of Helsinki. Parents gave permission for their children to be included in the investigation. For literate parent respondents, informed written consent was obtained prior to each visit. For non-literate parent respondents, informed verbal consent was obtained prior to each family visit, witnessed by a third party, according to the guidelines of the NHRC. At each visit, participants were reminded that they could withdraw from the study, discontinue the study visit or decline to answer any or all questions or decline measurement of their children. Coded, confidential files were maintained to document consent. The consent procedure was approved by the NHRC.
Results
Anthropometric measurements
Between 538 and 689 children were measured at each of the six survey visits, resulting in a total of 3652 HC measurements. The age of the children ranged from 6 months to 12 years [mean (SD) 64.0 (32.6) months]. Children in the project areas were generally undernourished (Table ), with mean Z-scores <−1 for all parameters measured.
Table 1 Anthropometric Z-scores
Distribution of HCs by age and age group
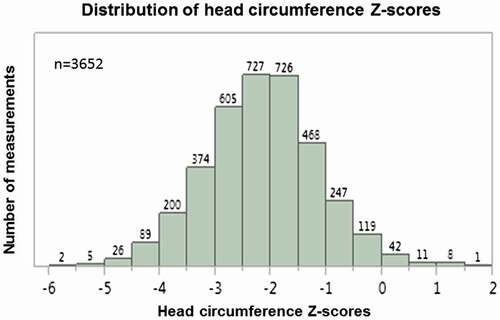
At each of the six surveys and for the pooled data-set of 3652 measurements, HCZ scores were normally distributed (Fig. ). The range, mean and standard deviations of these distributions were notably similar at each survey time (Table ); the differences probably reflected in part the different distribution of ages of the children at each survey time. No relation to seasonality was noted. The measurements of HC were internally consistent (measurements for each individual correlated over time). Each child’s baseline measurements correlated strongly to those obtained at the follow-up surveys (conducted at T6, T12, T18, T24 and T48 months after baseline (r 2 = 0.64, 0.47, 0.56, 0.46 and 0.51, respectively, all P < 0.001). Overall, 56% of children had HCZ scores <−2 (Table ).
Figure 1 Distribution of HC Z-scores (n = 3652). The pooled HCZ scores are plotted against the number of measurements obtained, demonstrating a normal distribution.
HCZ scores correlated modestly but significantly to the child’s age at every survey time, with r 2 values of 0.10 to 0.30 (p<0.001, data not shown– < 0.0001, data not shown). When analysed by age group (Fig. ), HCZ scores gradually declined over the first 3 years of age. However, between 3 and 4 years of age, mean HCZ declined abruptly by 30% (−2.45, compared with −1.73 for children aged 2–3 years, P < 0.0001). For older children, the mean HCZ remained in this range (−2.20 to −2.31). Thus, a progressive decline was observed for HCZ during the first 4 years of life, with the most dramatic reduction noted between the ages of 3 and 4 years. No recovery from this decline was noted when children were evaluated at older ages (up to 12 years of age), nor was there any further reduction. HAZ and WAZ also declined over this time period, but the patterns differed from that of HCZ. Mean HAZ declined from −0.60 among the youngest children (6–12 months age group) to −1.27 (13–24 months age group) to −1.41 (25–36 months age group), but no further reduction (or recovery) thereafter was noted. In contrast, mean WAZ declined sharply between the ages of 6–12 months and 13–24 months (−1.49 to −2.32), but then improved, and this improvement persisted in the older children. Thus, the most marked reduction in HCZ occurred when HAZ had ‘stabilised’ and WAZ was improving.
Figure 2 Anthropometric Z-scores by age group. Z-scores for height (dark grey), weight (light grey) and HC (black) are shown by age group and gender. The solid lines show results for boys and girls together; results for girls are shown in the dashed lines, for boys in the dotted lines. Results for each age group (indicated for HAZ by b, for HCZ by d, for WAZ by f and g) were compared with that of the youngest children (indicated for HAZ by a, for HCZ by c, for WAZ by e). For clarity, only the P-values for boys and girls together are shown. For both height-for-age Z-score (HAZ) and head circumference-for-age Z-score (HCZ), results for children in older age groups were significantly lower (P < 0.0001) than for the children in the youngest age group (6–12 months). For weight-for-age Z-score (WAZ), older children also had significantly lower measurements than younger children (6–12-month-olds compared with 13–24-month-olds and 25–36-month-olds, P < 0.0001; 6–12-month-olds compared with the older age groups, P < 0.001).
Next, HCZ scores were compared in individuals over time, from the baseline to the endline survey (4 years later, T48). Of the 419 children with measurements available at both time points, 35% had Z-scores which improved by >0 to +1 and 6% improved by >+1, while 48% had Z-scores which declined by <0 to −1 and 11% declined by >−2.
HC and relationship to gender
Both boys and girls showed the same pattern of decline with age (Fig. ). At every survey time, using gender-specific calculations, boys had better HCZ scores than girls (Table ). Accordingly, girls more frequently had mean HCZ scores in the range of microcephaly (<−2) (Table ). Notably, such gender-based differences were not seen for WAZ or HAZ (Fig. ).
HC and other anthropometric measurements
HCZ scores correlated to some extent with other growth measurements. The strongest relationship was with WAZ (r 2 0.21, P < 0.001). Correlations with HAZ, WHZ and MUAC Z-scores were less robust (r 2 0.11–0.12). A strong correlation was noted between HAZ and WAZ (r 2 0.51, P < 0.001). Multiple regression analysis showed that gender, WAZ and age accounted for 26% of the variance in HCZ while HAZ did not contribute (Table ). After WAZ was excluded from the model, age, gender and HAZ were all significant predictors of HCZ, but together accounted for only 11% of the variance in this measurement (data not shown).
Table 2 HCZ related to gender, age and other anthropometric measurements
Relationship between HCZ and child health
The relationship between HCZ and child health was then evaluated. Health scores related to child age, younger children generally having worse health [46.3 (30.2) vs 68.2 (33.4) months, P < 0.001]. In children aged <3 years (in whom illness was more frequent), those with worse health scores had lower HCZ than those with better health scores [−1.91 (0.08) vs −1.64 (0.04), p = 0.006]. When children of all ages were included in the analysis, health scores did not relate to HCZ.
Relationship between HCZ and child diet
Because dietary protein has been linked to brain growth, the relationship between consumption of ASF and HCZ was then examined. ASF consumption did not vary with age. HCZ were better in children <3 years of age who had eaten more than two ASFs within the previous 24 h [−1.69 (0.05) vs −2.08 (0.10), p = 0.001] than in those who had eaten none or only one (Table ). Moreover, mean HCZ in these younger children related to the aggregated number of ASFs consumed (P < 0.001, Fig. ).
Table 3 HCZ related to ASF consumption by age group
Figure 3 Number of animal-source foods consumed and HCZ. In children aged <36 months, the number of animal-source foods consumed related to HCZ (P < 0.0001).
Regression analysis demonstrated that ASF consumption contributed to HCZ scores in children <3 years of age but not for those >3 years of age (Table ).
Table 4 ASF consumption and HCZ
HCZ and other household characteristics
Other factors which could influence head growth were examined, including region of residence (hills or Terai). Children living in the Terai had slightly (but significantly) better HCZ scores than those in the hills [−2.11 (1.02) vs −2.20 (0.96), p = 0.005]. HAZ and WAZ were also significantly better in children living in the Terai [respectively, −1.09 (1.06) vs −1.81 (1.14), P < 0.0001, and −1.75 (1.06) vs −2.07 (1.12), P < 0.0001]. There was no relationship between HCZ and whether the child lived in a household that participated earlier in the Intervention (Group One vs Group Two) or to the mother’s level of education, family socio-economic status or the amount of land or number of animals owned by the family (data not shown).
Discussion
Undernutrition is common in disadvantaged rural communities. The effects of undernutrition on height and weight are well known. However, less is known about the effect on head growth as few large-scale nutritional surveys assess this important indicator of child well-being or its relationship to health, diet or other demographic factors. In this longitudinal survey of rural Nepali children, 56% of HCZ scores were <−2, meeting criteria for the diagnosis of microcephaly. The general pattern was of a progressive reduction in HCZ scores over the first 4 years of life, with much of the decline seen between the ages of 3 and 4 years (decrease from mean HCZ of −1.73 to −2.45, a 30% reduction, P < 0.0001). After 4 years of age, the mean HCZ stabilised at <−2 with no further decline or improvement noted. This pattern is consistent with growth impairment related to prenatal nutritional deprivation followed by postnatal undernutrition. The lag is similar to that seen for declining HAZ in undernourished populations (including the population reported here), although the decline in HCZ occurred ~9 months later. This may reflect differences in the typical trajectories of these parameters and/or the effect of dietary or other deficiencies at various times.
There have been few longitudinal studies of HC in undernourished populations, although small HCs in Nepali children have been documented previously. For example, a previous study of 600 Nepali infants born at Manipal Hospital, Pokhara found that the percentage with HC measurements <33 cm (corresponding to HCZ −1.32 for boys and −1.11 for girls) varied between ethnic groups, from 0 (Gurung, Nepali ethnic group) to 80% (Dalit, socially discriminated group as lowest caste).Citation 25 In one of the few longitudinal studies, HCs of undernourished children in South Africa progressively worsened over 15 years (2–8 cm less than well nourished children).Citation 14 The authors concluded that ‘suboptimal HC may be the most sensitive physical index of prolonged undernutrition during infancy’.Citation 14,15 In contrast, among 38 severely malnourished Nigerian infants followed for 5 years after hospital discharge, the percentage with HC measurements <3rd percentile (using the Nellhaus charts) decreased from 42% to 17%, coincident with a reduction in the proportion of underweight children from 76% to 31%.Citation 38 Few children, however, achieved HCs greater than the 50th percentile.
Some longitudinal studies of HC in malnourished populations are nested within research on the effects of micronutrient supplementation on child growth. For example, Nepali children whose mothers took prenatal micronutrient supplements had larger HCZs (by 2.4 mm) at 2–3 years of age.Citation 39 Also, in a 1-year observational study in Nepal of 569 children aged 4–17 months, HCZ declined to a lesser extent in those who received oral zinc supplements (−0.56 vs −0.73 with placebo).Citation 40 Retrospective studies have likewise linked HCZ to early nutritional status. For example, 60% of Chilean 18-year-olds with HCZ <−2 suffered undernutrition during the first year of life.Citation 4,41 Although the links between specific diets and linear and ponderal growth are widely recognised,Citation 42,43 less is known about the specific effects of diet (particularly those containing animal-source foods) on HC growth. In two examples, HC measurements were decreased in young Dutch children who ate a macrobiotic dietCitation 44 or increased in American infants given puréed beef vs iron-fortified cereal as their first complementary food.Citation 45 However, such changes have not been found consistently.Citation 18 Among the rural Nepali children described here, HCZ related to whether or not the child had eaten ASF (a proxy for overall diet quality) within the previous 24 h.
Regression analyses demonstrated that the main determinants of HCZ were age, WAZ and gender, but, in younger children, 43% of the variation in HCZ was explained by WAZ and consumption of ASFs. These relationships were not surprising. Age clearly contributes to HCZ, similar to the effect on linear growth of longer exposure to poor nutrition and other environmental factors.Citation 7,14,46 Others have found a relationship between HCZ and weight (as a proxy for overall food intake),Citation 47 − Citation 49 although this association may vary among different ethnic groups.Citation 49 HCZ also usually correlates with height measurementsCitation 4,50 but this relationship is not robust and was not seen in this study after accounting for WAZ. It is possible that this relationship may not apply to undernourished populations in whom the patterns and timing of growth may differ from normal.Citation 51 The relationship described here between WAZ and HCZ suggests the possibility that similar factors affect both of these growth parameters. Correspondingly, in malnourished Australian aboriginal children, Skull et al. showed a significant association between microcephaly and wasting, but not age, sex or stunting.Citation 52 Evidently, biological processes which regulate brain growth may not be identical to those which regulate linear or ponderal growth; different inputs may be required, and the critical periods for these inputs may also differ.
Longitudinal studies of premature infants provide some insights into the relationship between microcephaly and other anthropometric measurements. For example, follow-up studies of low-birth weight neonates in India demonstrate that microcephaly increases during the first year of life, while the incidence of stunting, underweight and wasting decreases.Citation 53 Nearly one-third of children remained microcephalic at 2 years of age.Citation 54 Notably, among premature infants, nutritional status at particular critical periods related to head size as well as to later developmental status. Early energy deprivation (<85 kcal/kg/day) directly related to slower head growth and lower developmental scores at 1 year of corrected age.Citation 55 Specifically, the first 10 days of life represented a ‘critical period’ for nutritional intake in terms of promotion of HC catch-up growth and later functioning.Citation 56,57 Identification of similar ‘critical periods’ for nutritional inputs in relation to head growth in full-term infants and older children – particularly those who are undernourished – is incompletely understood. Although postnatal-onset microcephaly has a generally unfavourable prognosis, some children with this condition have normal developmental abilities when tested in early childhood (especially if somatic growth is maintained).Citation 58 In general, postnatal brain growth to at least 9 years of age has been shown to be more important than foetal growth in determining cognitive function in middle childhood.Citation 59
A significant gender imbalance was noted in HCZ scores, with girls having lower (gender-adjusted) HCZ across age groups but not WAZ or HAZ. These gender differences remain unexplained; we are not aware of any previous reports of such differences in HCZ scores in undernourished populations. Some studies have found gender differences in the trajectory of head growth; however, these suggest that girls may achieve maximal head size earlier than boys.Citation 60
The other findings presented here are consistent with previously published reports. For example, health clearly affects growth. Children who suffer frequent infections have worse growth than healthy children.Citation 61 It is therefore not surprising that health is also linked to head growth. The relationship between timing of illnesses and effects on head growth has not been completely explored. However, in healthy children, average head size increases by ~12 cm in the first 2 years of life, and by only an additional ~8 cm over the next 18 years,Citation 31 with some of the increase after ~8 years of age attributable to an increase in the thickness of the skull bones. Thus, infections or other adverse exposures in the first 2 years of life are more likely to have a greater impact on brain growth (in accordance with recent emphasis on the ‘first 1000 days’Citation 62 ). Because growth trajectories in undernourished children are altered,Citation 51 such children may be more susceptible to various adverse influences for longer periods. It was notable in this study that HCZ scores ‘stabilised’ after about 4 years of age, in contrast with HAZ scores which tend to stabilise at 18–24 months of age.Citation 32
In this study of rural Nepali children, World Health Organization standards were used and also the definition of measurements <−2 to define microcephaly.Citation 32,35,36 However, many children had HCZ <−3; few had HCZ > 1. This is in contrast with the measurements reported in privileged Nepali children,Citation 26 suggesting that, if given optimal nutrition, stimulation and medical care, Nepali children have head growth within the normal range, as defined by WHO. For example, in a 1-year follow-up of infants born at Kathmandu Medical College Teaching Hospital (an urban environment),Citation 26 HCZ scores between 6 and 12 months ranged from 0.04 to −1.22 (applying WHO standards to their data), far better than the scores in this rural, undernourished population.
The World Health Organizations endorses a standard set of HC measurements for children of all ethnicities, from birth until 60 months, similar to the sets for height and weight.Citation 32 However, some researchers have questioned the applicability of these standards to certain populations.Citation 30,63 − Citation 65 For example, some studies within specific ethnic groups (usually Asians) suggest that use of international standards over-identifies children with small anthropometric measurements, including head size,Citation 63,64 while others suggest that poor head growth may be under-recognised when using the CDC or WHO curves, particularly in children >2 months of age.Citation 30 In a recent systematic review comparing WHO standards with reports of growth measurements of healthy children in 55 different countries or ethnicities, mean HCs were consistently 0.5–1 SD above WHO’s Multicentre Growth Reference Study.Citation 65 No such data exist for Nepali children, particularly malnourished children of different ethnicities.
This study had several strengths and weaknesses. The major strength was the number of children who were followed longitudinally. It was possible to monitor the progress in head growth among individual children in the context of collecting relevant household and individual data. The study was conducted by a well trained and consistent group of field enumerators, with built-in controls for quality assurance. Possible weaknesses of the study included the need to use two distinct standards to measure HC (WHO and Nellhaus) as the WHO standards only include children <5 years of age. However, few of the core findings presented here relate solely to the children >5 years of age, and the Nellhaus charts are customarily used in many countries to analyse HC results in children older than 5 years.Citation 34 Additionally, it was not possible to examine all factors which might have influenced head growth such as prematurity, birth weight or exposure to teratogens. Determination of ASF consumption by dietary recall also may be inaccurate, although methods were designed to be as accurate as possible. It was expected that any measurement error was random across families. In addition, it is not known if the health scores reported here, although calculated every 6 months for the previous 2 weeks, accurately reflect overall health during the entire 4 years.
Nonetheless, in this population of generally undernourished rural Nepali children, head growth was related to age, gender, weight, health and consumption of ASF. Most striking was the decline in HCZ as children were followed longitudinally, most notably between the ages of 3 and 4 years. This is likely to reflect the cumulative effects on head growth of persistent undernutrition. Likewise, girls had progressively worse head growth than boys.
These findings suggest that poor head growth represents another facet of the silent emergency of child undernutrition. Undernourished children are not only at risk of growth retardation and increased morbidity and mortality from infections but also of permanent cognitive impairment.Citation 10,66 Taken together, these problems represent an enormous loss of human capital and may create an extreme burden for societies which are ill-equipped to deal with increasing numbers of individuals who have not reached their full intellectual potential. Further investigation of undernourished children in Nepal will help evaluate the relationship between cognitive performance and head growth in early life and will help to further illuminate the relationship between poverty and cognitive development.Citation 10 The relationship between these findings and the so-called ‘critical periods’ in early child development (including prenatal exposuresCitation 40 ) has not yet been explored. However, the link between poor brain growth in childhood and impaired executive functioning in adult life has crucial implications for undernourished populations and for the programmes which are designed to ameliorate their problems.
Acknowledgments
The statistical support and guidance of Robert Houser and Meghan Loraditch is gratefully acknowledged. Contributions by the Nepal Technical Assistance Group are deeply appreciated. The content of this paper is solely the responsibility of the authors and does not necessarily represent the official views of USAID.
Disclosure statement
There are no conflicts of interest to declare.
Funding
Heifer International (www.heifer.org) (LCM)
Financial support from Heifer International and the Nutrition Innovation Laboratories is also acknowledged. Funding was provided by the USAID Feed the Future Security Innovation Laboratory for Collaborative Research in Nutrition for Asia [award number AID-OAA-l-10-00005] and Africa [award number AID-OAA-L-10-00006] to the Friedman School of Nutrition Science and Policy, Tufts University (PW, SG, JKG, LCM).
Related Research Data
References
- Anderson SW , Damasio H , Tranel D , Damasio AR. Long-term sequelae of prefrontal cortex damage acquired in early childhood. Dev Neuropsychol. 2000;18:281–96.https://doi.org/10.1207/S1532694202Anderson
- Connor PD , Sampson PD , Bookstein FL , Barr HM , Streissguth AP . Direct and Indirect effects of prenatal alcohol damage on executive function. Dev Neuropsychol. 2000;18:331–54.https://doi.org/10.1207/S1532694204Connor
- Tranel D , Eslinger PJ . Effects of early onset brain injury on the development of cognition and behavior: introduction to the special issue. Dev Neuropsychol. 2000;18:273–80.https://doi.org/10.1207/S1532694201Tranel
- Ivanovic DM , Leiva BP , Pérez HT , Olivares MG , Dı́az NS , Urrutia MS , et al . Head size and intelligence, learning, nutritional status and brain development. Head, IQ, learning, nutrition and brain. Neuropsychologia. 2004;42:1118–31.https://doi.org/10.1016/j.neuropsychologia.2003.11.022
- Ivanovic DM , Pérez HT , Olivares MG , Díaz NS , Leyton BD , Ivanovic RM . Scholastic achievement: a multivariate analysis of nutritional, intellectual, socioeconomic, sociocultural, familial, and demographic variables in Chilean school-age children. Nutr. 2004;20:878–89.https://doi.org/10.1016/j.nut.2004.06.009
- Barnes RH . Dual role of environmental deprivation and malnutrition in retarding intellectual development. A. G. Hogan memorial lecture. Am J Clin Nutr. 1976;29:912–17.
- Colombo M , de la Parra A , Lopez I . Intellectual and physical outcome of children undernourished in early life is influenced by later environmental conditions. Dev Med Child Neurol. 1992;34:611–22.
- Galler JR , Barrett LR . Children and famine: long-term impact on development. Ambulat Child Health. 2001;7:85–95.https://doi.org/10.1046/j.1467-0658.2001.00109.x
- Grantham-McGregor S , Cheung YB , Cueto S , Glewwe P , Richter L , Strupp B . Developmental potential in the first 5 years for children in developing countries. Lancet. 2007;369:60–70.https://doi.org/10.1016/S0140-6736(07)60032-4
- Hamadani JD , Tofail F , Huda SN , Alam DS , Ridout DA , Attanasio O , et al . Cognitive deficit and poverty in the first 5 years of childhood in Bangladesh. Pediatrics. 2014;134:e1001–8.https://doi.org/10.1542/peds.2014-0694
- Handler LC , Stoch MB , Smythe PM . CT brain scans: part of a 20-year development study following gross undernutrition during infancy. Br J Radiol. 1981;54:953–54.https://doi.org/10.1259/0007-1285-54-647-953
- Hertzig ME , Birch HG , Richardson SA , Tizard J . Intellectual levels of school children severely malnourished during the first two years of life. Pediatrics. 1972;49:814–24.
- Siegel EH , Stoltzfus RJ , Kariger PK , Katz J , Khatry SK , Le Clerq SC , et al . Growth indices, anemia, and diet independently predict motor milestone acquisition of infants in south central Nepal. J Nutr. 2005;135:2840–44.
- Stoch MB , Smythe PM . 15-Year developmental study on effects of severe undernutrition during infancy on subsequent physical growth and intellectual functioning. Arch Dis Child. 1976;51:327–36.https://doi.org/10.1136/adc.51.5.327
- Stoch MB , Smythe PM , Moodie AD , Bradshaw D . Psychosocial outcome and CT findings after gross undernourishment during infancy: a 20-year developmental study. Dev Med Child Neurol. 1982;24:419–36.
- Allen LH . The nutrition CRSP: what is marginal malnutrition, and does it affect human function? Nutr Rev. 1993;51:255–67.
- Allen LH . Malnutrition and human function: a comparison of conclusions from the INCAP and nutrition CRSP studies. J Nutr. 1995;125:1119–26S.
- Morgan J , Taylor A , Fewtrell M . Meat consumption is positively associated with psychomotor outcome in children up to 24 months of age. J Pediatr Gastroenterol Nutr. 2004;39:493–8.https://doi.org/10.1097/00005176-200411000-00009
- Neumann CG , Bwibo NO , Murphy SP , Sigman M , Whaley S , Allen LH , et al. Animal source foods improve dietary quality, micronutrient status, growth and cognitive function in Kenyan school children: background, study design and baseline findings. J Nutr. 2003;133:3941–9S.
- Winick M . Malnutrition and brain development. J Pediatr. 1969;74:667–79.https://doi.org/10.1016/S0022-3476(69)80129-0
- Winick M . Prenatal protein-calorie malnutrition and brain development. Prog Clin Biol Res. 1985;163B:397–402.
- Winick M , Brasel JA . Early malnutrition and subsequent brain development. Ann NY Acad Sci. 1977;300:280–2.https://doi.org/10.1111/nyas.1977.300.issue-1
- Ministry of Health and Population, Nepal . New ERA, ICF International Inc., 2012. Nepal Demographic and Health Survey, 2011. Available from: http://dhsprogram.com/pubs/pdf/FR257/FR257%5B13April2012%5D.pdf
- UNICEF . State of the world’s children, 2014. Available from: http://www.unicef.org/sowc2014/numbers/
- Malla KK , Mall T , Rao S , Gauchan E , Basnet S , Koirala DP . Antropometric (sic) measurements in different ethnic groups of Nepalese new borns. J Nepal Paediatr Soc. 2012;32:1–8.
- Manandhar K , Manandhar DS , Baral MR . One year follow up study of term babies born at Kathmandu medical college teaching hospital. Kathmandu Univ Med J (KUMJ). 2004;2:286–90.
- Osrin D , Vaidya A , Shrestha Y , Baniya RB , Manandhar DS , Adhikari RK , et al . Effects of antenatal multiple micronutrient supplementation on birthweight and gestational duration in Nepal: double-blind, randomised controlled trial. Lancet. 2005;365:955–62.https://doi.org/10.1016/S0140-6736(05)71084-9
- Miller LC , Joshi N , Lohani M , Rogers B , Loraditch M , Houser R , et al . Community development and livestock promotion in rural Nepal: Effects on child growth and health. Food Nutr Bull. 2014;35:312–26.https://doi.org/10.1177/156482651403500304
- Ministry of Health and Population, Nepal . New ERA, Macro International Inc., Nepal. Demographic and Health Survey, 2006. Available from: http://dhsprogram.com/pubs/pdf/FR191/FR191.pdf
- Daymont C , Hwang WT , Feudtner C , Rubin D . Head-circumference distribution in a large primary care network differs from CDC and WHO curves. Pediatrics. 2010;126:e836–42.https://doi.org/10.1542/peds.2010-0410
- Nellhaus G . Head circumference from birth to eighteen years. Practical composite international and interracial graphs. Pediatrics. 1968;41:106–14.
- World Health Organization . Child Growth Standards. 2014. Available from: http://www.who.int/childgrowth/standards/second_set/tr2chap_3.pdf?ua=1
- World Health Organization . WHO Anthro and Anthro Plus. Geneva: WHO, 2011; version 3.2.2. Available from: www.who.int/childgrowth/software/
- Miller LC . The handbook of international adoption medicine: a guide for physicians, parents, and providers. New York, NY : Oxford University Press, 2005.
- Ashwal S , Michelson D , Plawner L , Dobyns WB . Practice parameter: evaluation of the child with microcephaly (an evidence-based review): report of the quality standards subcommittee of the american academy of neurology and the practice committee of the child neurology society. Neurology. 2009;73:887–97.https://doi.org/10.1212/WNL.0b013e3181b783f7
- Opitz JM , Holt MC . Microcephaly: general considerations and aids to nosology. J Craniofac Genet Dev Biol. 1990;10:175–204.
- Office for Human Research Protections . International Compilation of Human Research Standards, 2014. Available from: http://www.hhs.gov/ohrp/international/intlcompilation/2014intlcomp.pdf.pdf
- Okeahialam TC . Growth of Nigerian children with marasmus after hospital treatment. J Natl Med Assoc. 1983;75:75–80.
- Vaidya A , Saville N , Shrestha BP , de L Costello AM , Manandhar DS , Osrin D . Effects of antenatal multiple micronutrient supplementation on children’s weight and size at 2 years of age in Nepal: follow-up of a double-blind randomised controlled trial. Lancet. 2008;371:492–9.https://doi.org/10.1016/S0140-6736(08)60172-5
- Surkan PJ , Shankar M , Katz J , Siegel EH , LeClerq SC , Khatry SK , et al . Beneficial effects of zinc supplementation on head circumference of Nepalese infants and toddlers: a randomized controlled trial. Eur J Clin Nutr. 2012;66:836–42.https://doi.org/10.1038/ejcn.2012.42
- Ivanovic DM , Leiva BP , Pérez HT , Almagià AF , Toro TD , Urrutia MSC , et al . Nutritional status, brain development and scholastic achievement of Chilean high-school graduates from high and low intellectual quotient and socio-economic status. Br J Nutr. 2002;87:81–92.https://doi.org/10.1079/BJN2001485
- Grillenberger M , Neumann CG , Murphy SP , Bwibo NO , van’t Veer P , Hautvast JG , et al . Food supplements have a positive impact on weight gain and the addition of animal source foods increases lean body mass of Kenyan schoolchildren. J Nutr. 2003;133:3957–64S.
- Ihab AN , Rohana AJ , Wan Manan WM , Wan Suriati WN , Zalilah MS , Mohamed R . The impact of animal source food (ASF) on the growth of malnourished children in Bachok, Kelantan: randomized controlled intervention trial. J Nutr Food Sci. 2014;4:1–6.
- Dagnelie PC , van Staveren WA . Macrobiotic nutrition and child health: results of a population-based, mixed-longitudinal cohort study in The Netherlands. Am J Clin Nutr. 1994;59:1187–96S.
- Krebs NF , Westcott JE , Butler N , Robinson C , Bell M , Hambidge KM . Meat as a first complementary food for breastfed infants: feasibility and impact on zinc intake and status. J Pediatr Gastroenterol Nutr. 2006;42:207–14.
- Waterlow JC . Classification and definition of protein-calorie malnutrition. Br Med J. 1972;3:566–9.https://doi.org/10.1136/bmj.3.5826.566
- Rao KV , Singh D . An evaluation of the relationship between nutritional status and anthropometric measurements. Am J Clin Nutr. 1970;23:83–93.
- Illingworth RS , Lutz W . Head circumference of infants related to body weight. Arch Dis Child. 1965;40:672–6.https://doi.org/10.1136/adc.40.214.672
- Geraedts EJ , van Dommelen P , Caliebe J , Visser R , Ranke MB , van Buuren S , et al . Association between head circumference and body size. Horm Res Paediatr. 2011;75:213–9.https://doi.org/10.1159/000321192
- Anzo M , Takahashi T , Sato S , Matsuo N . The cross-sectional head circumference growth curves for Japanese from birth to 18 years of age: the 1990 and 1992–1994 national survey data. Ann Hum Biol. 2002;29:373–88.https://doi.org/10.1080/03014460110089526
- Dobrova-Krol NA , van IJzendoorn MH , Bakermans-Kranenburg MJ , Cyr C , Juffer F . Physical growth delays and stress dysregulation in stunted and non-stunted Ukrainian institution-reared children. Infant Behav Dev. 2008;31:539–53.https://doi.org/10.1016/j.infbeh.2008.04.001
- Skull SA , Ruben AR , Walker AC . Malnutrition and microcephaly in Australian aboriginal children. Med J Aust. 1997;166:412–4.
- Mukhopadhyay K , Mahajan R , Louis D , Narang A . Longitudinal growth of very low birth weight neonates during first year of life and risk factors for malnutrition in a developing country. Acta Paediatr. 2013;102:278–81.https://doi.org/10.1111/apa.2013.102.issue-3
- Mukhopadhyay K , Louis D , Mahajan G , Mahajan R . Longitudinal growth and post-discharge mortality and morbidity among extremely low birth weight neonates. Indian Pediatr. 2014;51:723–6.https://doi.org/10.1007/s13312-014-0489-6
- Georgieff MK , Hoffman JS , Pereira GR , Bernbaum J , Hoffman-Williamson M . Effect of neonatal caloric deprivation on head growth and 1-year developmental status in preterm infants. J Pediatr. 1985;107:581–7.https://doi.org/10.1016/S0022-3476(85)80028-7
- Brandt I , Sticker EJ , Lentze MJ . Catch-up growth of head circumference of very low birth weight, small for gestational age preterm infants and mental development to adulthood. J Pediatr. 2003;142:463–70.https://doi.org/10.1067/mpd.2003.149
- Vohr BR , McKinley LT . The challenge pays off: Early enhanced nutritional intake for VLBW small-for-gestation neonates improves long-term outcome. J Pediatr. 2003;142:459–61.https://doi.org/10.1067/mpd.2003.207
- Rosman NP , Tarquinio DC , Datseris M , Hou W , Mannheim GB , Emigh CE , et al . Postnatal-onset microcephaly: pathogenesis, patterns of growth, and prediction of outcome. Pediatrics. 2011;127:665–71.https://doi.org/10.1542/peds.2010-1576
- Gale CR , O’Callaghan FJ , Godfrey KM , Law CM , Martyn CN . Critical periods of brain growth and cognitive function in children. Brain. 2004;127:321–29.https://doi.org/10.1093/brain/awh034
- Ounsted M , Moar VA , Scott A . Head circumference charts updated. Arch Dis Child. 1985;60:936–9.https://doi.org/10.1136/adc.60.10.936
- Dewey KG , Mayers DR . Early child growth: how do nutrition and infection interact? Matern Child Nutr. 2011;7:129–42.https://doi.org/10.1111/mcn.2011.7.issue-s3
- Save the Children . Nutrition in the First 1000 Days, 2012. Available from: http://www.savethechildren.org/atf/cf/%7B9def2ebe-10ae-432c-9bd0-df91d2eba74a%7D/STATE-OF-THE-WORLDS-MOTHERS-REPORT-2012-FINAL.PDF
- Hanley GE , Janssen PA . Ethnicity-specific growth distributions for prediction of newborn morbidity. J Obstet Gynaecol Can. 2012;34:826–9.
- Madan A , Holland S , Humbert JE , Benitz WE . Racial differences in birth weight of term infants in a Northern California population. J Perinatol. 2002;22:230–5.https://doi.org/10.1038/sj.jp.7210703
- Natale V , Rajagopalan A . Worldwide variation in human growth and the World Health Organization growth standards: a systematic review. Br Med J Open. 2014;4:e003735.
- Schoenmaker C , Juffer F , van IJzendoorn M , van den Dries L , Linting M , van der Voort A , et al . Cognitive and health-related outcomes after exposure to early malnutrition: the Leiden longitudinal study of international adoptees. Child Youth Serv Rev. 2015;48:80–6.https://doi.org/10.1016/j.childyouth.2014.12.010