
Abstract
Public health care providers typically struggle with the need to meet demand for services, within a limited budget. This paper describes an analysis of a large public hospital, using the Theory of Constraints’ (TOC) comprehensive set of mapping tools to logically represent a problematic situation and investigate options for resolution. Based on the symptoms present, root causes and conflicts were identified, along with potential solutions. Further TOC tools were used to check for possible side effects of the solution, and identify obstacles that might impede successful implementation. Based on the TOC analysis, a trial project was implemented with significant benefits for two departments. Outcomes included dramatically reduced patient wait times and staff overtime, increased patient satisfaction, increased efficiencies, smoothed workload, and improved staff morale and retention, while maintaining patient safety and integrity of treatment, and staying within defined cost parameters.
1. Introduction
Improving the satisfaction of patients served by a busy public hospital pharmacy was the motivation for this study. Public hospitals typically struggle to balance high quality service delivery with budget constraints, and long-standing tensions can be the result. The research subject of this study is a lead provider of tertiary and secondary health services in the North Island of New Zealand. It is divided into various health care providers who include doctors, nursing, and pharmacy staff, and various functional departments, including Information Technology (IT) and Health Records. Health care providers report to their Business Managers, who have accountability for the budgets. Hospital revenue is obtained from the Ministry of Health (MoH), through agreed contracts for various types of surgery and services. The health care providers aim to deliver to the agreed volumes set out in contracts. While endeavouring to achieve this aim, staff felt conflicted in trying to meet patient demand, when the MoH has no contractual obligation to reimburse the hospital for delivery of services above and beyond the services agreed to in the contract.
This hospital is not alone in facing this problematic situation. In their invited review of operational research (OR) in health care, Brailsford and Vissers (Citation2011) concluded that the demands of delivering health care to an “ageing and ever-more demanding population”, “within limited budgets” and in the context of advancing technologies and expectations, “is a grand challenge indeed, and a key role for OR”. The most significant challenges facing healthcare providers, the authors suggest, “are more organisational and logistical than due to medical and scientific advances”.
This article describes an approach for investigating how such organisational and logistical challenges might be addressed. It uses the Theory of Constraints (TOC), which we will introduce next, before describing how it was applied at this hospital. This involved both a detailed analysis and a pilot implementation.
1.1. Introducing the Theory of Constraints
In the late 1970s, Dr. Eliyahu Goldratt, a physicist, helped a friend improve his production process by noticing the ways in which bottlenecks in production played a key part in determining the output of the entire system. He developed a production scheduling algorithm based on these observations. Despite its success, Goldratt soon noticed that policies and behaviours acted as constraints and that they could be harder to tackle than purely physical constraints. Thus, the Theory of Constraints (TOC) was created – popularised in The Goal (Goldratt & Cox, Citation2004) first published in 1984, It’s Not Luck (Goldratt, Citation1994), and other novels. These describe logical methods to help uncover and address physical, policy, and behavioural constraints that are barriers to improvement (Gardiner, Blackstone, & Gardiner, Citation1994; Watson, Blackstone, & Gardiner, Citation2007). TOC has been successfully implemented in production, logistics, distribution, project management, research and development, and sales and marketing (Mabin & Balderstone, Citation2003; Ronen, Citation2005, p. 1).
TOC has been applied in a number of healthcare settings, where it has shown promising results. For example, Knight (Citation2003), Umble and Umble (Citation2006) and Stratton and Knight (Citation2009) describe successful applications of TOC’s buffer management approach (DBR) that sought to accommodate rising expectations within a constrained budget in large UK hospitals, and led to significant reductions in wait times. Kim, Mabin, and Davies (Citation2008) review identified four papers using the TOC Thinking Processes (TP) in healthcare settings. These included operating room utilisation, ambulatory care system, and supervisory oversight procedures (Roadman et al., Citation1995); Peschke and Austin (Citation1999) analysed a medical practice; Taylor and Sheffield (Citation2002) looked at processing medical claims; while Lubitsh, Doyle, and Valentine (Citation2005) investigated resistance to change in three UK NHS trust departments. Clinician Myriam Hunink (Citation2001) utilised the Evaporating Cloud and Current Reality Trees to “make a well-founded decision” and facilitate improved communication in the care of a critically ill patient. In their book on integrating evidence-based decision-making methods in healthcare, Hunink, Glasziou, Siegel, et al. (Citation2001, p. 3) argue that in using methods that “illuminate what we disagree about and where better data or clearer goals are needed”, we may at least be assured that the resulting decisions “are the logical consequences of the evidence and values that were the inputs to the decision – and that is no small achievement”.
Wright and King’s (Citation2006) novel We all fall down, based on the application of TOC in a UK hospital was well received by TOC followers, and also by the medical fraternity (Pauker, Citation2006). Wadhwa (Citation2010) and Wright (Citation2010) provide recent substantial compilations. Multiple vignettes are addressed in Ronen, Pliskin, and Pass (Citation2006) using TOC-inspired focused operations management. More recently, the novel Pride and Joy (Knight, Citation2014) describes how TOC can be used in a major public hospital. The storyline was based on experiences gained from TOC interventions in some 30 health care organisations in the UK, USA, and other countries, and clearly demonstrates the benefits of taking a TOC-based approach. Cox, Robinson, and Maxwell (Citation2014, Citation2015) provide a comprehensive TOC analysis of a medical practice and evidence of drastic improvements on the basis of TOC solutions developed. Sommer and Mabin (Citation2015) illustrate how TOC can be used to alleviate a family’s conundrum surrounding elder care.
Applying TOC in health care settings may be a growing trend due to its “distinct theoretical and practical advantages” over some other quality improvement management philosophies (Breen, Burton-Houle, & Aron, Citation2002). Indeed, the TOC applications described here demonstrate that TOC, properly applied, will deliver powerful improvements to health care outcomes, as Burton-Houle (Citation2001) managed to convey to the CFO of a top US teaching hospital in 1999. When describing the “ah-ha” moment where resistance turned to interest, Burton-Houle (Citation2001) suggests that what turned the tide was her own “awakening” to the fact that TOC can be applied to any organisation, both for profit and not-for-profit. Using TOC in “for cause” organisations can end debates regarding whether the goal is to make money, or to deliver on the cause. Rather, TOC offers a set of tools to meet both goals. While practitioners show a willingness to share their experiences with TOC used in health care settings, it would seem that academic interest regarding TOC in health care is slower to awaken (Wadhwa, Citation2010). Thus, this paper seeks to add to the body of literature, with an evidential case study, supplementing the results derived in the aforementioned studies.
In the wider literature, TOC is an effective problem structuring method (PSM) which has been shown able to assist in all phases of problem structuring (Mabin & Davies, Citation2010). A comprehensive review of PSMs in action is provided in Mingers and Rosenhead (Citation2004), though they restrict their detailed discussion to a limited set of PSMs and TOC does not specifically feature. As they point out, boundaries defining PSM’s and non-PSM’s are ill-defined and the range of techniques in use is large. The present study demonstrates the impact of a properly managed soft-OR/problem structuring approach using the TOCs. The successful pilot implemented changes that resulted in notably better service delivery.
1.2. The TOC thinking process
Garvin and Roberto (Citation2001) identify the importance of viewing decision-making as a process involving discussion and debate, rather than an event. The TOCs Thinking Processes (TP) comprise a suite of thinking tools designed to provide a process of robust decision-making. The iterative nature of the tools facilitates constructive working relationships and an understanding of the difference between inquiry and advocacy. A constructive conflict resolution process enables individual assumptions to be tested and avoids personal friction (Ronen, Citation2005), directing focus to the problem at hand.
The TOC Thinking Processes originally consisted of a suite of five logic diagrams (four trees and an “evaporating cloud”) and a set of logic rules, though several variants have been added (Mabin & Davies, Citation2010). The diagrams use two distinct types of logic. Diagrams depicting current or desired future reality (such as Current Reality Tree (CRT), Current Reality Branches (CRB) and Future Reality Branches (FRB)), use sufficiency logic that captures cause and effect relationships – if “this” … then “that”. Other diagrams, such as the Evaporating Cloud and the Prerequisite Tree (PRT), use necessary condition thinking In order to have “A” … we need “B”. The set of TP aim to address the following key questions for successful change management:
1.2.1. Why change?
The first step is to agree there are problems that need addressing since they are preventing the organisation from achieving its goals (Barnard & Immelman, Citation2010). Lists of complaints or symptoms of underperformance and dissatisfaction can provide this evidence (“undesirable effects” or UDE’s). Dettmer (2011) recommends starting with a Goal Tree (tool) to identify the overarching goal and its critical success factors and necessary conditions, arguing that UDE’s are often found to align with deficiencies in these success factors and necessary conditions.
1.2.2. What to change?
Once the need for improvement is agreed on, there will generally be many suggestions for change. However, while every improvement is a change, not every change is an improvement. So it is important to carefully consider, out of all the things one might change, which change would lead to the greatest improvement. Hence, the second step is to identify what to change? The original approach, known as a “Current Reality Tree”, seeks to establish what is causing the UDE’s, so that improvement efforts may be focused on the root cause/core problem leading to the UDE’s. The same end may also be achieved by developing a generic evaporating cloud (EC) or Core Conflict Cloud from three individual ECs, which start with the Undesirable Effects (UDEs) and explore the conflicts they create (Cox, Blackstone, & Schleier, Citation2003; Cox, Mabin, & Davies, Citation2005; Lepore & Cohen, Citation1999; Shoemaker & Reid, Citation2005). By surfacing the assumptions inherent in the generic EC, a partial picture of the current reality tree (a current reality “branch” – or CRB) is developed. The CRB is essentially a gap analysis tool that helps examine the cause and effect logic behind the current situation, determining why that situation is different from the preferred state. This validates the why change as well as identifying what to change.
1.2.3. What to change to?
Once the EC has been constructed, we focus effort on developing a solution, based around a proposed starting point – in TOC referred to as an “injection”, drawing on an analogy of medical diagnosis and treatment. We recognise that a single injection is unlikely to cure a chronic problem. The Future Reality Branch (FRB) therefore answers the question of what to change to? starting with the proposed primary injection, and adding further injections that together lead to Desirable Effects (DEs), to replace the CRB’s undesirable effects (UDEs). A crucial part of the analysis involves identifying potential side effects and crafting additional actions to avoid them. The “Negative Branch” tool assists with this, as will be illustrated later.
1.2.4. How to cause the change? – The action plan
Even good solutions are not readily adopted, unless we first deal with obstacles to implementation (Goldratt-Ashlag, Citation2010, p. 572). The PRT identifies obstacles that stand in the way of implementing the changes, together with actions that will eliminate each obstacle. The overall objective – in this case providing quality care to patients – can be achieved by addressing the question of how to cause the change?
2. Applying TOC to the hospital environment
2.1. Overview
As public hospitals struggle with the need to meet the demand for their services within their limited budget, unresolved tensions can lead to undesirable consequences. Five thinking process tools from Goldratt’s Theory of Constraints were used to explore these tensions in a major public hospital, following the approach described in Cox et al. (Citation2003, Citation2005). A series of evaporating clouds (EC) were developed. These are also known as conflict clouds. They were used to describe, analyse, and resolve the tensions or conflicts in the following related services:
| | pharmacy – to meet production (service delivery) demands | ||||
| | oncology – between doctors and nurses, regarding the amount of treatment provided | ||||
| | proposed changes to data verification in the Electronic Health Record system (EHR). | ||||
A current reality branch for each side of the conflict was constructed, providing a clearer understanding of the problem. Potential solutions were then developed, including:
| | global measures, rather than local (or silo-based) optima | ||||
| | agreed processes for managing bottlenecks that constrain the throughput | ||||
| | agreed policy on the requisite criteria for service delivery | ||||
These steps are described in the remaining parts of Section 2, while the pilot project implementation is described in Section 3.
2.2. The individual evaporating clouds
Individual interviews were conducted with the following personnel, with evaporating clouds (EC) created to represent the dilemmas faced by the different personnel:
| | Business Solutions Manager | ||||
| | Pharmacy Team Leader | ||||
| | Nursing Team Leader for the Oncology Unit in the Cancer Centre | ||||
| | workload pressure | ||||
| | resources unable to meet the demand for care | ||||
| | tension between doctors/clinicians and other staff. | ||||
In the second situation with the Pharmacy Team Leader, the conflict was based on staffing in the Production Unit. The current workload in the Unit required more staff to cope with increasing demands for chemotherapy drug production. This resulted in other areas in the Pharmacy (e.g., Medicines Information or Dispensary) not being resourced adequately, impacting on service delivery. Work in the Production Unit was also more physically demanding and required significant training. Staff preferred not to work in the Production Unit. They preferred to work in mentally stimulating areas like medicines information, which was also less demanding. High numbers of vacancies, coupled with high workload, did not improve staff morale in the Production Unit.
In the third situation with the Nursing Team Leader in Oncology, nurses and administrative staff were in conflict with doctors in the Oncology Unit. On the one hand, doctors wanted to treat and follow-up on all patients in the Oncology Unit, which resulted in high workloads exceeding MoH contracted volumes. On the other hand, nurses resented the expectations to deliver high volumes of scheduled treatments as that meant there was little time for professional development (PD). They felt that patients could be referred to other providers for follow-up without compromising patient care. The lack of professional development (PD) opportunities for staff was believed to be a contributing factor in low staff morale, burnout, and increasing staff turnover.
An evaporating cloud (EC) was developed to describe each of these situations, to clarify, and ultimately evaporate each conflict. The approach used was that described in Cox et al. (Citation2003, Citation2005).
2.3. The generic cloud derivation
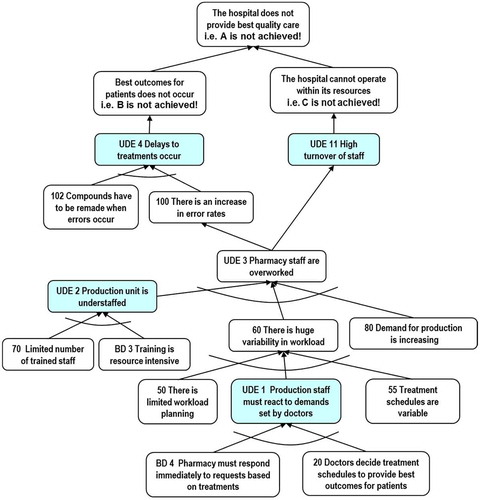
Once the three individual clouds (shown on the right of Figure ) were analysed, the core problem (on the left) was constructed from the 3 clouds by consolidating the themes in the individual clouds. Each of the three individual clouds is essentially a conflict between, on the one hand, actions required to meet various demands for service and, on the other hand, opposite actions required to stay within budgets. This core conflict in the generic evaporating cloud was seen to be primarily about how decisions about resource allocation were made – or rather – who made the decisions. This is explained below. The generic evaporating cloud summarises why the hospital is having difficulty delivering best quality care.
Figure 1. Generic and individual evaporating clouds.
The generic conflict, as shown on the left in Figure , can be read: In order for the hospital to provide quality patient care (A), doctors must be able to provide best treatment outcomes for patients (B), and the hospital must operate within its resources (C). B and C are necessary conditions for A. And in order for doctors to provide patients with the best treatment outcomes (B), doctors must be able to demand how resources are allocated (D). However, on the other hand, in order for the hospital to operate within its resources (C), management must allocate all resources (D′); (D′ is read as “D prime” or “not D”). D and D′ are mutually exclusive – hence the conflict.
The generic B, doctors can provide the best treatment outcomes for patients, was a synthesis of the B requirements of the 3 individual clouds, namely that: doctors must have 100% accurate patient information and the ability to schedule treatments when they were required, and pharmacy staff must meet urgent orders required for patients’ treatments.
The generic C The hospital operates within its resources, was likewise a synthesis of the 3 C requirements: management must have the new EHR project on time and within budget, nursing resources must be well trained and work within resources, and pharmacy staff must meet all service requirements within its resources, despite the competing demands of the Production Unit.
If we can eliminate the need for one of the prerequisites (D or D′) this means that the conflict will no longer exist. This is called “evaporating” the cloud. It constitutes a win for both sides, because it satisfies both the conditions (B & C) necessary to achieve the objective (A) (see Schragenheim, Citation1998). There are various ways of evaporating the cloud, as described in Dettmer (Citation2007, ch. 5); Scheinkopf (Citation2010); or Mabin, Davies, and Kim (Citation2009). These involve surfacing assumptions underpinning the arrows in the EC and then challenging these assumptions. This process enables us to identify ways of achieving B and D′ (without D); or C and D (without D′); or ways of getting a hybrid of D and D′ such that we satisfy both B and C. For example, a process whereby doctors and managers collaborate effectively on making resource allocation decisions would achieve this aim.
Because this conflict has remained unresolved for a long time, there is: ongoing conflict between the parties, concerning whether resources should be allocated based on doctors’ demands – or based on management decisions.
An EC should achieve the following purposes (Dettmer, Citation2007, p. 161):
| | Confirm that the conflict actually exists | ||||
| | Identify the conflict perpetuating a major problem | ||||
| | Identify all assumptions underlying the problems and conflicting relationships | ||||
| | Explain in depth why the problem exists | ||||
| | Resolve the conflict | ||||
| | Avoid compromise (where neither side feels they have got what they wanted) | ||||
| | Create win–win situations in which both sides win | ||||
| | Create new “breakthrough” solutions to the problems. | ||||
2.4. Mapping the current reality
To check if the generic cloud has been stated correctly, we check whether the undesirable effects (UDEs) that logically stem from this generic conflict match the undesirable effects observed in reality (ascertained through interviews and corroborated with secondary evidence). Here we surface further assumptions using “if-then-because” logic as part of the Current Reality Branch process (Cox et al., Citation2005) as illustrated next. For this, we restate the cloud above as:
If D doctors were able to demand how resources were allocated, then B doctors could provide patients with the best treatment outcomes. This was seen to be in conflict with D′ if the management decided on all resource allocation, then C the hospital could operate within its resources. Putting the cloud this way helps to draw out assumptions that are implicit behind this statement, and to determine whether they are valid or invalid, existing or nonexistent. This extra clarity helps to identify ways of breaking the assumptions, in order to develop a win–win solution.
The undesirable effects (UDEs) identified in the interviews associated with the individual clouds included:
| | bottlenecks in pharmacy production | ||||
| | high pharmacy and nursing workloads, contributing to low staff morale | ||||
| | throughput problems, with patients experiencing long waiting periods | ||||
| | over-delivery of services, which were not funded | ||||
| | a lack of clinician confidence in the proposed data verification in the EHR | ||||
| | a lack of staff training and development | ||||
| | differing KPI measurements, which created friction amongst clinicians and managers. | ||||
| | high workloads for both pharmacy production and nursing staff | ||||
| | IT rework for patient verification | ||||
| | funding (resource) problems, if there is over delivery of unfunded service and | ||||
| | discontent amongst nursing staff who do not have professional development time. | ||||
Figure 2. What to change? CRB for the pharmacy.
The numbering of boxes is mostly for convenience in reading the diagram, though some have special significance, e.g., to denote UDE’s (undesirable effects) that were identified in the CRT analysis (shown in shaded boxes), or assumptions from the EC which are labelled according to the relevant EC arrow, e.g., BD 3 and BD 4.
The CRB surfaces differences between the current and preferred system realties (Dettmer, Citation2007). The proposal then arising from the CRB for Pharmacy was that doctors should make decisions, but within agreed guidelines. While this may not seem rocket science, it was a breakthrough in the thinking of the people concerned at the time. The Thinking Processes used in formulating this proposal are mapped out next.
2.5. What to change to?
2.5.1. Developing the solution
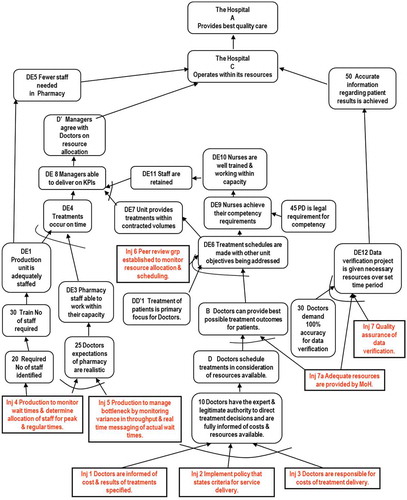
From the previous steps, we have the kernel of a proposed solution from evaporating the cloud, i.e., identifying one or more assumptions that can be challenged/broken. The next step is to construct a Future Reality Tree (FRT), which serves several purposes. It provides a logical means to verify that the proposed action will in fact produce the desired result, and it also identifies potentially unfavourable consequences of contemplated actions, and what else is needed (additional injections) to overcome them (Dettmer, Citation2007, pp. 205–258). Proposed solutions/actions, whether derived from the EC or the FRT are called “injections”. A single injection is not a solution – just a starting point. Cox et al. (Citation2005) derive the FRT via a branch of the FRT (described as FRB), with one FRB constructed for each side of the EC. This is essentially a “what-if” exercise, identifying what actions and conditions are necessary and sufficient to deliver the desired changes, and indicating potential UDEs (Mabin & Davies, Citation2010, p. 635). The FRB relating to the B-D side is shown in Figure . This starts from the position that D is the chosen alternative out of D and D′ from the EC. It shows the conditions under which D can be a sensible choice, and shows what other injections (shown in square-cornered boxes) are needed to make this work. Note at the top of the diagram, that C is also achieved – this is what is meant by making the solution work – both necessary conditions from the cloud (B and C) are achieved, so that A, the overarching objective, can be achieved. Boxes labelled DE denote desired effects (opposite to UDE’s undesired effects) while A, B, C, D, and D′ are from the Evaporating Cloud and DD′ 1 refers to the assumption underlying the DD′ conflict arrow in the EC.
Figure 3. Future Reality Branch for the B-D side.
2.5.2. Improving the solution: Using the Negative Branch Reservation tool
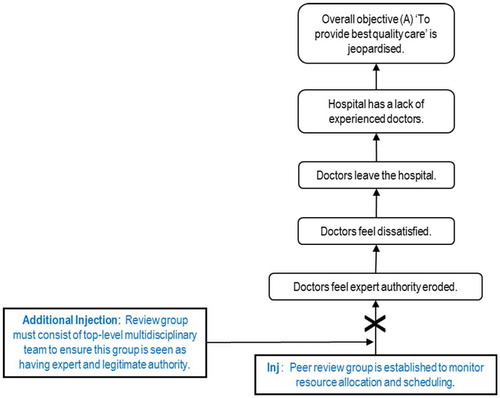
A proposed solution can also potentially cause negative side effects. A Negative Branch (NBR) is the TOC “tool” used to identify and map out the causal relationships linking the proposed solution based on an injection designed to overcome a UDE, to potential negative outcomes. For example, the injection to Establish a peer review group to monitor the allocation of resources as a means of increasing the communication and collaboration that seems to be required for all the needs of the parties to be met, could result in a number of doctors feeling threatened, and ultimately resigning from the hospital, which in turn places the overall objective, A, in jeopardy. The logic is illustrated in the vertical branch of Figure . A possible solution to mitigate this potential negative side effect, to ensure that the peer review group comprises a high-level multidisciplinary team, would prevent the negative effects from occurring, as shown by the “X”. This would give the team the expert and legitimate authority required to carry out this task. For a full example of the negative branch analysis, see Goldratt (Citation1994) or Mabin, Davies, and Cox (Citation2006).
Figure 4. Negative branch for primary injection – peer review.
2.6. How to cause the change?
2.6.1. Planning implementation using the PRT
Once the solution has been developed and honed, the PRT helps implement the decisions. The process of building the tree involves three steps:
| (a) | identifying the obstacles | ||||
| (b) | determining the intermediate objectives needed to overcome each obstacle | ||||
| (c) | mapping the order for implementing the intermediate objectives (Scheinkopf, Citation1999). | ||||
2.6.1.1. Obstacles to implementation
More than twenty obstacles were identified, with a selection listed here:
| • | Lack of time to implement change due to high workload | ||||
| • | Staff retention problems require continuous recruitment of new staff | ||||
| • | Limited understanding of the pressures facing different departments and staff groups | ||||
| • | Limited communication between departments | ||||
| • | Each department makes its own decisions about the allocation of resources. | ||||
2.6.1.2. Identifying the obstacles
Obstacles (in boxes labelled O in Figure ) can be identified from the two FRBs, or from talking to the staff involved. They must be entities that currently exist (Cox et al., Citation2003). Each obstacle was checked for causality existence (Cox, Blackstone, & Schleier, Citation2003):
Figure 5. How to cause the change? The prerequisite tree.
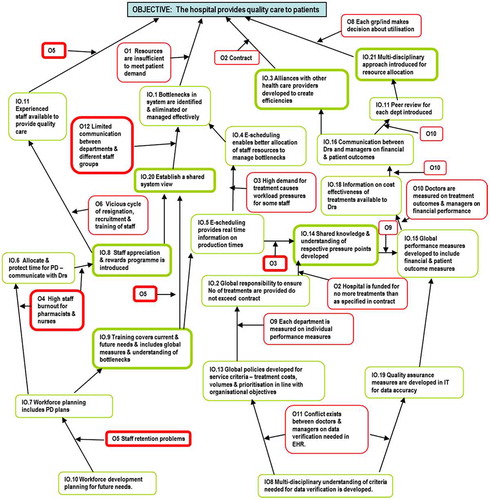
If [obstacle], then we cannot achieve objective, the hospital provides quality care.
For example:
If O1 resources are insufficient to meet demand, then the hospital cannot achieve its objective of providing quality patient care.
Obstacles are approached systematically, using the PRT to reveal new problems, flaws in logic, and breakthrough injections. The obstacles clustered around three related difficulties:
| (1) | managing demand within current resources | ||||
| (2) | the impact of workload pressure on staff and their working relationships | ||||
| (3) | how resources are allocated. | ||||
2.6.1.3. Determining the intermediate objectives needed to overcome obstacles
The obstacles are translated into intermediate objectives (in boxes labelled IO in Figure ) that show how each one would be eliminated, or how its relevance to the key objective can be eliminated (Cox et al., Citation2003). Each intermediate objective is a milestone that needs to be accomplished, if the final objective is to be achieved (Kendall, Citation1998). The objectives are checked using necessary condition logic:
When we accomplish [IO] then [obstacle] no longer prevents us from achieving [objective]
The most significant feature of the intermediate objectives is the need to adopt a multi-disciplinary approach to all activities, including policies, procedures, service criteria, and resource allocation. This will resolve the obstacles created by operating with individualised practices and measures, which lead to conflicts and underperformance.
The PRT answers the question “what do we do first” in solving a complex problem, sequencing intermediate objectives in the right order to show “how to cause the change.” Like the EC, It is a necessity structure, identifying the minimum necessary conditions without which the objective cannot be achieved (Dettmer, Citation2007). The reason for each necessary condition – to overcome a specific obstacle – is also part of the logic. The PRT is read top down using “in order to … we must ...” as is the custom for necessity logic. Dettmer explains how to read a PRT as: In order to have [INTERMEDIATE OBJECTIVE], we must have [LOWER INTERMEDIATE OBJECTIVE] to overcome [OBSTACLE]. This puts the three entities in the correct logical form (Dettmer, Citation2007: 277; Scheinkopf, Citation1999, p. 206). In the PRT diagram in Figure , Obstacles are labelled with an O prefix, and Intermediate Objectives with an IO prefix.
For this case, the PRT is read: in order for the hospital to provide quality care for patients … we must take a multi-disciplinary approach (to overcome the obstacle of each group/industry making its own decisions about utilisation), we must develop alliances with other health care providers (to overcome the obstacle that the MoH contract is fixed), we must identify bottlenecks and eliminate or manage them efficiently (to overcome the obstacle that resources are insufficient to meet patient demand), and we must have experienced staff available (to overcome staff retention problems). In order to have experienced staff available, we must allocate and protect Professional Development … and so on, down the tree. The first actions to take are those with no predecessors, typically found at the bottom of the tree.
2.7. Limitations of the analysis
This analysis thus far was limited by the lack of direct input from clinical staff in the development of the three evaporating clouds (or ECs), as the interviews on which the analysis is based were conducted with managers and team leaders, who nevertheless, also conveyed clinicians’ expressed views. Thus, it could be argued that this representation lacks true balance, potentially affecting the findings. The analysis and its findings therefore needed to be examined by physicians and clinical staff.
3. Pilot project implementation
The findings of the initial TOC analysis identified potential solutions, including shifting away from the pursuit of local optima, whereby each department or profession made their own decisions without regard to the consequences for others, and instead taking a global perspective, through the use of multidisciplinary teams and shared decision-making. On completion of the initial analysis, the project team member working in the hospital sought input from medical staff. When the analysis was discussed and used with clinicians, they were in general agreement with the findings. The team member gained agreement with her colleagues in the hospital to use the detailed TOC analysis as the basis for a pilot project to test the solutions.
The results of the pilot were positive and showed the value of the tools in a hospital setting (Yee, Ogden & Snowling, Citation2007). The learning from the project highlighted one key area of conflict and ways to resolve it. With the depth of understanding gained through the detailed analysis about what to change, the staff involved were able to gain requisite buy-in and move quite quickly into piloting the project implementation (Mabin, Babington, Caldwell, Yee & Moore, Citation2011). The resulting improvements made to service delivery helped the hospital better meet their overall goal providing quality care to patients as will be described next.
3.1. Planning the project
3.1.1. What to change?
The pharmacy is responsible for manufacturing chemotherapy drugs for the Cancer Centre (CC) for treating both oncology and haematology patients. Staff struggled to keep up with the workload and there were stress factors for both departments, requiring urgent change. Patients were waiting for long periods for their treatment, increasing the pressure on nursing staff. Within the pharmacy, the workload tended to fluctuate widely. Scheduling was a constant challenge, with idle staff looking for work one minute, only to have to work overtime later. Staff suffered “burnout” and dissatisfaction. Patients were dissatisfied. Something needed to change.
The traditional working system for the Cancer Centre and the Cytotoxic Pharmacy Manufacturing Unit (CPMU) is based around an “active confirmation” process meaning that chemotherapy drugs are not manufactured until the production unit receives definite confirmation from the Cancer Centre clinician that the patient is to receive treatment. In most instances, the patient is already on site. This system of “active confirmation” is a historical practice to try to reduce drug wastage and the need for patients to attend on more than one day. On confirmation from the Cancer Centre, the production unit allocates a time that the medication would be supplied for administration, and tries to ensure that the drugs are manufactured and then delivered to the Cancer Centre by that time. The process requires multiple phone calls, which is time consuming and can cause disruption to the service. With ever higher patient numbers, more complex chemotherapy regimens and competition for similar time slots by other users of the CPMU, the delays experienced by patients had become lengthier as only one item can be made at any one time in the isolator. Research has shown that having to wait indefinite periods of time causes high levels of anxiety for patients. The impact of anxiety on patients can be impaired attention, exacerbated perception of pain, lowered frustration tolerance and can reduce a patient’s ability to make choices. In turn, nursing staff work long hours in stressful conditions.
On investigation, it was apparent there were several delays in the current drug manufacturing system. The process involved the doctor prescribing a drug regimen for a patient. The first delay occurred because the script (Rx) is only sent to the pharmacy once the patient has been assessed as “OK” to proceed with treatment (a process termed “verification” or “confirmation”), depending on blood tests taken shortly prior to treatment and in most cases, a clinic consultation with the specialist.
The second delay was the wait while pharmacy then makes the drugs in the CPMU from scratch. Another delay occurs with delivery of the drugs to the Cancer Centre, and a further delay as the patient waits for the nurse to administer the chemotherapy drugs. These delays were causing extensive delays for patients, as well as overtime, burnout, and stress for nursing staff and pharmacy staff.
This is illustrated in Figure .
Figure 6. Flowchart of the problematic situation.
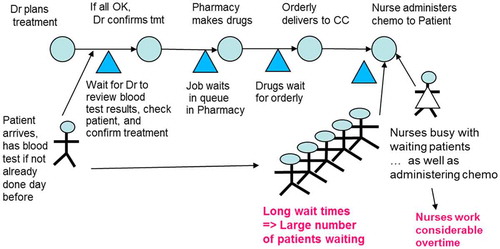
Thus, the first part of the solution was recognising what to change.
A key area to change was “waiting for specialist approval”, whereby drugs would only be manufactured after approval by a specialist was given. There was a belief that this “specialist approval” step was required in order to minimise wastage and to control costs – because chemotherapy drugs are hugely expensive. However, the system also created a raft of inefficiencies, including time-consuming phone calls between the two departments regarding confirmation.
Hence, the conflict was traced back to the four requirements: there is a need to minimise wastage whilst providing the correct treatment and keeping staff overtime and waiting times minimal.
The challenge was to develop a more efficient system for manufacturing. One of the proposed solutions was to make all drugs the day before planned treatment, prior to specialist confirmation.
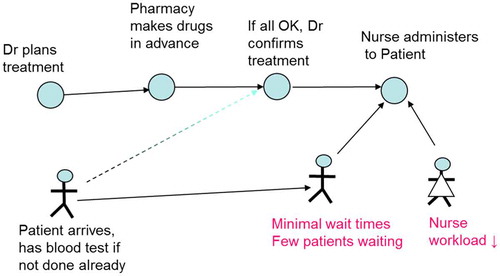
3.1.2. What to change to?
The pharmacy production unit proposed a new system for how chemotherapy was to be ordered, discarding an “old system” which was risk averse where manufacturing workload and speed was dictated by confirmation phone calls. The pilot was to test an alternative working strategy. The “new system” of service delivery involved chemotherapy drugs being prepared, without confirmation, in advance of the time they are due for all ambulatory chemotherapy patients. The premise is that the majority of preparations are stable for greater than 7 days, so these can be reused if a patient requires deferral or delay. A four week trial was agreed using the suggested “no confirmation” system, with a one week snapshot of the original “active confirmation” system being taken for comparison.
The new process would look like Figure .
Figure 7. The proposed process.
3.1.3. How to make the change?
A series of meetings were arranged to discuss the project, firstly with the pharmacy team, and then buy-in was sought from the Clinical Director and Nurse Manager in the Cancer Centre (CC). It was agreed that a pilot would be conducted for four weeks, and before piloting the proposed solution, baseline data would be collected over 1 week. The data analysis was crucial, and a great deal of information was collected, so that the effects of the pilot project could be evaluated. The data included supply delays, patient waiting times, patient satisfaction, staff overtime, and wastage of drugs.
| • | Collection of baseline data – Baseline data were recorded both in the Cancer Centre and in the pharmacy production unit for a period of one week. This recorded patient delays, ratio of products made on the same day they were required and proportion of confirmations received for each day. Workload statistics and a note of significant events which interrupted the planned manufacture of items were also made. A second record was kept of all returns to the pharmacy department from patients who did not require their treatment, and associated reasons. | ||||
| • | Analysis of baseline data – The baseline data were analysed in the production unit and a summary of the information was written and presented at the pre-trial implementation meeting. | ||||
| • | 4 week trial – A period of 4 weeks commenced where all items were made in advance of confirmations being received. Most items were made at least 24 h in advance and delivered to the receiving ward at the end of the day before where possible. Only items with an expiry of 24 h or less, and clinical trial items were made “on the day”, but again, no confirmation was received in advance. During week 4 of the trial, the baseline data collection was repeated. | ||||
| • | Patient survey – As part of the trial, a patient survey of patient waiting times pre- and post-project implementation were captured by the Cancer Centre staff. | ||||
| • | Analysis of trial data – The results from the trial were collated and presented at a further meeting. Financial data were shown on the returned items, and the costs related to those items not reused. Nurses and pharmacy staff were asked to evaluate the results relative to the objectives of the trial and determine whether these had been achieved. | ||||
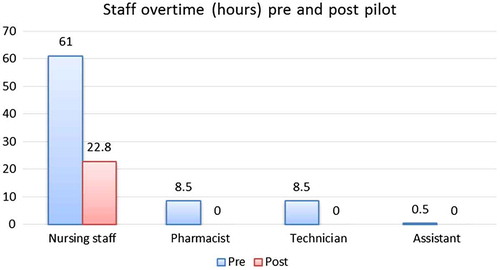
| • | Re-audit of wastage – After implementation of pre-emptive manufacture, as part of the continuing process of refining the service, the cost impact of patient wastage was audited on 2 further occasions. On the basis of those results further changes were recommended to minimise the impact of this cost. The baseline data collected before the pilot showed that there was a need for improvement, as had been expected. In the week before the pilot was commenced, delays in CPMU workload of up to 340 min were experienced, overtime for nursing staff amounted to 61 and 8.5 h each for pharmacists and technicians. In the Cancer Centre, patients were waiting for between 1 and 4 h for their drugs, with an average wait time of 129 min. On the positive side, the cost of wastage was considered to be very low at 0.4%. | ||||
3.2. Results of the pilot
3.2.1. Impact on waiting times
As a result of the changes in manufacturing due to dropping the need for prior confirmation, patient waiting times reduced markedly. The vast majority of patients did not have to wait at all because the drugs were already on site. According to the patient survey collected by the Cancer Centre staff, 14 patients waited an average of 20 min, generally for a dose adjustment. The maximum wait reduced from 4 h to 30 min, which was less than the minimum wait under the old system (1 h). The patient survey also reported an increase in patient satisfaction.
3.2.2. Impact on staff overtime
Staff overtime was calculated for 3 months prior to the project, and for the 3 months following. The act of dropping specialist approvals reduced staff overtime for nursing staff to 22.8 h per week, a two-thirds (67%) reduction, as shown in Figure . The need for overtime for all other staff was eliminated, and those involved reported reduced stress levels.
Figure 8. Staff overtime hours per week for the 3 month periods pre- and post-pilot.
3.2.3. Impact on wastage cost
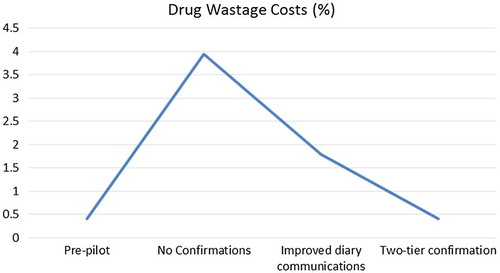
Notably, without specialist confirmation prior to manufacture, drug wastage costs increased to 4%. While significant, this rise from the baseline, pre-pilot figure of 0.4% was not entirely unexpected. On investigation, it was revealed that the majority of initial errors during the pilot were due to diary errors in the Cancer Centre. Interventions to improve communications to reduce diary errors were investigated, and a subsequent re-audit showed this reduced wastage costs to 2%. However, this was still more than the initial 0.4%, and any increase in drug costs was considered undesirable.
3.3. Refinement and acceptance of the pilot project – two-tier confirmations process
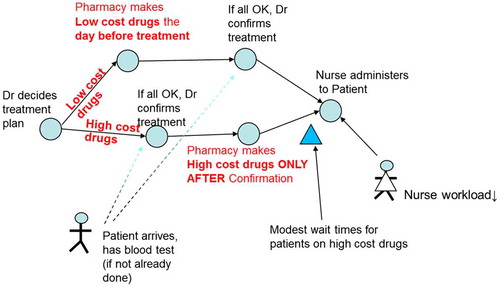
Further meetings were held with the Cancer Centre to further refine the process, and it was proposed that the verification process would be re-instated for high-cost drugs, while other drugs – mainly low cost, high volume drugs – were to be made the prior to planned treatment, usually the day prior, and delivered to the Cancer Centre by the evening before. Only 10% of drugs fell into the “high cost” category, meaning that 90% were able to be made without prior confirmation. To minimise patient waiting time for drugs made on the day, the Pharmacy allocated a dedicated runner/orderly to make deliveries to the Cancer Centre when the drugs are ready, and when that person is not available, a nurse or health care assistant makes the delivery. This two-tier confirmations process, illustrated in Figure , was immediately implemented.
Figure 9. The two-tier confirmation process.
The pilot project was extended beyond the initial 4 weeks. At 3 months, with the new two-tier system in place, drugs made ahead of time but not used on the originally scheduled day could often be stored for later use. Wastage costs showed a return close to the baseline of 0.4%, despite only 10% of drugs being subject to specialist approval prior to making, as shown in Figure .
Figure 10. Drug wastage costs before, during and post-implementation.
3.3.1. Distribution of patient waiting times
In addition to average patient wait times quoted earlier, based on patient surveys before and after the pilot, the distribution of wait times has been recalculated for the three chemotherapy drug production regimes, as shown in Figure . However, these should only be viewed as indicative, as the information provided in the project report (Yee et al., Citation2007) was insufficient for a full statistical analysis and the original set of patient survey data was not able to be located. To compensate for this, interviews were conducted with the Nurse Manager (in the role between November 2007 and mid-2017) and the pharmacist responsible for the Cancer Centre at the time. The information so obtained has been used to supplement the summary data available from the patient surveys conducted by the Cancer Centre staff as part of the project implementation, as described next.
Figure 11. Distribution of patient waiting times.
According to the patient survey of 62 patients under the original manufacturing process requiring confirmations of all drugs, patients waited between 1 and 4 h for their chemo drugs to be ready for administering, with an average waiting time of 129 min. Using this minimum of 60, average of 129 and maximum of 240 min, and assuming a lower quartile of 100 min and upper quartile of 180 min, resulted in an estimated distribution of original patient wait times as shown in the box plot at top of Figure .
After changing to “No confirmations”, patient wait times reported in the survey amounted to a maximum wait of 30 min, and an average wait of 20 min, for 14 patients. The Nurse Manager reported that these would have been only the patients who waited for a dose adjustment, as the drugs were on site for all patients and the vast majority experienced no wait. With well over 75% experiencing no wait, the lower limit, lower quartile, median and upper quartile are all 0. The middle box plot in Figure represents this situation.
Finally for the steady state of two-tier confirmation, no patient survey was carried out by the Cancer Centre staff; however, the project team reported that the patient wait times were still very low. The Nurse Manager indicated that the 90% of patients requiring low cost drugs did not have to wait, while those with high cost drugs or requiring dose adjustments usually waited about 1 h, with a range of between 30 min and 2 h, with 2.5 h in an extreme case. Based on the Nurse Manager’s estimates of 4–5 patients per day requiring high cost drugs or some dose adjustment and around 20 patients per day in the Cancer Centre, the upper quartile was conservatively set at 30, with the lower limit, lower quartile and median all 0, resulting in the lower box plot in Figure .
These box plots reflect that with “No confirmations”, wait times were eliminated for all but a few patients requiring dose adjustments, while under the “Two-tier confirmations” system, a significant improvement was obtained. Average wait times, calculated over all patients, were 129, 2.8, and 16.5 min, respectively, under the three regimes. This amounts to an improvement in average wait times of 87% for the “Two-tier confirmations” system compared with the original “Wait for confirmations” model. Further, as reflected in the box plot, the distribution is very much tending towards no wait.
3.3.2. CPMU production capacity
In addition, and somewhat unexpectedly since this had been the bottleneck, the production capacity of the CPMU actually increased substantially. Table shows the actual number of items manufactured in the CPMU for the Cancer Centre during the four week trial, compared to the expected workload in the pre-trial week adjusted for a similar period. The volume had increased over the four week trial period by approximately 17% within the pharmacy unit, with a 37% increase in production for the Cancer Centre, without any negative impact on pharmacy staffing overtime or patient wait time. Additional capacity had been gained as a result of this new confirmation process.
Table 1. Cytotoxic pharmacy manufacturing unit (CPMU) workload.
Monitoring and fine-tuning the “make without confirmation” initial proposal prompted a better solution that satisfied all parties. When the initial pilot results showed that wastage was unsustainable for expensive drugs, the two-tiered solution was developed and executed. This was a win–win–win solution, meeting the needs of CPMU staff, Cancer Centre staff, and patients, keeping costs and overtime down, waiting times short, and a smoothed workload for staff in Cancer Centre and CPMU. CPMU staff could work more efficiently with many fewer interruptions through phone calls previously required for confirmation, resulting in less idle time and smoother workload. Moreover, it induced notably improved staff morale and retention of specialist staff.
3.4. Summary
The project team summarised the effects as:
| | Improved workload planning and operation for the Cytotoxic Pharmacy Manufacturing Unit (CPMU). | ||||
| | Increased capacity for the CPMU. | ||||
| | Reduced stress in the Cancer Centre and pharmacy working environment for staff. | ||||
| | Cost savings as both pharmacy and Cancer Centre nursing staff overtime has been reduced. | ||||
| | Efficient management of wastage, now equivalent to pre-pilot expenditure levels. | ||||
| | Improved patient satisfaction with the Cancer Centre service. | ||||
from the pharmacy perspective it allowed much more efficient and effective planning in the production unit, which increased safety for the staff making the chemotherapy, and also more rational use of drugs. From the Cancer Centre perspective there were a large number of patients who were able to go ahead with minimal wait time as the chemotherapy was ready in advance. Obviously there were some who required dose adjustments on the day who still had longer waits. It certainly removed pharmacy from being the main bottleneck in the process. (personal communication)
The solution also provides a specific example of the general proposed solution derived from the TOC analysis described in 2.3 and 2.4, namely for “Doctors to make treatment decisions but within agreed guidelines”. In this case, Pharmacy and Doctors agreed on appropriate protocols for the manufacturing of the drugs to meet treatment plans, which made more effective use of existing pharmacy production capacity, stopped this from being the major cause of delays, benefitting both departments’ staff, patients, and financial performance.
3.5. Reframing the pilot as an evaporating cloud (EC)
As de Bono (Citation1988) says, “a good solution is obvious in hindsight”. This appears common for TOC solutions (Barnard & Immelman, Citation2010) – and can in some cases, lead to solutions being undervalued. The fact that several projects had looked at the same problem before and none had come up with a good solution, suggests that although this solution was obvious in hindsight, it had not been discovered, or perhaps it had not been presented in such a complete and convincing manner, before the TOC analysis. The initial TOC analysis had provided hope that win–win solutions could be found, and TOC thinking was evident in the process of arriving at the final win–win–win solution to this long-standing problem – posing the right questions and challenging people’s assumptions in a collaborative manner guided by the TOC processes.
The novelty of the solution at the time is apparent in the comments of the Nurse Manager interviewed, who said that when he first started in the role in November 2007, once the two-tier system had been in place for just over 6 months, he was “initially really surprised to see all the chemo waiting” as he had “never seen anything like it in [his] previous hospital in the UK!” But he quickly realised that it worked very well, and confirmed the staff and patients all liked the new system. He recalled people remarking it was so much better than the old system, and he endorsed the very positive effects on patient wait times, overtime, stress levels and workflow described by the project team.
Though the problem was not mapped as an evaporating cloud at the time, the problem and its solution can be summed up using the Evaporating Cloud, as shown in Figure .
Figure 12. The drug production dilemma and its solution represented as an evaporating cloud.
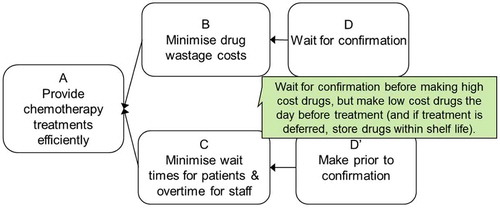
We read the cloud as:
In order to provide chemotherapy treatments efficiently, we must minimise drug wastage costs, and in order to do this, we must wait for confirmation. On the other hand, in order to provide chemotherapy treatments efficiently, we must minimise wait times for patients and overtime for staff, and in order for this, we should make prior to confirmation. Hence the conflict!
The Nurse Manager commented that the top branch of the Evaporating Cloud reflected the Pharmacy department’s need to maintain its own efficiency. He observed this was in conflict with minimising patient waits, which probably reflects the implicit assumptions held by the various stakeholders. However, the new system managed to meet both needs, not sacrificing one for the other.
The evaporating cloud further reflects the fact that even though the focus had always been on patient care, the avenue of achieving that had been blocked by the departments acting in isolation. Only by viewing the interdependence between the departments can this be challenged. Realising that pharmacy was the bottleneck under the old system opened up new ways of improving patient care that were not possible by focusing on Cancer Centre operations in isolation.
4. Discussion
4.1. Reflections on the project
Powerful solutions … start with the right questions
In some organisational settings, the right questions and answers are more easily expressed by words than mathematics. This is a role for softer methods for structuring and thinking through problematic situations – as an alternative or complement to mathematical modelling approaches, an opportunity for TOC and other soft OR/PSM’s.
There is also a role for TOC’s other processes of ongoing improvement besides the TP tools. For example, during the analysis phase, we had discussed using the five focusing steps and drum-buffer-rope to improve flow in the various processes, such as the rotation of staff into the CPMU. However, the one change, of removing confirmations for the majority of drugs, stopped the CPMU from being the bottleneck, and so this was not needed. Buffer management, as demonstrated in Umble and Umble’s (Citation2006) paper, could have identified those drugs that caused delays, which would show up as “holes in the buffer” indicating a problem to be addressed. This might have provided focus on the problematic drugs, perhaps to a different classification of prescriptions, based on production delays rather than solely cost of the drug. Both of these processes might also have gotten all individuals involved in the pilot implementation in redefining their roles in supporting the constraint in the flow and in improving the flow. TOC’s buffer management methods are also at the core of the approach developed by Knight (Citation2014) in use in many hospitals which uses clinically agreed planned discharge dates to focus actions needed to radically improve patient flow.
So what were the lessons the team learned from the pilot?
| | There is value in analysing a system and challenging the long held status quo. | ||||
| | The resulting new two-tier system is working “smart” – with a pull system to manufacture in step with demand. | ||||
| | Bottlenecks can be addressed without needing more resources. | ||||
| | The importance of collaboration cannot be overemphasised, with each party understanding the drivers of certain types of behaviours and constraints within our own departments. Communication between Pharmacy and the Cancer Centre improved as a result of this project and has led to other joint projects. | ||||
| | Because of the costs involved, it is important to ensure that the benefits are sustained. Thus, the drug production process will continue to be monitored. | ||||
While the evaporating cloud (EC) in Figure was constructed after the trial project, we note that had the project team mapped it as an EC at the time, they may well have devised this or a better solution, rather than adopting the trial and error approach of trying the D′ solution first and then realising it did not meet both sides of the EC. In hindsight it is easy to see why the hybrid two-tier solution was needed. However, the approach adopted helped to validate the two-tier solution, by highlighting the problems arising both from D, and from D′.
An advantage often observed when using the TOC tools is that they legitimise and explain multiple viewpoints, rather than looking for who’s right and who’s wrong. While complex and relatively time-consuming to construct the detailed analysis, applying this TOC approach paved the way for a thorough resolution to the conflicts identified. With wide buy-in to the tools being a pre-requisite to successfully mapping the situation and the solutions, small steps were sought first, including the pilot described above, before attempting a system-wide implementation. As Cheng (Citation2010, p. 825) observes, without buy-in to the process, without understanding the need to answer the question “why?”, without the proof of a need for change, symptoms can overwhelm. Logical thinking can take a back seat.
4.2. Postscript to the study
The initial TOC TP analysis of the hospital situation was carried out in 2006 as part of an MBA project by the middle three authors under guidance from the first author. The team member who then led the pilot implementation with great success later left to head another health sector organisation, hence is no longer there to lead the change. In this study, the resulting improved communication between Pharmacy and the Cancer Centre led to better collaboration on a number of other issues, such as the introduction of multi-disciplinary team meetings to discuss treatment options and make resource allocation decisions, and ongoing collaboration to ensure seamless service delivery to patients.
On a visit to the Cancer Centre four years later, the pilot project leader noted that the two-tier process (making the low cost drugs prior to specialist approval) remained. In accordance with a directive from a new board, the pharmacy had switched to outsourcing production of low cost drugs, meaning that the pharmacy was making only the high cost drugs that required specialist approval. She observed that, regardless of the appropriateness of the decision to outsource, the TOC study had provided a valuable process that distinguished between these two types of drugs to provide more seamless service delivery to cancer patients. Two years on from this observation, the hospital had reverted to in-house production, as outsourcing had not proven to be as effective as in-house production. Ten years later, the two-tier solution is still effectively in place with chemo drugs being made before confirmation for around 90% of patients, with only minor modifications. The introduction of a chair booking system and multi-disciplinary team meetings for scheduling clinic lists have improved the flow. A small sample of cancer patients spoken to by one of the authors in 2017 reported a “seamless experience” as a typical response to a question about service delivery (pers. exp.).
As far as we know, the hospital did not apply the results elsewhere after the TOC champion left, but continues to lobby the MoH regarding funding – the struggle to meet ever-increasing demand within constraining resources remains a vexed issue. Without trained TOC practitioners or similar champions in the organisation (as in Roadman et al., Citation1995), wider or ongoing application is unlikely to be achieved. Cheng (Citation2010) argued based on a case study in a Singapore prison that while training in the TOC methods provides long-term success for those using them, a large proportion of training time should be spent establishing the need for change. Furthermore, a successful pilot is not enough on its own to lead to a wider roll-out; many layers of resistance will be encountered and successful continuation or expansion requires a process to develop buy-in (Goldratt-Ashlag, Citation2010). It is not uncommon for pilot implementations to suffer from diminishing buy-in, being treated as “special cases” by those who did not benefit directly from the process of change (McArdle, Citation2011). Notwithstanding these concerns, similar situations exist throughout organisations, and the methods used to resolve the Pharmacy and Cancer Centre’s issues have the potential to well work elsewhere.
4.3. Contributions of this research to practice and to the literature
As noted at the outset, Brailsford and Vissers (Citation2011) concluded that the main challenges in health care may come from organisational and logistical elements, rather than medical or scientific advances, and indeed the focus of this OR has been to address such challenges. Traditional “hard” OR has provided progress in health care applications, as noted in Royston’s (Citation2009) review of OR in UK health care, spanning 50 years and beyond, particularly in a small but key area, that of waiting in outpatient and accident and emergency departments. The present study has provided an example of the application of TOC to a similar issue of wait times in cancer treatment, resulting in patient wait time reductions of 84%, nursing staff overtime reductions of 67%, elimination of overtime for the other three staff groups, along with no increase in drug costs. Overall, this amounted to improved service for patients, better conditions for staff, and a reduction in overall cost – a win–win–win.
The study has provided fresh insights through its illustration of the power of mapping the cause–effect relationships leading to the problems, and the logic underpinning the solutions and implementation. It provides both a broad roadmap for interventions, as well as providing guidelines for local improvements. We note that Wright and King’s (Citation2006) novel set in a fictional hospital was based on an in-depth TOC analysis of a real hospital in the UK. When conducting the analysis, Wright used the standard TP approach starting with a Current Reality Tree, which pointed to the same core conflict as that depicted in our generic cloud arrived at via the 3-cloud method shown in Figure . Wright has also performed similar analyses in the USA – again with the same findings (personal communication). Such corroboration of findings from three different continents and using different TOC methods lends weight to the findings, and to the TOC approaches used. Furthermore, the findings have also been supported by a study undertaken using other systems thinking methods. Cavana, Davies, Robson, and Wilson (Citation1999) examined a similar issue from a system dynamics perspective that showed the significance of the tension between clinicians and health managers. Their study supports the view that to provide a quality health service, within the resources available, requires the cooperation of both policy makers and clinicians, to bridge the gap between the two paradigms.
5. Conclusions
This paper has reported on an application of the TOC thinking process to issues around resource use in a large public hospital. We report on a detailed analysis conducted as part of an MBA project, followed by a trial project implementation which achieved success over a sustained period, by developing a win–win–win solution that improved care at reduced cost. Outcomes include dramatically reduced patient wait times, improved patient satisfaction, reduced staff overtime across four professional groups of staff, increased efficiencies, smoothed workload and improved staff morale and retention. At the same time, patient safety and integrity of treatment have been maintained and production capacity increased, within a predefined budget. This study adds to the existing publications describing applications of TOC in health care, and provides an example for applications of systems-based soft OR methods to address long-standing issues in other equally challenging domains.
Disclosure statement
No potential conflict of interest was reported by the authors.
Acknowledgements
The authors wish to acknowledge the clinicians, managers, nurses and pharmacists in the hospital who have contributed to this work and provided assistance with information gathering, and colleagues, two anonymous reviewers and two editors who have provided valuable comments. The paper is dedicated to the professionals who work in this area and to the patients who undergo chemotherapy treatments.
References
- Barnard, A. , & Immelman, R. (2010). Holistic TOC implementation case studies: Lessons learned from the public and private sector. In J. F. Cox & J. G. Schleier (Eds.), Ch 16 in The Theory of Constraints Handbook (pp. 455–498). New York, NY : McGraw-Hill.
- Brailsford, S. , & Vissers, J. (2011). Invited review: OR in healthcare: A European perspective. European Journal of Operational Research , 212 , 223–234.10.1016/j.ejor.2010.10.026
- Breen, A. M. , Burton-Houle, T. , & Aron, D. C. (2002). Applying the Theory of Constraints in healthcare: Part 1 – The philosophy. Quality Management in Healthcare , 10 (3), 40–46.10.1097/00019514-200210030-00010
- Burton-Houle, T. (2001). What if my organization’s goal is not to make money? TOC Times Quarterly Newsletter . September 2001 issue of AGI’s newsletter. Retrieved April 5, 2011, from http://www.goldratt.com/for-cause/partnerperspsep2001toct.htm
- Cavana, R. , Davies, P. , Robson, R. , & Wilson, K. (1999). Drivers of quality in health services: Different worldviews of clinicians and policy managers revealed. System Dynamics Review , 15 (3), 331–340.10.1002/(ISSN)1099-1727
- Cheng, C. (2010). Theory of Constraints in prisons. J. F. Cox & J. G. Schleier (Eds.), Ch 27 in The Theory of Constraints handbook (813–841). New York, NY : McGraw-Hill.
- Cox, J. F., III , Blackstone, J. H. , & Schleier, J. S. (2003). Managing operations: A focus on excellence . Great Barrington, MA: North River Press.
- Cox, J. F., III , Mabin, V. , & Davies, J. (2005). A case of personal productivity: Illustrating methodological developments in TOC. Human Systems Management , 24 , 39–65.
- Cox, J. F., III , Robinson, T. M. , & Maxwell, W. (2014). Applying the “Theory of Constraints” to solve your practice’s most vexing problem. Family Practice Management , Sept/Oct , 18–22.
- Cox, J. F., III , Robinson, T. M. , & Maxwell, W. (2015). Unconstraining a doctor’s office. Industrial Engineer , 48 , 28–33.
- de Bono, E. (1988). Tactics: The art and science of success . London: Fontana/Collins.
- Dettmer, H. W. (2007). The logical thinking process: A systems approach to complex problem solving . Milwaukee WI: Quality Press.
- Dettmer, H. W. (2011). Our goal is … What is our goal? Goal systems international. Retrieved from http://www.goalsys.com/books/documents/WhatisOurGoal-v5_000.pdf
- Gardiner, S. C. , Blackstone, Jr, J. H. , & Gardiner, L. R. (1994). The evolution of the Theory of Constraints. Industrial Management , May-June, 13–16.
- Garvin, D. A. , & Roberto, M. A. (2001). What you don’t know about making decisions. Harvard Business Review , 79 , 108–116.
- Goldratt, E. M. (1994). It’s not luck . Great Barrington, MA: The North River Press.
- Goldratt, E. M. , & Cox, J. (2004). The goal: A process of ongoing improvement (20th (anniversary ed.). Great Barrington, MA: The North River Press.
- Goldratt-Ashlag, E. (2010). The layers of resistance – the buy-in process according to TOC. Ch 20 in The Theory of Constraints handbook . J. F. Cox & J. G. Schleier (Eds.). New York, NY : McGraw-Hill, 571–585.
- Hunink, M. G. (2001). In Search of Tools to Aid Logical Thinking and Communicating about Medical Decision Making. Medical Decision Making , 21 (4), 267–277.10.1177/0272989X0102100402
- Hunink, M. G. , Glasziou, P. , Siegel, J. , Weeks, J. , Pliskin, J. , Eistein, A. , & Weinstein, M. (2001). Decision making in health and medicine: Integrating evidence and values (2005, Fourth printing). Cambridge: Cambridge University Press.
- Kendall, G. I. (1998). Securing the future: Strategies for exponential growth using the Theory of Constraints . Boca Raton, FL: St Lucie Press.
- Kim, S. , Mabin, V. J. , & Davies, J. (2008). The theory of constraints thinking processes: Retrospect and prospect. International Journal of Operations and Production Management , 28 (2), 155–184.10.1108/01443570810846883
- Knight, A. (2003, September 9). Making TOC the main way of managing the health system . TOCICO Upgrade Conference, Cambridge.
- Knight, A. (2014). Pride and joy . Aldbury: Never Say I know.
- Lepore, D. , & Cohen, O. (1999). Deming and Goldratt: The Theory of Constraints and the system of profound knowledge . Great Barrington, MA: The North River Press.
- Lubitsh, G. , Doyle, C. , & Valentine, J. (2005). The impact of Theory of Constraints (TOC) in an NHS trust. Journal of Management Development , 24 (2), 116–131.10.1108/02621710510579482
- Mabin, V. J. , Babington, S. , Caldwell, V. , Yee, J. , & Moore, R. M. (2011, November). Change is as good as a rest: Using the Theory of Constraints to resolve resource constraints in a large public hospital. Proceedings of the 42nd Annual Meeting of the Decision Sciences Institute (pp. 4271–4279). Boston, MA .
- Mabin, V. J. , & Balderstone, S. J. (2003). The performance of the Theory of Constraints methodology: Analysis and discussion of successful TOC applications. International Journal of Operations & Production Management , 23 (6), 568–595.10.1108/01443570310476636
- Mabin, V. J. , & Davies, J. (2010). The TOC thinking processes: Their nature and use – reflections and consolidation. In J. F. Cox & J. G. Schleier (Eds.), Ch 23 in The Theory of Constraints handbook (pp. 631–669). New York, NY : McGraw-Hill.
- Mabin, V. J. , Davies, J. , & Cox, J. (2006). Using the Theory of Constraints thinking processes to complement systems dynamics’ causal loop diagrams in developing fundamental solutions. International Transactions in Operational Research , 13 , 33–57.10.1111/itor.2006.13.issue-1
- Mabin, V. J. , Davies, J. , & Kim, S. (2009). Rethinking tradeoffs and OR/MS methodology. Journal of the Operational Research Society , 60 , 1384–1395.10.1057/jors.2008.90
- McArdle, M. (2011). The value of health care experiments . The Atlantic . Retrieved from: https://www.theatlantic.com/business/archive/2011/01/the-value-of-health-care-experiments/70106/
- Mingers, J. , & Rosenhead, J. (2004). Problem structuring methods in action. European Journal of Operational Research , 152 (3), 530–554.10.1016/S0377-2217(03)00056-0
- Pauker, S. G. (2006). We all fall down: Goldratt’s theory of constraints for healthcare systems. (Book Review). New England Journal of Medicine , 355 , 218–219.doi:10.1056/NEJMbkrev56896
- Peschke, R. E. , & Austin, K. M. (1999, March 22–23). Experiences using Theory of Constraints in a for-profit medical practice. The Educational Society for Resource Management . In APICS CM-SIG Symposium Proceedings (pp. 101–104). Phoenix, AZ .
- Roadman, C. H. , Benge, J. M. , McGinnis, L. P. , Yurkosky, T. P. , Adams, D. V. , Cockerham, G. C. , & Flowers, S. H. (1995, April 26–28). Theory of Constraints and the United States air force medical service. APICS Constraints Management Symposium and Technical Exhibit. Proceedings , 1 , 107–115.
- Ronen, B. (Ed.). (2005). Theory of Constraints: Practice and research. The Theory of Constraints: Practice and research (pp. 1–2). Amsterdam: IOS Press, Editorial.
- Ronen, B. , Pliskin, J. S. , & with S. Pass (2006). Focused operations management for health services organizations . San Francisco, CA: Jossey-Bass.
- Royston, G. (2009). One hundred years of Operational Research in Health – UK 1948–2048. Journal of the Operational Research Society , 60 , S169–S179.10.1057/jors.2009.14
- Scheinkopf, L. J. (1999). Thinking for a change: Putting the TOC thinking processes to use . Boca Raton, FL: St Lucie Press/APICS Series on Constraints Management.10.1201/CRCSLPCONMGT
- Scheinkopf, L. J. (2010). Thinking processes including S&T trees. In J. F. Cox & J. G. Schleier (Eds.), Ch 25 in The Theory of Constraints handbook (pp. 729–786). New York, NY : McGraw-Hill.
- Schragenheim, E. (1998). Management dilemmas: The Theory of Constraints approach to problem identification and solutions . Boca Raton, FL: St Lucie Press/ APICS Series on Constraints Management.
- Shoemaker, T. E. , & Reid, A. (2005). Applying the TOC thinking process: A case study in the government sector. Human Systems Management , 24 , 21–37.
- Sommer, K. A. , & Mabin, V. J. (2015). Insights into the eldercare conundrum through complementary lenses of Boardman’s SSM and TOC’s Evaporating Cloud. European Journal of Operational Research , 248 (1), 286–300 doi:10.1016/j.ejor.2015.06.033
- Stratton, R. , & Knight, A. (2009, June 09). Utilising buffer management to manage patient flow. Proceedings of the 16th International Annual EurOMA Conference (Implementation – realizing Operations Management) , Göthenburg.
- Taylor, III, L. J. , & Sheffield, D. (2002). Goldratt’s thinking process applied to medical claims processing. Hospital Topics , 80 (4), 13–21.10.1080/00185860209598005
- Umble, M. , & Umble, E. J. (2006). Utilizing buffer management to improve performance in a healthcare environment. European Journal of Operational Research , 174 , 1060–1075.10.1016/j.ejor.2005.02.059
- Wadhwa, G. (2010). Viable vision for healthcare systems. In J. F. Cox & J. G. Schleier (Eds.), Ch 31 in The Theory of Constraints handbook (pp. 899–953). New York, NY : McGraw-Hill.
- Watson, K. J. , Blackstone, J. H. , & Gardiner, S. C. (2007). The evolution of a management philosophy: The theory of constraints. Journal of Operations Management , 25 , 387–402.10.1016/j.jom.2006.04.004
- Wright, J. (2010). TOC for large-scale healthcare systems. In J. F. Cox & J. G. Schleier (Eds.), Ch 32 in The Theory of Constraints handbook (pp. 955–979). New York, NY : McGraw-Hill.
- Wright, J. , & King, R. (2006). We all fall down. Goldratt’s Theory of Constraints for healthcare systems . Great Barrington, MA: North River Press.
- Yee, J. , Ogden, S. , & Snowling, K. (2007). Change is as good as a rest – Cancer centre staff and patient benefits due to practice change at Wellington pharmacy department: A comparison of patient wait times and efficiencies as a result of changes to chemotherapy delivery practices . Internal Quality Quest Report, Wellington, NZ: Capital & Coast District Health Board.