
ABSTRACT
The Vanderbilt Fatigue Scale (VFS-A) is a self-reported scale for assessing listening-related fatigue among adults with hearing loss and communication-related difficulties. This study aims to translate the VFS-A into Kannada and validate it among the Indian population. The original version of the VFS-A was translated and culturally adapted into Kannada according to widely accepted guidelines for cross-cultural adaptation of scales for different languages. This involved forward translation, backward translation, critical assessment by an expert panel, cognitive debriefing, and validation measures. In the validation phase, the VFS-A was administered to 276 participants with hearing loss, along with a standard hearing assessment. The Fatigue Severity Scale (FSS) was used to assess convergent validity. The VFS-A has high internal consistency (Cronbach's α = 0.976) across items and sub-domains. An exploratory factor analysis revealed that the Kannada version of VFS-A data was satisfactorily fit, assuming a unidimensional factor model structure. Assessment of associations between FSS and VFS-A scores revealed a moderate positive correlation (r = 0.422; p = 0.001), suggesting good convergent validity. The Kannada version of the VFS-A is a psychometrically valid tool for assessing listening-related fatigue that may be useful for clinical and research purposes.
Introduction
Subjective fatigue is a mood state associated with extreme tiredness and a lack of energy to continue performing a task (Hornsby, Naylor, & Bess, Citation2016b). The feeling of fatigue can be mainly attributed to the sustained application of mental or physical effort. In addition to subjective feelings of fatigue, sustained effort applied over time can lead to degraded physical and cognitive performance, such as difficulty maintaining attention and slower cognitive processing abilities (Bryant, Trinder, & Curtis, Citation2004; DeLuca, Citation2005). In recent years, the term ‘listening-related fatigue’ has been widely used and is defined as a type of fatigue associated with the sustained application of effort during listening tasks (Davis et al., Citation2021; Pichora-Fuller et al., Citation2016). Listening-related fatigue is a common experience among individuals with hearing loss (Pichora-Fuller et al., Citation2016). Given that hearing loss is the fourth leading condition globally, the problem of listening-related fatigue may be widespread (Citation2024). When severe, the impact of listening-related fatigue can be substantial, leading to feelings of exhaustion, reduced motivation to engage, and decreased performance on auditory tasks that require sustained attention, such as listening to speech in noisy environments (Holman, Hornsby, Bess, & Naylor, Citation2021). Such issues can significantly impact the quality of life in persons with hearing loss (Davis et al., Citation2021).
Subjective fatigue can be assessed using two types of measuring metrics – generic and disease-specific. Generic fatigue measures are designed so that they can be used to quantify fatigue in individuals with a broad range of health conditions or symptoms. In contrast, disease-specific fatigue measures are designed to assess fatigue associated with specific health conditions (e.g., cancer). Generic measures offer the advantage of being useful for assessing fatigue in diverse populations, while disease-specific measures may be somewhat more sensitive to subtle variations in fatigue associated with the target disease (Patrick & Deyo, Citation1989). Research findings using both generic and disease-specific measures, suggest that fatigue is a common problem for individuals with various chronic health conditions such as cancer, neurological disorders, and many others (Barnes & Van Dyne, Citation2009; Curt et al., Citation2000; Strasser, Müller-Käser, & Dietrich, Citation2009). In relation to hearing loss, fatigue has been examined indirectly through qualitative research and online reports (Gunnel & Ahlner, Citation2000; Hétu, Riverin, Lalande, Getty, & St-cyr, Citation1988; Nachtegaal et al., Citation2009). These indirect reports and further exploration suggests hearing loss, like many other chronic conditions, increases the risk for subjective fatigue (Bess & Hornsby, Citation2014; Kramer, Kapteyn, & Houtgast, Citation2006). These studies suggest that individuals with hearing difficulties, even when controlling for their line of work, noise exposure, job experience, speech comprehension and other factors, must increase their attention, focus and effort at the workplace, thus increasing their risk for fatigue.
More recently, fatigue in individuals with hearing difficulties has been assessed using standardized and valid generic fatigue measures, such as the Profile of Mood States (POMS) (Mcnair, Lorr, & Droppleman, Citation1971) and the Fatigue Severity Scale (FSS) (Krupp, Citation1989), and disease-specific instruments such as the Multidimensional Fatigue Symptom Inventory-Short form (MSFI-SF) (Stein, Jacobsen, Blanchard, & Thors, Citation2004). For example, using the POMS, researchers found significant differences in the prevalence of severe fatigue (defined as ratings > 1.5 standard deviations above normative means) between adults seeking help for their hearing problems and normative data (Hornsby & Kipp, Citation2016a). Fatigue associated with hearing difficulties has also been assessed using the FSS. Researchers examining fatigue in individuals with vestibular schwannomas found significant fatigue (defined as a mean FSS score of ≥4.0) in more than 50% of the schwannoma participants compared to only 25% of their controls (Dhayalan, Lund-Johansen, Finnkirk, & Tveiten, Citation2019). Furthermore, a study by Dwyer et al. (Citation2019) studied the association between hearing loss, listening effort and fatigue. For two groups of people (adults with and without hearing loss), salivary cortisol samples and subjective ratings of fatigue using POMS were studied at seven different time points. It was found that adults with hearing loss required significantly more effort and focus on auditory tasks than the controls. This increased effort is associated with listening-related fatigue. Interestingly, they found no difference in ratings of fatigue between their hearing loss and control groups when using a generic fatigue measure (i.e., the POMS). However, when using study-specific questions asking about listening-related fatigue they found large differences, with the hearing loss group reporting significantly more fatigue. Similar findings have been reported in the paediatric population. This can lead us to the conclusion that generic fatigue measures may not be as sensitive as disease-specific measures i.e., in this case, listening-related fatigue. Using a generic measure, Hornsby et al. (Citation2017) found that children with hearing loss experienced more fatigue than age-matched controls without hearing loss. The fatigue experienced by the children with hearing loss was similar to, or greater than, reported by children with other chronic health conditions for which fatigue is a primary complaint (Hornsby et al., Citation2017; Hornsby, Davis, & Bess, Citation2021a). Results using generic measures have shown that fatigue can be a significant problem for many people with hearing problems, in general. However, evidence suggests that these generic measures may assess general fatigue but may not be optimal for assessing fatigue associated with hearing loss-related listening difficulties (Dwyer et al., Citation2019). The Vanderbilt Fatigue Scale for Adults (VFS-A) is a reliable and valid measure of listening-related fatigue that was developed to fill this gap and provide clinicians with a more holistic approach to assessing fatigue in individuals with communication challenges (Hornsby et al., Citation2021b).
The Vanderbilt Fatigue Scale for Adults (VFS-A) is a self-report fatigue scale that measures the listening-related fatigue resulting from an individual's daily life experiences over a typical, one-week time period. It is designed to measure the fatigue explicitly experienced in the context of listening. The VFS-A has been used recently and found more sensitive to changes in fatigue post-intervention with hearing aids than a generic fatigue measure (Holman, Drummond, & Naylor, Citation2021). Using a longitudinal study design, researchers compared fatigue ratings between first-time hearing aid users and a control group that did not receive hearing aids. They found no significant difference in fatigue scores between groups at baseline (i.e., before receiving a hearing aid) but using the VFS-A they found significant differences between the groups at three post-baseline assessments, i.e., at two weeks, three months and six months post-hearing aid fitting. No such differences were noted when fatigue was assessed using a generic instrument (Holman et al., Citation2021). Likewise, VFS-A subscale scores have been found sensitive to subtle age-related differences (i.e., younger vs older adults) in the relationship between fatigue and sensory processing sensitivity (McGarrigle & Mattys, Citation2023). Finally, a recent study by Adams et al. (Citation2023) found that the paediatric version of the VFS, the VFS-Peds (Hornsby et al., Citation2022), was more sensitive to fatigue associated with hearing loss than generic measures (Adams et al., Citation2023).
While the VFS-A was designed to target listening-related fatigue associated with hearing loss, it may also be useful for other populations who experience listening-related difficulties, such as tinnitus sufferers and individuals with auditory processing disorders (Hornsby et al., Citation2021b). Despite the growing literature on the impact of listening-related fatigue, there is a lack of validated instruments to measure this construct in non-English-speaking populations. Thus, a validated version of the VFS-A in other languages is crucial to enable healthcare providers to accurately assess and manage patient listening-related fatigue.
India is a linguistically diverse country, with over 19,500 languages or dialects spoken by its population. Among these various languages, Kannada is one of the major Dravidian languages spoken in the southern state of Karnataka. Based on the linguistic standards, it is a morphologically complex agglutinative Indian language and is alphasyllabic. It consists of a sentence structure as follows – Subject-Object-Verb, which is quite contrary to English, which largely follows a subject-verb-object structure. The native speakers of Kannada constitute approximately 43.5 million, or 3.61% of India's total population. Due to these language and cultural differences among the people, the prevalence of hearing loss, and the importance of assessing listening-related fatigue in individuals with hearing loss, it is essential to have valid and reliable listening-related fatigue scales in Kannada. Therefore, the present study aimed to translate and validate the VFS-A into Kannada. This can provide a standardized tool to assess listening-related fatigue in Kannada-speaking adults with hearing-related problems and aid in the accurate diagnosis, monitoring of treatment outcomes, and research.
Methodology
The current study was conducted at the Department of Speech and Hearing, Kasturba Hospital, Manipal. For ethical considerations, permission was obtained from the Institutional Ethics Committee, Kasturba Hospital, Manipal (IEC: IEC1-186-2022) and registered under the Clinical Trial Registry of India (CTRI/2023/01/048681). The study is divided into two phases – Phase I: Translation of VFS-A to Kannada language and Phase II: Field trial and validation of Kannada version of VFS-A.
The translation and validation procedures follow the guidelines of Hall et al. (Hall et al., Citation2018). It is performed sequentially based on the steps shown in .
Figure 1. Schematic representation of the step-by-step translation and validation process of the Kannada version of VFS-A.
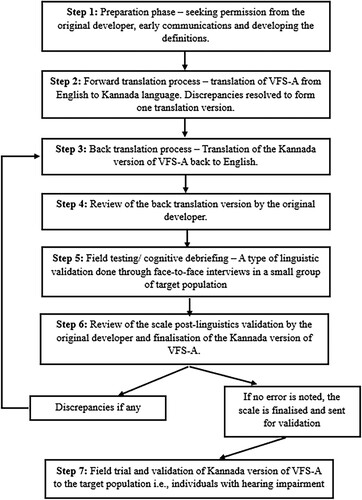
Phase I: method: translation of the VFS-A into Kannada language
To comply with copyright, permission was sought from the original developers to initiate the translation process. The details of the translation process were documented in a reconciliation report. (link: https://www.vumc.org/vfs/translating-vfs)
Forward translation process: Two bilingual translators whose first language is Kannada and who were based in India independently performed the forward translation. They were instructed to maintain equivalence, accessibility, and terminology based on an item's concept definition provided by the original test developer (Hornsby et al., Citation2021b). The process resulted in two individually translated scale versions (F1 and F2). These were reconciled into a single version of the forward translation by a third reviewer with proficiency similar to the two forward translators. The reviewer independently made the decision based on the two versions and reconciled the two version of forward translation versions to one single version.
Back translation process: The scale was back-translated into English for review by the original test developer to ensure the translated items maintained the intent of the original test items. This procedure involved one bilingual translator based in India who was proficient in English and Kannada. The original forward and back translations and details of the reconciliation process were recorded in a reconciliation report.
Review from the original developer: The reconciliation report was provided to one of the original developers of the scale to ensure the back-translated items were conceptually equivalent to the original scale items. The original developer gave suggestions and inputs by reviewing the backward translation. Based on this review, the forward translation was revised as needed. The revised forward translation was then back-translated into English and returned to the original developers for additional review. This process continued until there was consensus that the translated scale was linguistically appropriate and conceptually equivalent to the original scale.
Cognitive debriefing: A small group (N = 5) of the target population (individuals with hearing loss and/or tinnitus) was recruited, and face-to-face interviews were conducted. The main aim of this procedure was to ensure that participants understood each item and interpreted them in a way that was consistent with the intent of the original items. Individuals were instructed to think aloud when responding to each item on the scale. Item modifications were considered if 2 out of 5 individuals found the item unclear. This method provided an appropriate linguistic validation of the scale. After the translation process, cognitive debriefings, and review of any revisions, a final version of the scale was drafted and administered during the Phase II validation.
Phase I: results
Overall, the Kannada version of VFS-A underwent a standard translation process, including revisions and linguistic validation. In forward translation, a reviewer independently examined both versions of VFS-A, consolidating them into a single version by analysing grammatical and linguistic content. Most modifications were done to make the Kannada version of VFS-A more comprehensible to the vast population. Any discrepancies during the process were resolved by discussing with the members of the research team. This approach resulted in the refinement of the initial Kannada version of the scale.
Upon documenting both the forward and backward translations of the scale to the reconciliation report, the original developer reviewed and shared comments. Comments focused primarily on confirming that minor differences in words or phrases in the back translation compared to the original English items did not affect conceptual equivalence. Minor suggestions for simplifying complex phrases or sentences were also provided to approximate the scale's original items better. For example, in Kannada, ‘ಕೇಳಲು ಕಷ್ಟವಾದಾಗ ನಾನು ಮಾನಸಿಕವಾಗಿ ದಣಿಯುತ್ತೇನೆ’ translated to ‘I get mentally exhausted when it's hard to listen.’ In this context, it was suggested that in English, the terms ‘tired’ and ‘exhaustion’ are related but not the same. Exhaustion implies an extreme level of tiredness. As this item did not target such a severe response of fatigue, changes were made accordingly by replacing the term ‘ದಣಿಯುತ್ತದೆ’ with ‘ಸುಸ್ತಾಗುತ್ತದೆ.’ With this suggestion, apt words were added to the items to make them more comprehensible to the context. The original developer's input and the resultant revisions to the updated Kannada version of VFS-A were documented in the reconciliation report (link: https://www.vumc.org/vfs/translating-vfs).
The final step of validation was cognitive debriefing. This process was undertaken to ensure the translated items were neutral in dialect. The participants were asked to report any word or phrase in the question (items) as difficult to perceive. If yes, is there any simpler/suitable alternative to the same? For example, ಕೇಳಲು has two meanings – to ask and also to listen. To reduce the bias in the items, it was changed to ಕೇಳಿಸಿಕೊಳ್ಳಲು (which translated to only listen). To avoid confusions further, the words were replaced accordingly. Additionally, the term ‘listening-related fatigue’ was unfamiliar to some participants, therefore we expanded the instructions to better explain this phenomenon. The instructions for responding to the scale were also slightly revised to improve participants understanding. For example, the listening-related fatigue is a recently coined terminology and hence, defining what it means initially for the participants would make it easier for them to understand. With this modification, we also expected a more meaningful response of the scale. After this procedure, the final version of the scale was developed and was ready for validation.
Phase II: method: field trial and validation of the Kannada version of VFS-A
The final Kannada version of the VFS-A was validated on a group of adults with hearing problems recruited from our clinical population. The validation procedure included an assessment of dimensionality (construct validity), internal reliability, and convergent validity. A factor analysis was used to assess dimensionality and explain patterns of correlations within the scale (items and subscales). By examining the factor structure, one can identify how items of the scale can be grouped, providing insights into the scale's dimensionality. Internal reliability measures the consistency of responses across the items of the scale. Cronbach's alpha is used for this purpose, and it calculates the average correlation among all items, indicating how well they measure the same underlying construct. A higher alpha value (>0.7) suggests greater internal consistency, i.e., the items in VFS-A are reliable measures of the targeted construct in the Kannada-speaking population. Finally, to assess convergent validity, Spearman's rank correlation coefficient was used. Convergent validity refers to the extent to which an instrument (in this case, VFS-A) is correlated with another instrument (i.e., FSS) that measures a similar construct. We expect to observe a positive correlation between VFS-A and FSS scores, providing evidence of convergent validity. Collectively, these validation measures aim to ensure the robustness and accuracy of the Kannada version of VFS-A.
Participants: Participants included adults visiting the Department of Speech and Hearing, Kasturba Hospital, Manipal, who had been diagnosed with hearing loss of varying degrees, i.e., had at least a minimal hearing loss. Individuals with different types of hearing losses (sensorineural, conductive, or mixed), laterality of hearing losses (unilateral/ bilateral loss), and the presence or absence of tinnitus, were included in the validation process. The sample was comprised of individuals whose mother tongue was Kannada. The majority of participants independently completed a hard copy of the scale during their clinic visit. However, some participants needed assistance, such as having the scale read to them due to poor vision. Those with known neurological or psychological impairments and chronic health conditions were excluded from the study. Information about the study, its purpose, and participants’ roles were explained, and written informed consent was obtained from all participants. Routine audiometry consisting of both air conduction (250 Hz to 8kHz) and bone conduction (250 Hz to 4kHz) (British Society of Audiology, Citation1985) thresholds were assessed. Participants were categorized based on the pure tone average of 500, 1000 and 2000Hz. Those worse than 25 dB HL pure tone average (i.e., mild and above) in at least one ear were grouped as individuals with hearing loss and the participants having thresholds between 15 and 25 dB HL for the pure tone average of 500, 1000 and 2000Hz at least in one ear were grouped under the minimal hearing loss category with no definite type of loss. All participants were asked to complete the Kannada version of the VFS-A and the Fatigue Severity Scale (FSS) (Refer to the participants’ demographics as mentioned in ).
Vanderbilt Fatigue Scale for Adults – Kannada version: Like the original VFS-A (Hornsby et al., Citation2021b), the Kannada version is a 40-item self-report scale designed to assess listening-related fatigue in individuals with hearing loss or other listening difficulties. The VFS-A consists of 40 items and subscales, i.e., social, cognitive, emotional, and physical. Examples of test items include ‘I feel worn out from everyday listening’ and ‘It takes much energy to listen and understand.’ Individuals are instructed to select responses for each item that best describes their day-to-day experience over a typical week. Respondents choose their responses using a 5-point Likert scale (0–4), with response options for most items (n = 31) ranging from never/almost never (0) to always/almost always (4) and options for the remaining items (n = 9) ranging from strongly disagree (0) to strongly agree (4). Summed scores can be calculated by simply summing the numeric Likert responses to determine a total fatigue score (all 40 items) or subscale scores (10 items/subscale). Total summed scores range from 0 to 160 while subscale scores range from 0 to 40 with higher values reflecting more fatigue. Scale responses can also be used to calculate item response theory (IRT) scale scores (total and subscale scores). IRT scale scores are a type of standardized score (like z scores) that takes the sensitivity of each test item into account when calculating a score, resulting in more precise estimates of the construct of interest (i.e., an individual's fatigue in this case). Typical scores generally fall within the range of −3 to +3, with higher values reflecting more fatigue (Hornsby et al., Citation2021b). The English version of VFS-A has high marginal reliability (r = .98), adequate test–retest reliability (r = .60 – .69), and good construct validity across the adult age range.
Fatigue Severity Scale – Kannada version (FSS): The FSS (Jagadish, Natarajan, & Solomon, Citation2021) is a 9-item, generic, self-report scale designed to assess fatigue in individuals with a variety of chronic conditions and disorders. The scale estimates the impact of fatigue on daily activities and relationships by assessing its effect on motivation, physical activity, work, family, and social life. Respondents are instructed to rate between 1 and 7 which they feel best fits the statements provided and these refer to their response within the last week. The scale consists of a 7-point Likert agreement rating scale ranging from 1 (‘completely disagree’) to 7 (‘completely agree’) to indicate their agreement with nine statements about fatigue. The total scores derived by summing individual responses range from a minimum score of 9 to a maximum score of 63. The higher score represents increased fatigue. A more common way of scoring this scale is by averaging the nine item scores. An average FSS cut-off score of four or more indicates problematic fatigue.
Statistical analysis
To evaluate the quality of the translated VFS-A and its items, we conducted factor analysis using Jamovi (version 2.3.21.0) (Jamovi, Citation2024) on all the participants’ data. The sampling adequacy was assessed using the Kaiser-Meyer-Olkin (KMO) measure and Bartlett's test of sphericity was used to ensure that the data were eligible for factor analysis. The analyses conducted were based on the summed scores. It was performed by extracting 1–4 factors, and the fit indices were compared across the models. We used the following empirically supported guidelines to assess the goodness of model fit: a root-mean-square error of approximation index (RMSEA) (Keenan & Stevens, Citation2015; Steiger & Lind, Citation1980) of < 0.08 are acceptable, a standardized root-mean-square residual (SRMR) of < .08, a comparative fit index (CFI) (Bentler, Citation1990) and Tucker-Lewis index (TTL) (Tucker & Lewis, Citation1973) > .95 (Hu & Bentler, Citation1999). Both summed and IRT scores were analysed independently for the following two validation measures. Internal consistency of the VFS-A was assessed by measuring Cronbach's alpha. Furthermore, item-total correlation was analysed which is a measure used in assessing the internal consistency of a scale. It assesses how well an individual item correlates with the total score of the rest of the items. A higher item-rest correlation (>0.05) indicates that the item is more consistent with the rest of the scale. Convergent validity was assessed using Spearman's rank correlation coefficient to examine the association between the VFS-A and FSS. Statistical significance was set as p-values < 0.05.
Phase II: results
A total of 276 participants were included in the study. Descriptive statistics of the participants, along with their respective VFS-A and FSS scores, are depicted in and , respectively. To depict the scores of all the participants, represents a histogram showing the distribution of VFS-A total summed scores and the percentage of responses from each set of items. Furthermore, a sub-analysis of VFS-A scores based on the categorization of hearing loss is depicted in .
Figure 2. Histogram showing the distribution of VFS-A summed scores (Kannada version) for our test sample.
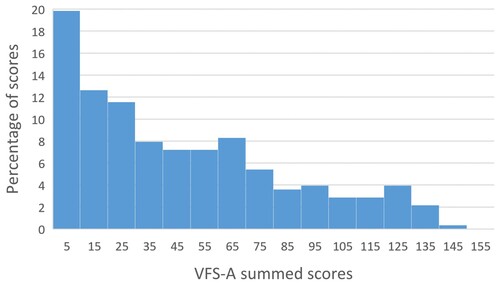
Table 1. Descriptive statistics of the participants were included for validation (n = 276).
Table 2. Results of VFS-A and FSS.
Table 3. Sub-analysis of VFS-A scores categorized based on the type of hearing loss.
Factor analysis
Based on the statistical evaluation, the KMO index of 0.965 (>0.06) indicated sample adequacy and Bartlett's test of sphericity was significant, suggesting that data were suitable for factor analysis. The results from factor analysis revealed almost all items loaded highly onto a single factor – consistent with a unidimensional model. However, the quality of a 1-factor model fit varied across fit indices. A 1-factor model provided a good to moderate fit to the data based on the SRMR (0.0536) and RMSEA (0.0753) measures, respectively. In contrast, while above 0.8, regardless of the number of factors included in factor analysis (i.e., 1–4 factors), TLI and CFI model fit indices remained less than the 0.95 criterion (see ). Similar fit indices were assessed using 2, 3 and 4 factor model, and the results are depicted in .
Table 4. Factor analysis results based on the Kannada version of the VFS-A.
Internal consistency
The VFS-A showed high internal consistency based on Cronbach's alpha derived using both summed (α = 0.976) and IRT scores (α = 0.977). Similarly, the inter-item correlation resulted in a high correlation with values ranging from 0.891 to 0.928 for summed scores and from 0.907 to 0.937 for IRT scores, suggesting that VFS-A and its sub-scales are reliable measures of the targeted construct, i.e., listening-related fatigue (see ).
Table 5. Internal consistency measures (Cronbach's alpha) for VFS-A scores.
Furthermore, based on item-total correlation, most items have correlations in the moderate to high range, suggesting that they generally align well with the overall scale and contribute to its reliability. Items like C3_6 (0.801), E2_2 (0.778), and S3_5 (0.783) have high item-rest correlations, suggesting they are strong contributors to the reliability of the scale. Items P3_4 (0.512) and P3_2 (0.566) have relatively lower item-rest correlations compared to other items in your list, which may indicate they contribute less consistently to the overall scale. Overall, it depicts that the scale is reliable (see ).
Table 6. Item-total correlation measures for VFS-A.
Convergent validity
We assessed convergent validity by examining the relationship between the Kannada versions of the FSS and the VFS-A using VFS-A total summed scores and total IRT scores. As expected, the results revealed a significant moderate positive correlation for both the summed scores (r = 0.422; p < 0.001) and IRT scores (r = 0.411; p < 0.001) suggesting that both the scales measure a similar, but not the same, construct.
Discussion
Listening-related fatigue, a prevalent phenomenon resulting from prolonged mental effort while listening, has gained significant clinical and research interest in recent years (Davis et al., Citation2021; Pichora-Fuller et al., Citation2016). Given the rising demand for assessing fatigue in individuals with hearing loss or other communication challenges, the Vanderbilt Fatigue Scale (VFS-A) was developed. To make this tool universally available, it is essential to translate it into native languages. Therefore, this study aimed to translate and validate the Vanderbilt Fatigue Scale for Adults (VFS-A) into the Kannada language.
The factor analysis results indicated a good fit, with items loaded on a single factor, suggesting a unidimensional model. These outcomes are consistent with the unidimensional structure of the original scale. The CFI and TLI suggested minor variations compared to the original scale (Original scale: CFI – 0.985, TLI – 0.984; Kannada version of VFS-A: CFI – 0.843, TLI – 0.839). The CFI and TLI values of the translated scale are greater than 0.8 suggesting closer to good fit for unidimensional model and this fit index increases from 1 to 4 factor model (TLI – 0.89). There could be few possible reasons explaining the differences in the fit indices. The original study had a fairly large sample size (n = 580), which is twice the sample of the current study. Furthermore, the diversity of the hearing-impaired population may affect the findings as the original study consisted of a wide range of individuals with self-reported hearing loss rather on the basis of pure tone average. Lastly, the variations in the language structure for both Kannada and English may play a role. As both these languages have differences in grammatical structure and content, the linguistic distinctions impact the findings. A study by Manchaiah et al., (Citation2021) (Vinay & Thammaiah, Citation2021) assessed the psychometric properties of the Kannada version of International Outcome Inventory for Hearing Aids (IOI-HA). They suggested that though factor structure remained consistent with the original scale, there were differences in the item loadings when translated to the target language and this also differed across various studies.
The VFS-A exhibited high internal consistency based on Cronbach's alpha for both summed and IRT scores (Refer to ). Similarly, the subscale and item-total correlation also indicated moderate to high correlations suggesting that they assess a similar construct i.e., listening-related fatigue. This can also be viewed as a unidimensional construct as the correlation values overlap within the sub-scales.
Another notable finding is the association between listening-related fatigue (VFS-A) and general fatigue for chronic health conditions (FSS). The VFS-A total scores and the FSS scores yielded moderate, statistically significant, associations suggesting that both scales assess a similar construct i.e., fatigue. Furthermore, the moderate correlation between the VFS and FSS might be because the VSF is hearing-specific while the FSS is a generic fatigue scale. Self-report assessment tool like VFS-A is thus vital for evaluating listening-related fatigue in individuals with listening difficulties, offering insights into their subjective experiences. While objective and physiological measures provide quantifiable data, self-report tools capture the personal impact of listening-related fatigue, including cognitive, emotional, social, and functional aspects Nevertheless, the VFS-A allows for a more refined understanding of fatigue in the context of listening and communication.
Limitations and future implications
The psychometric analysis of the current study indicates that VFS-A is a valid and reliable tool for measuring listening-related fatigue in adults with a wide range of hearing difficulties. Despite the strong psychometric findings, the study has certain limitations. For example, the lack of inclusion of test-retest reliability as one of the validation measures. This measure can be considered as the consistency of participants’ responses. Additional work examining short- and long-term reliability can yield an important psychometric finding. Another limitation is the inclusion of participants with ‘no hearing loss or tinnitus.’ A control group score can always serve as an important comparison measure, in this case, the comparison of listening-related fatigue in individuals with and without hearing loss. Future studies can include a control group or different sub-groups in measuring listening-related fatigue to explore the scores. Furthermore, studies could delve into the relationship between listening-related fatigue, and other hearing-loss-specific problems (depression, quality of life, social isolation, etc.) can be studied to determine the impact of listening-related fatigue and establish clinical test battery and intervention for the respective population.
Conclusion
In summary, many adults with hearing loss experience listening-related fatigue and its consequences, prompting the need for a psychometrically sensitive and valid tool to identify the presence and severity of listening-related fatigue. The current study describes the translation, cultural adaptation, and validation of the Kannada version of VFS-A. The scale provides a sensitive and valid measure of listening-related fatigue in adults with hearing loss. To provide standard psychometric evidence for the scale, we employed various procedures such as exploratory factor analysis, internal consistency, and convergent validity. This is the first Indian language to be considered for translation of VFS-A. Future studies may consider it a beneficial tool to be employed in various research and clinical settings.
Author contributions
The author contributions are in accordance with CreDiT author statement guidelines. Hari Prakash Palaniswamy: Conceptualization, Supervision, Methodology, Formal analysis, Investigation, Data curation, Writing-original draft, Visualization, Formal analysis Sanjana Madhukesh: Conceptualization, Methodology, Formal analysis, Writing-original draft. Kanaka Ganapathy: Methodology, Supervision, Writing – review and editing. Benjamin Hornsby: Conceptualization, Methodology, Resources, Writing - Review & Editing, Visualization.
Acknowledgements
We sincerely thank Dr. N T Bhat for his valuable contribution to the study.
Disclosure statement
No potential conflict of interest was reported by the author(s).
References
- Adams, B., Thornton, S. K., Naylor, G., Spriggs, R. V., Wiggins, I. M., & Kitterick, P. T. (2023). Exploring listening-related fatigue in children with and without hearing loss using self-report and parent-proxy measures. Frontiers in Pediatrics, 11, 1127578. doi:10.3389/fped.2023.1127578
- Barnes, C. M., & Van Dyne, L. (2009). `I’m tired’: Differential effects of physical and emotional fatigue on workload management strategies. Human Relations, 62(1), 59–92. doi:10.1177/0018726708099518
- Bentler, P. M. (1990). Comparative fit indexes in structural models. Psychological Bulletin, 107(2), 238–246. doi:10.1037/0033-2909.107.2.238
- Bess, F. H., & Hornsby, B. W. Y. (2014). Commentary. Ear & Hearing, 35(6), 592–599. doi:10.1097/AUD.0000000000000099
- British Society of Audiology. (1985). Recommended procedure for pure-tone bone-conduction audiometry without masking using a manually operated instrument. British Journal of Audiology, 19(4), 281–282. doi:10.3109/03005368509078985
- Bryant, P. A., Trinder, J., & Curtis, N. (2004). Sick and tired: Does sleep have a vital role in the immune system? Nature Reviews Immunology, 4(6), 457–467. doi:10.1038/nri1369
- Curt, G. A., Breitbart, W., Cella, D., Groopman, J. E., Horning, S. J., Itri, L. M., … Vogelzang, N. J. (2000). Impact of cancer-related fatigue on the lives of patients: New findings from the fatigue coalition. The Oncologist, 5(5), 353–360. doi:10.1634/theoncologist.5-5-353
- Davis, H., Schlundt, D., Bonnet, K., Camarata, S., Bess, F. H., & Hornsby, B. (2021). Understanding listening-related fatigue: Perspectives of adults with hearing loss. International Journal of Audiology, 60(6), 458–468. doi:10.1080/14992027.2020.1834631
- DeLuca, J., Ed. (2005). Fatigue as a window to the brain. The MIT Press. doi:10.7551/mitpress/2967.001.0001
- Dhayalan, D., Lund-Johansen, M., Finnkirk, M., & Tveiten, ØV. (2019). Fatigue in patients with vestibular schwannoma. Acta Neurochirurgica, 161(9), 1809–1816. doi:10.1007/s00701-019-04003-2
- Dwyer, R. T., Gifford, R. H., Bess, F. H., Dorman, M., Spahr, A., & Hornsby, B. W. Y. (2019). Diurnal cortisol levels and subjective ratings of effort and fatigue in adult cochlear implant users: A pilot study. American Journal of Audiology, 28(3), 686–696. doi:10.1044/2019_AJA-19-0009
- Gunnel, A. M. B., & Ahlner, B. O. H. (2000). Quality of life of hearing-impaired persons who have participated in audiological rehabilitation counselling. International Journal for the Advancement of Counselling, 22, 225–240.
- Hall, D. A., Zaragoza Domingo, S., Hamdache, L. Z., Manchaiah, V., Thammaiah, S., Evans, C., Wong, L. L. N., et al. (2018). A good practice guide for translating and adapting hearing-related questionnaires for different languages and cultures. International Journal of Audiology, 57(3), 161–175. doi:10.1080/14992027.2017.1393565
- Hétu, R., Riverin, L., Lalande, N., Getty, L., & St-cyr, C. (1988). Qualitative analysis of the handicap associated with occupational hearing loss. British Journal of Audiology, 22(4), 251–264. doi:10.3109/03005368809076462
- Holman, J. A., Drummond, A., & Naylor, G. (2021). Hearing aids reduce daily-life fatigue and increase social activity: A longitudinal study. Trends in Hearing, 25, 233121652110527. doi:10.1177/23312165211052786
- Holman, J. A., Hornsby, B. W. Y., Bess, F. H., & Naylor, G. (2021). Can listening-related fatigue influence well-being? Examining associations between hearing loss, fatigue, activity levels and well-being. International Journal of Audiology, 60(sup2), 47–59. doi:10.1080/14992027.2020.1853261
- Hornsby, B. W. Y., Camarata, S., Cho, S.-J., Davis, H., McGarrigle, R., & Bess, F. H. (2021). Development and validation of the Vanderbilt Fatigue Scale for Adults (VFS-A). Psychological Assessment, 33(8), 777–788. doi:10.1037/pas0001021
- Hornsby, B. W. Y., Camarata, S., Cho, S.-J., Davis, H., McGarrigle, R., & Bess, F. H. (2022). Development and evaluation of pediatric versions of the Vanderbilt Fatigue Scale for children with hearing loss. Journal of Speech, Language, and Hearing Research, 65(6), 2343–2363. doi:10.1044/2022_JSLHR-22-00051
- Hornsby, B. W. Y., Davis, H., & Bess, F. H. (2021). The impact and management of listening-related fatigue in children with hearing loss. Otolaryngologic Clinics of North America, 54(6), 1231–1239. doi:10.1016/j.otc.2021.07.001
- Hornsby, B. W. Y., Gustafson, S. J., Lancaster, H., Cho, S.-J., Camarata, S., & Bess, F. H. (2017). Subjective fatigue in children with hearing loss assessed using self- and parent-proxy report. American Journal of Audiology, 26(3S), 393–407. doi:10.1044/2017_AJA-17-0007
- Hornsby, B. W. Y., & Kipp, A. M. (2016). Subjective ratings of fatigue and vigor in adults with hearing loss are driven by perceived hearing difficulties not degree of hearing loss. Ear & Hearing, 37(1), e1–e10. doi:10.1097/AUD.0000000000000203
- Hornsby, B. W. Y., Naylor, G., & Bess, F. H. (2016). A Taxonomy of fatigue concepts and their relation to hearing loss. Ear & Hearing, 37(1), 136S–144S. doi:10.1097/AUD.0000000000000289
- Hu, L., & Bentler, P. M. (1999). Cutoff criteria for fit indexes in covariance structure analysis: Conventional criteria versus new alternatives. Structural Equation Modeling: A Multidisciplinary Journal, 6(1), 1–55. doi:10.1080/10705519909540118
- Jagadish, A., Natarajan, M., & Solomon, J. M. (2021). Cross-cultural adaptation and validation of the Kannada version fatigue severity scale among Kannada-speaking individuals with neurological disorders: A cross-sectional study done in South India. Disability, CBR & Inclusive Development, 32(2), 51. doi:10.47985/dcidj.450
- Keenan, A. P., & Stevens, J. P. (2015). Applied multivariate statistics for the social sciences: Analyses with SAS and IBM’s SPSS (6th ed.). Routledge. [Online]. doi:10.4324/9781315814919
- Kramer, S. E., Kapteyn, T. S., & Houtgast, T. (2006). Occupational performance: Comparing normally-hearing and hearing-impaired employees using the Amsterdam Checklist for hearing and work. International Journal of Audiology, 45(9), 503–512.
- Krupp, L. B. (1989). The fatigue severity scale. Archives of Neurology, 46(10), 1121. doi:10.1001/archneur.1989.00520460115022
- Manchaiah, V., Vinay, & Thammaiah, S. (2021). Psychometric properties of the Kannada version of the international outcome inventory for hearing aids (IOI-HA). International Journal of Audiology, 60(12), 1039–1045. doi:10.1080/14992027.2021.1884910
- McGarrigle, R., & Mattys, S. (2023). Sensory-processing sensitivity predicts fatigue from listening, but not perceived effort, in young and older adults. Journal of Speech, Language, and Hearing Research, 66(2), 444–460. doi:10.1044/2022_JSLHR-22-00374
- Mcnair, D. M., Lorr, M., & Droppleman, L. F. (1971). Manual for the profile of mood states. San Diego, CA: Educational and Industrial Testing Services.
- Nachtegaal, J., Kuik, D. J., Anema, J. R., Goverts, S. T., Festen, J. M., & Kramer, S. E. (2009). Hearing status, need for recovery after work, and psychosocial work characteristics: Results from an internet-based national survey on hearing. International Journal of Audiology, 48(10), 684–691. doi:10.1080/14992020902962421
- Patrick, D. L., & Deyo, R. A. (1989). Generic and disease-specific measures in assessing health status and quality of life. Medical Care, 27(Supplement), S217–S232. doi:10.1097/00005650-198903001-00018
- Pichora-Fuller, M. K., Kramer, S. E., Eckert, M. A., Edwards, B., Hornsby, B. W. Y., Humes, L. E., … Wingfield, A. (2016). Hearing impairment and cognitive energy: The Framework for Understanding Effortful Listening (FUEL). Ear & Hearing, 37(1), 5S–27S. doi:10.1097/AUD.0000000000000312
- Steiger, J. H., & Lind, J. (1980). Statistically-based tests for the number of common factors. Paper Presented at the Psychometric Society Annual Meeting.
- Stein, K. D., Jacobsen, P. B., Blanchard, C. M., & Thors, C. (2004). Further validation of the multidimensional fatigue symptom inventory-short form. Journal of Pain and Symptom Management, 27(1), 14–23. doi:10.1016/j.jpainsymman.2003.06.003
- Strasser, F., Müller-Käser, I., & Dietrich, D. (2009). Evaluating cognitive, emotional, and physical fatigue domains in daily practice by single-item questions in patients with advanced cancer: A cross-sectional pragmatic study. Journal of Pain and Symptom Management, 38(4), 505–514. doi:10.1016/j.jpainsymman.2008.12.009
- The Jamovi Project, jamovi (Version 2.5) (2024). The jamovi project. [Online]. Available: https://www.jamovi.org.
- Tucker, L. R., & Lewis, C. (1973). A reliability coefficient for maximum likelihood factor analysis. Psychometrika, 38(1), 1–10. doi:10.1007/BF02291170
- Vinay, V. M., & Thammaiah, S. (2021). Psychometric properties of the Kannada version of the International Outcome Inventory for Hearing Aids (IOI-HA). International Journal of Audiology, 60(12), 1039–1045. doi:10.1080/14992027.2021.1884910
- World Health Organisation. (2024). https://www.who.int/news-room/fact-sheets/detail/deafness-and-hearing-loss.