
Abstract
A novel nanocomposite based on nano-SiO2 (Nanosilica) grafted by sulfonic acid was prepared and characterized using atomic force microscopy technique. Cyclic voltammetry chronoamperometry, electrochemical impedance spectroscopy, and differential pulse voltammetry were used to investigate the electrochemical behavior of mitoxantrone at the sulfonic acid-functionalized nano-SiO2, which was modified through glassy carbon electrode (GCE). The Nanosilica–SO3H–GCE showed better performance for the electrochemical oxidation of mitoxantrone, when compared with bare GCE. The experimental conditions influencing the determination of mitoxantrone were optimized and under optimal conditions, the oxidation peak current was proportional to mitoxantrone concentration in the range of 0.5–173 μM, while the detection limit was 36.8 μM (S/N = 3). The proposed method was successfully applied to determine mitoxantrone in spiked human serum, yielding satisfactory results. The spiked recoveries were in the range of 101–106%.
Introduction
Mitoxantrone is a quinoline based synthetic anticancer drug that has been used in different tumors including circulating and solid tumors.Citation1,2 Methotrexate is a potent folic acid antagonist, which inhibits the reduction from folic acid to tetrahydrofolic acid, thereby leading to the suppression of the nucleic acid biosynthetic pathway and cell death.Citation3 The efficacy of methotrexate in the treatment of various human neoplastic disorders has been demonstrated during the last decades.Citation4,5 However, the clinical use of methotrexate is limited by some severe toxic side effects such as chronic cardiomyopathy, marrow suppression, gastrointestinal lesions, renal insufficiency, hepatic failure, hypoalbuminemia, and pancytopenia.Citation6,7 Therefore, establishment of highly sensitive analytical techniques for the determination of doxorubicin and methotrexate is of great significance in clinics and pharmaceutics.
Determination of mitoxantrone in pharmaceutical and biological samples is very important for pharmaceutical analysis.Citation8–18 Various analytical methods were used for the determination of mitoxantrone, including spectroscopic,Citation8–10 chromatographic,Citation11–13 and electrochemical methods.Citation16–18 Such techniques for the measurement of drug concentrations are necessary in a clinical chemistry to ensure that adequate drug levels are maintained thereby avoiding toxic concentrations of such drugs. The problems encountered using such methods are either the need for derivatization or the need for time-consuming extraction procedures. Since these techniques have expensive instrumentation and running costs, the use of simpler, faster, cheaper, and sensitive methods can be interesting.
Electrochemical methods/sensors because of their short analysis time, low power consumption, and inexpensive equipment, reproducibility, high stability, wide linear dynamic range, low detection limit, high sensitivity and selectivity have received more attention in recent decades. In this context, sensors are being developed to be cost-effective portable devices with higher sensitivity, easier usage ,and capable of providing multiplexed and continuous monitoring. Development of simple, sensitive, and accurate sensors for detecting anticancer drugs is an important issue since sensors play a key role in pharmaceutical analysis, and this has a great impact on public health. To achieve these goals, it will be necessary to improve sensor–transducer technology to detect pharmaceuticals directly. Further advancements should be made in order to find possibilities to transduce the molecular recognition events into electrical or optical signals. In this context, sensors based on nanomaterials are good examples of how nanotechnology and pharmaceutical analysis can be combined. Nanomaterial-based sensors offer excellent prospects to accomplish ultrasensitive detection and to provide individual and simultaneous detection of multiple pharmaceuticals. On the one hand, nanomaterials afford an enormous signal enhancement due to their large surface to volume ratio, which increases the amount of molecules accumulation onto the surface of sensor. Also, nanomaterials possess encoding capabilities, as it is possible to tailor their physical properties, varying their size, shape and composition.
Another trend in nano-based sensors should be the development of novel nanomaterials to perform analyte measurements. In this regard, silica nanoparticles have proved to be very valuable. One of the best candidates for this purpose is nanosilica and its derivatives.Citation18–25 Nano-SiO2 particles (SiNPs) based substances not only have high surface area (200–1500 m2/g) but also have 3D Construction with highly open spaces organized to each other. These features make it a best candidate for designing electrochemical sensors with high sensitivity and selectivity (with increasing diffusion rate of analytes to plenty of reachable binding sites of SiNPs). Alternatively, wide range of organic and inorganic species can modify the surface of SiNPs. Nowadays, SiNPs because of its easy fabrication and modification process at room temperature, thin film synthesis on electrodes and bioimmobilization ability have great interests for use in electrochemical sensing.Citation26 The large surface area of nano-SiO2 is provided by the three-dimensional structure of the deposited films and greatly increases Faradic currents. Therefore, in the present work, we used nano-SiO2–SO3H as modifier material and studied the electrochemical oxidation of mitoxantrone in Nano–SiO2–SO3H modified glassy carbon electrode and developed a new electroanalytical procedure for quantification of mitoxantrone in spiked human serum samples. To the best of our knowledge, this is the first report of the determination of mitoxantrone based on their direct electrochemical oxidation on Nano–SiO2–SO3H.
Experimental details
Chemicals and reagents
Mitoxantrone was purchased from EBEWE Pharma (Ebexantron®, Austria). A 4.5 m mol/Lit stock solution of mitoxantrone was prepared with double-distilled water and stored in the dark and at a temperature of 4 °C. All solutions were prepared with double-distilled water. Other chemicals were of analytical grade from Merck and sigma chemical companies and used without further purification steps. Voltammetric experiments on mitoxantrone was carried out in 0.05 M tris (hydroxymethyl) aminomethane–HCl (pH 7.4).
Human serum samples were obtained from the Iranian Blood Transfusion Research Center (Tabriz, Iran), and aliquots were transferred into microtubes and frozen at −4 °C until analysis. Serum samples that were frozen at −4 °C were thawed at room temperature on the day of analyzing and were vortexed to ensure homogeneity. After gently thawing the samples, 2.0 mL of an aliquot volume of serum sample was spiked with Max, and acetonitrile was added to precipitate serum proteins. The mixture was then vortexed for 25 s and centrifuged for 10 min at 6000 rpm to eliminate serum protein residues. Approximately 2.0 mL mixture from the supernatant was taken and added into supporting electrolytes to attain a total volume of 10.0 mL. Sufficient volume (25, 50, 100, 200 mL, etc.) from this solution was taken and added to the voltammetric cell containing 10.0 mL of supporting electrolyte.
Apparatuses and methods
Electrochemical measurements were carried out in a conventional three-electrode cell containing 0.1 M 0.05 M Tris–HCl (pH 7.4) (which was employed as the running electrolyte throughout the work) powered by a Potentiostat/ Galvanostat, an Autolab, and PGSTAT 302 N (Eco Chemie, Netherlands). Ag/AgCl and Pt wire were used as the reference and counter electrodes, respectively. The system was run by a PC through NOVA 1.7 software. The working electrode was a glassy carbon (GC) electrode (from Azar Electrode Co., Urumia, Iran) and Nanosilica–SO3H–GCE. The atomic force microscopy images of Nanosilica–SO3 were acquired using contact mode with JPK Instruments AG, Berlin, Germany. IR spectra were recorded on a Shimadzu model FTIR prestige 21 spectrophotometer (Tokyo, Japan) using KBr discs. Additional dilute solutions were prepared daily by accurate dilution just before use. The transmission electron microscope images were obtained at JEOL-1200 EX TEM (Japan).
Synthesis of the Nanosilica–SO3
Pure nanosilica was prepared with hydrolysis and condensation of tetraethylorthosilicate (TEOS) as precursor material. The procedure is prepared from TEOS in the presence of polyethyleneglycol 5% (PEG) and hydrochloric acid (HCl) 0.001 N. Five grams of TEOS were dissolved in 80 g PEG (solution 1). Solid silicagel was produced by dropwise addition (~ 1 ml/10 min) of 30 ml HCl 0.001 N to solution 1 with stirring (250 rpm) at room temperature until a cloudy solution was formed. Then it was homogenized by homogenizer device model Art-micra D-8 n 11037 (6000 rpm) for about 30 min. The obtained solution was stirred (250 rpm) for 4 days. After this period, pH was measured (~7.8). Finally, 10 ml HCl 0.1 N was added at once to pH about 2. The solution was heated to 80 °C to form a viscous gel. The prepared samples were subjected to heat treatment temperature for 3 h ranging from 200 to 1000 °C. To nanosilica (1 g), chlorosulfonic acid (1 g, 9 mmol) in 5 mL dichloromethane was added dropwise at room temperature within 30 min. After completion of the addition, the mixture was mechanically stirred for another 30 min until HCl was removed from reaction vessel. The mixture was then filtered and washed with CH2Cl2 to give Nanosilica–SO3H. The amount of sulfonic acid groups in Nanosilica–SO3H was determined by acid–base titration and found to be 0.6 g SO3H.
Characterization of synthesized nanosilica–SO3H
TEM showed that the nanosilica–SO3H was present as uniform particles and the size of nanosilica–SO3H was about 20–100 nm (Figure a). The prepared nanocomposite was characterized by FTIR. In FTIR spectra the band at about 1100 cm−1 belongs to (Si–O) stretching vibrations (Figure b). The peaks at 1047 and 1220 cm−1 are related to the stretching of the S O bonds. A peak appeared at about 3400 cm−1 due to the stretching of OH groups in the SO3H (Figure b).
Figure 1 TEM image (a) and FT-IR (b) of Nanosilica -SO3H
Preparation of the Nanosilica-SO3H-GCE
Prior to the modification, the GCE was polished with 1, 0.3, and 0.05 μm alumina slurry and rinsed thoroughly with double-distilled water between each polishing step. Then, it was washed successively with 1:1 nitric acid, acetone, and double-distilled water in an ultrasonic bath and dried in air. About 50 mg nanosilica–SO3H was poured in 2 cc ethanol. After 5 min sonication of nanosilica–SO3H suspension, finally 15 μl of this suspension was dripped on a per cleaned glassy carbon electrode, evaporated, and after 2 h incubation in dark, ambient temperature, the Nanosilica–SO3H–GC electrode is ready for use as a modified electrode. Surface morphology of the nanosilica–SO3H film is shown in Figure . The AFM image shows that the GC surface was covered with the nanosilica–SO3H.
Figure 2 AFM images of the GC electrode surface (a) before and (b), (c) after modification with the Nanosilica–SO3H film
Results and discussion
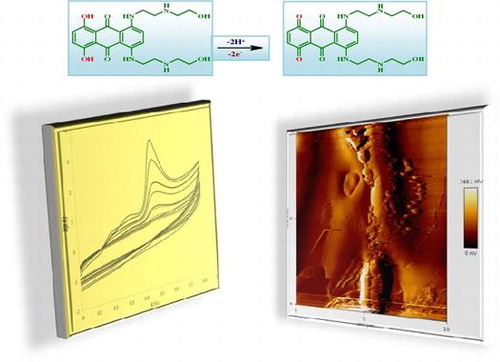
Typical cyclic voltammograms (CVs) mitoxantrone on of bare GCE, and nanosilica–SO3H /GCE in 0.05 M Tris–HCl are shown as Figure where potential sweep rate of 100 mVs−1 has been employed. In the presence of Max, one oxidation peak appears at the bare GCE and nanosilica–SO3H modified GCE. Comparison of recorded CVs in the presence of mitoxantrone using GCE and Nanosilica–SO3H modified GCE shows that the anodic peak current at the surface of Nanosilica–SO3H/GCE is significantly enhanced. These results indicate that prepared film could accelerate the rate of electron transfer of mitoxantrone and have good electrocatalytic activity for redox reaction of mitoxantrone.
Figure 3 Cyclic voltammograms of 45 mM of mitoxantrone at bare GC electrode and Nanosilica–SO3H-GCE in 0.05 M Tris–HCl (pH 7.4) buffer at scan rate of 100 mVs−1
Also, it showed that no reduction peak was observed in the reverse scan, suggesting that the electrochemical reaction was a totally irreversible process. As can be seen, the anodic peak potential for the oxidation of mitoxantrone at nanosilica–SO3H /GCE is about 0.58 V. The oxidation peak current value (Ip) of mitoxantrone was 14.1 μA. The data obtained clearly show that the combination of nanosilica–SO3H definitely improves the characteristics of mitoxantrone oxidation. That might be related to the excellent property of nanosilica–SO3H, such as high specific surface area and electrical conductivity. The role of SO3H was also important for promoting the electrochemical oxidation of mitoxantrone. Therefore, nanosilica–SO3H could be substituted for the oxidation of mitoxantrone.
Effect of scan rate
Useful information involving electrochemical mechanism usually can be acquired from the relationship between peak current and scan rate. Therefore, the electrochemical behaviors of mitoxantrone at different scan rates were investigated on the surface of nanosilica–SO3H /GCE by CV. A linear relationship was obtained between the peak current and the scan rate in the range of 5–1000 mVs−1, which revealed that the oxidation of mitoxantrone was absorption-controlled step (Figure ).
Figure 4 (a) CVs of Nanosilica–SO3H /GCE in the presence of 0.45 mM mitoxantrone + 0.05 M Tris–HCl (pH 7.4) in different scan rates (from inner to outer): 2, 5, 10, 20, 30, 40, 50, 60, 70, 90, 100, 150, 200, 250, 300, 350, 400, 450, 50, 600, 700, 800, 900, and 1000 mV s−1, respectively. (b) Peak currents vs. sweep rate (c) Peak potential vs. Neperian logarithm of sweep rate
Figure 5 CVs of Nanosilica–SO3H /GCE in different concentrations of mitoxantrone solutions (50, 56.2, 75, 90, 125,180, 225, 340, and 450 μM) Supporting electrolyte: 0.05 M Tris–HCl (pH 7.4); scan rate: 100 mV s−1
Figure 6 Nyquist of Nanosilica–SO3H/GCE in different concentrations of mitoxantrone solutions (44.5 μM, 0.17, 0.21, 0.25, 0.29, and 0.33 mM)
Figure 7 (a) DPVs of Nanosilica–SO3H/GCE in different concentrations of mitoxantrone solutions (0.56, 0.64, 44.6, 66.5, 88.2, 131.0, and 173.0 μM). (b) The calibration curve of modified electrode at the optimized conditions
The peak potential shifted to positive values with the increasing scan rates. The linear relation between peak potential and logarithm of scan rate can be expressed as Ep = 0.0312ln v + 0.5623 (R2 = 0.9842). As for an irreversible electrode process, according to Laviron,Citation27 Ep is defined by the following equation:(1)
where Ep is the peak potential (V vs. Ag/AgCl), E0 is the formal potential (V vs. Ag/AgCl), R is the universal gas constant (8.314 J K−1 mol−1), T is the temperature (K), α is the charge transfer coefficient for the oxidation step, n is the number of electrons involved in the rate-determining step, F is the Faraday constant (96485 C mol−1). According to Bard and Faulkner,Citation28 for a totally irreversible wave, Ep is a function of scan rate, shifting (for an oxidation) in a positive direction by an amount 1.15RT/αF (or 30/α mV at 25 °C) for each ten fold increase in v. So, from this we got the value of α to be 0.563. The number of electron (n) transferred in the electrooxidation of mitoxantrone was calculated to be 0.955 (approximately equal to 1).
The electrocatalytic effect of Nanosilica–SO3H /GCE can be ascribed to the combination of the electron-acceptor ability of SO3H and confinement effects due to the attachment to the nanosilica matrix. On the basis of the previous considerations, the electrocatalytic effect of nanosilica–SO3H must result from the superposition of the effect associated with more external SO3H units and that due to boundary-associated ones. On the other hand, since the catalytic effect associated with nanosilica–SO3H consists essentially of an enhancement of the anodic peak for mitoxantrone oxidation, the catalytic effect can tentatively be associated with a redox reaction in solution phase between SO3H units and any intermediate species resulting from the initial electron transfer of mitoxantrone (Scheme ).
Scheme 1 Proposed oxidation mechanism of mitoxantrone
Figure shows that upon increasing mitoxantrone concentration irreversible oxidation develops in the region of the electrochemical formation of oxidation product. Any increase in the concentration of mitoxantrone causes a proportional and nearly linear enhancement of the anodic wave. It is worthwhile to emphasize that the anodic formation of oxidation product is an irreversible process.
Electrochemical impedance spectroscopy (EIS) is a powerful, non-destructive, and amenable technique to examine the microscopic interfacial events (such as complexation and precipitation) or diffusion effect at the modified electrodes near or far from the equilibrium potentials. It also serves as a transducer.Citation29 EIS as well as other electrochemical methods may be used for the investigation of electrode processes at modified electrodes. The EIS obtained for a series of mitoxantrone solutions with various concentrations as illustrated in Figure . Similar results were obtained by EIS. As can be seen, an increase in the concentration of mitoxantrone was accompanied by a decrease in the radius of semi-circle.
In this condition, Rct is the only element that has a simple physical meaning describing how fast the rate of charge transfer occurs during the electrocatalytic oxidation of mitoxantrone. It is evident from the EIS data (Table ) that, in the presence of mitoxantrone at a surface of the modified electrode, the resistance to electron transfer was at its minimum value (see Figure ). Therefore, there must be an interaction between mitoxantrone and the surface of electrode in the oxidation potential which was confirmed obtained results by CV. The catalytic reaction of mitoxantrone oxidation that occurred via the absorption of drug on surface of nano–SiO2–SO3H caused an increase in the surface concentration of mitoxantrone on electrode surface. Thus, the charge-transfer resistance declined depending on the concentration of mitoxantrone in the solution.
Table 1 Equivalent circle parameters of modified and bare electrode in the absence and presence of Max
Analytical approach
In order to develop a voltammetric method for determining of mitoxantrone, we selected the DPV mode, because the peaks are sharper and better defined at lower concentration of mitoxantrone than those obtained by CV, with a lower background current, resulting in improved resolution. According to the obtained results, it was possible to apply this technique to the quantitative analysis of mitoxantrone. The Tris–HCl of pH 7.40 was selected as the supporting electrolyte for the quantification of mitoxantrone as it gave maximum peak current at pH 7.40. The peak at about 0.5 V was considered for the analysis DPVs obtained with increasing amounts of mitoxantrone showed that the peak current increased linearly with increasing concentration, as shown in Figure .
Using the optimum conditions described above, linear calibration curves were obtained for mitoxantrone in the range of 0.5–173 μM. The linear equation was Ip(A) = 0.0065 C (μM)+1.1839 (R2 = 0.9806). The detection limit was estimated to be 36 μM (S/N = 3).
It can be seen that the nanosilica–SO3H/GCE offered reasonable linear range for mitoxantrone detection and the detection limit was lower than some of previous reports. These results indicated that nanosilica–SO3H/GCE is an appropriate platform for the determination of mitoxantrone. On the other hand, the prepared electrode shows voltammetric responses with low detection limit and wide linear range for mitoxantrone in optimal conditions, which makes it suitable for determination of this drug. It is found that, by incorporating SO3H in nanosilica, a novel strategy for developing an efficient and robust electrochemical sensing platform was established. The electrochemical sensor showed high sensitivity and simplicity for detection of mitoxantrone.
The good sensitivity of the proposed method allows the determination of mitoxantrone in spiked human serum samples (Table ). The recovery of the analytes was measured by spiked drug into diluted serum samples. The DPVs were recorded after the serum was spiked with various amounts of the mitoxantrone within the working concentration range. Recoveries were found to lie in range of 101.5–105.8%. Good recoveries of mitoxantrone were achieved from this method, meaning that application of proposed sensor to the analysis of mitoxantrone in biological fluids could be easily assessed.
Table 2 Determination of mitoxantrone in human serum by Nanosilica–SO3H/GCE
Conclusion
The nanosilica–SO3H film was formed on a glassy carbon electrode and checked for electrooxidation of mitoxantrone at physiological pH (7.40). It is concluded that the electrooxidation of mitoxantrone that starts around 0.48 V vs. Ag/AgCl occurs through a mediated electron transfer mechanism catalyzed by nanosilica–SO3H species which form in on the surface of GCE. The results show that the nanosilica–SO3H–GCE exhibit high electrocatalytic activity towards mitoxantrone oxidation at around 0.58 V. Therefore, nanosilica–SO3H can promote mitoxantrone electron-transfer, thus nanosilica–SO3H/GCE provides higher electroactive surface area and lower charger transfer resistance compared with bare GCE. Using CV and EIS, the kinetic parameters, such as charge transfer coefficient (α), number of electron (n) transferred, polarization resistant (Rp), and the charge transfer resistant (Rct) for electrooxidation of mitoxantrone were determined. This proposed method could be applied to the determination of mitoxantrone in medicines. It is expected that this work opens new horizons in the design of new modifier for the electrooxidation studies.
Funding
This work was partially supported by the Drug Applied Research Center Research Center, Tabriz University of Medical Sciences and Nano Technology Research Center, and Faculty of Chemistry, Urmia University.
Disclosure statement
No potential conflict of interest was reported by the authors.
Acknowledgments
We gratefully acknowledge the partial financial support by the Drug Applied Research Center Research Center, Tabriz University of Medical Sciences and Nano Technology Research Center, and Faculty of Chemistry, Urmia University.
References
- Y. Mao, J. Hu, Q. Li and P. Xueb: ‘Study of the electrochemical behavior of mitoxantrone and its determination at a Co-C modified ultramicroelectrode’, Analyst, 2000, 125, 2299–2302.10.1039/b006865i
- I. E. Smith: ‘Mitoxantrone (novantrone): a review of experimental and early clinical studies’, Cancer Treat. Rev., 1983, 10, 103–115.10.1016/0305-7372(83)90008-7
- M. Chow and H. Rubin: ‘Selective killing of preneoplastic and neoplastic cells by methotrexate with leucovorin’, Proc. Natl. Acad. Sci. USA, 1998, 95, 4550–4555.10.1073/pnas.95.8.4550
- M. Levitt, M. B. Mosher, R. C. DeConti, L. R. Farber, R. T. Skeel, J. C. Marsh, M. S. Mitchell, R. J. Papac, E. D. Thomas and J. R. Bertino: ‘Improved therapeutic index of methotrexate with “leucovorin rescue”’, Cancer Res., 1973, 33, 1729–1734.
- E. Frei, N. Jaffe and M. H. N. Tattersall: ‘New approaches to cancer chemotherapy with methotrexate’, J. Med., 1975, 292, 846–851.
- A. U. Buzdar, C. Marcus, T. L. Smith and G. R. Blumenschein: ‘Blumenschein, early and delayed clinical cardiotoxicity of doxorubicin’, Cancer, 1985, 55, 2761–2765.10.1002/(ISSN)1097-0142
- H. N. Alkaya, A. M. Gharaibeh, S. Sheykh and M. A. Salem: ‘High-performance liquid chromatographic determination of methotrexate in plasma’, Ther. Drug Monit., 1990, 12, 191–194.10.1097/00007691-199003000-00014
- S. Han and H. Wang: ‘On-line chemiluminescence determination of mitoxantrone by capillary electrophoresis’, J. Chromatograph B, 2010, 878, 2901–2904.10.1016/j.jchromb.2010.08.006
- S. Liu, F. Wang, Z. Liu, X. Hu, A. Yi and H. Duan: ‘Resonance rayleigh scattering spectra for studying the interaction of anthracycline antineoplastic antibiotics with some anionic surfactants and their analytical applications’, Anal. Chim. Acta, 2007, 601, 101–107.10.1016/j.aca.2007.08.043
- F. Yu, L. Chen and F. Chen: ‘Chemiluminescence method for the determination of mitoxantrone by the enhancement of the tris-(4,7-diphenyl-1,10-phenanthrolinedisulfonic acid)ruthenium(II)-cerium(IV) system’, Microchimica Acta, 2008, 161, 185–190.10.1007/s00604-007-0936-3
- J. L. Johnson, A. Ahmad, S. Khan, Y. F. Wang, A. W. Abu-Qare and J. E. Ayoub: ‘Improved liquid chromatographic method for mitoxantrone quantification in mouse plasma and tissues to study the pharmacokinetics of a liposome entrapped mitoxantrone formulation’, J. Chromatogr. B, 2004, 799, 149–155.10.1016/j.jchromb.2003.10.034
- P. Zhang, G. Ling, J. Sun, Y. Sun, X. Pu, Z. Wang and Z. He: ‘Determination of mitoxantrone in rat plasma by liquid chromatography-tandem mass spectrometry method: application to a pharmacokinetic study’, J. Chromatogr. B, 2010, 878, 2260–2265.10.1016/j.jchromb.2010.06.016
- A. M. O. Brett: ‘Voltammetric behaviour of mitoxantrone at a DNA-biosensor’, Biosens. Bioelectron., 1998, 13, 861–867.10.1016/S0956-5663(98)00053-0
- M. Enache, I. Anghelache and E. Volanschi: ‘Coupled spectral and electrochemical evaluation of the anticancer drug mitoxantrone-sodium dodecyl sulfate interaction’, Int. J. Pharmaceutics, 2010, 390, 100–106.10.1016/j.ijpharm.2009.12.064
- A. M. Oliveira Brett, T. R. A. Macedo, D. Raimundo, M. H. Marques and S. H. P. Serrano: ‘Electrochemical oxidation of mitoxantrone at a glassy carbon electrode’, Anal. Chim.Acta, 1999, 385, 401–408.10.1016/S0003-2670(98)00807-1
- S. Rauf, J. J. Gooding, K. Akhtar, M. A. Ghauri, M. Rahman, M. A. Anwar and A. M. Khalid: ‘Electrochemical approach of anticancer drugs-DNA interaction’, J. Pharm. Biomed. Anal., 2005, 37, 205–217.10.1016/j.jpba.2004.10.037
- S. Wang, T. Peng and C. F. Yang: ‘Electrochemical determination of interaction parameters for DNA and mitoxantrone in an irreversible redox process’, Biophys. Chem., 2003, 104, 239–248.10.1016/S0301-4622(02)00371-X
- F. U. Hernandez, S. P. Morgan, B. R. Hayes-Gill, D. Harvey, W. Kinnear, A. Norris, D. Evans, J. G. Hardman and S. Korposh: ‘Characterisation and use of a fibre optic sensor based on PAH/SiO2 film for humidity sensing in ventilator care equipment’, IEEE Trans Biomed Eng., 2016, doi: 10.1109/TBME.2016.2521662.
- M. R. Ganjali, N. Motakef-Kazami, F. Faridbod, S. Khoee and P. Norouzi: ‘Determination of Pb2+ ions by a modified carbon paste electrode based on multi-walled carbon nanotubes (MWCNTs) and nanosilica’, J. Hazard. Mater., 2010, 173, 415–419.10.1016/j.jhazmat.2009.08.101
- C. C. Silva, A. S. B. Sombra and M. P. F. Graça: ‘SiO2–Fe2O3–MoO3 ceramic system doped with Nb2O5, a study of the dielectric temperature dependence’, J. Mater. Sc. Mater. Electron., 2016, 27, 5764–5769.10.1007/s10854-016-4490-9
- M. A. Mahjoub, G. Monier, C. Robert-Goumet, F. Réveret, M. Echabaane, D. Chaudanson, M. Petit, L. Bideux and B. Gruzza: ‘Synthesis and study of stable and size-controlled ZnO–SiO2 quantum dots: application as a humidity sensor’, J. Phys. Chem. C, 2016, 120, 11652–11662.10.1021/acs.jpcc.6b00135
- D. Gomez, S. P. Morgan, B. R. Hayes Gill and S. Korposh: ‘Polymeric fibre optic sensor based on a SiO2 nanoparticle film for humidity sensing on wounds’, Proc. SPIE 9916, 2016, doi: 10.1117/12.2236845.
- H. Duan, L. Li, X. Wang, Y. Wang, J. Li and C. Luo: ‘Biorecognition and highly sensitive determination of Ribonuclease A with chemiluminescence sensor based on Fe3O4/multi-walled carbon nanotubes/SiO2-surface molecular imprinting polymer’, RSC Adv., 2015, 5, 18850–18857.10.1039/C4RA16878J
- J. B. Maurya, Y. K. Prajapati, V. Singh and J. P. Saini: ‘Sensitivity enhancement of surface plasmon resonance sensor based on graphene-MoS2 hybrid structure with TiO2-SiO2 composite layer’, Appl. Phys. A., 2015, 121, 525–533.10.1007/s00339-015-9442-3
- H. Liu, Y. Miao, B. Liu, W. Lin, H. Zhang, B. Song, M. Huang and L. Lin: ‘Modified clad optical fibre coated with PVA/TiO2 nano composite for humidity sensing application’, IEEE Sens. J., 2015, 15, 3424–3428.
- A. Walcarius: ‘Electroanalysis with pure, chemically modified and sol-gel-derived silica-based materials’, Electroanalysis, 2001, 13, 701–718.10.1002/(ISSN)1521-4109
- E. Laviron: ‘General expression of the linear potential sweep voltammogram in the case of diffusionless electrochemical systems’, J. Electroanal. Chem., 1979, 101, 19–28.10.1016/S0022-0728(79)80075-3
- A. J. Bard and L. R. Faulkner: ‘Electrochemical methods’, Chap. 1, 2001, New York, NY, Wiley.
- M. Arshadi, M. Ghiaci, A. A. Ensafi, H. Karimi-Maleh and S. L. Suib: ‘Oxidation of ethylbenzene using some recyclable cobalt nanocatalysts: the role of linker and electrochemical study’, J. Mol. Catal. A, 2011, 338, 71–83.