
 ?Mathematical formulae have been encoded as MathML and are displayed in this HTML version using MathJax in order to improve their display. Uncheck the box to turn MathJax off. This feature requires Javascript. Click on a formula to zoom.
Abstract
To broaden the knowledge regarding regenerative medicine in natural rubber latex (NRL) nanoparticles, we have examined the chondrogenesis of human mesenchymal stem cells (hMSCs) with NRL nanoparticles under hypoxia condition. We have successfully fabricated the cartilage/NRL biocomposites via hMSCs spheroid under hypoxic condition, where the administration of NRL nanoparticles exhibits the suppression of the spheroid contraction due to the cellular proliferation of hMSCs. It has been found that the NRL nanoparticles acted as a main component, which provides surface heterogeneity of the spheroid, leading to the mechanically stable structure with higher modulus in comparison with the control as revealed by atomic force microscopy microindentation. Under hypoxia condition, the effective gene expression of in vitro chondrogenesis of hMSCs with administration of NRL was confirmed as revealed by the chondrogenic gene expression analysis compared with that under normoxia condition.
Graphical Abstract
1. Introduction
Natural rubber (NR) obtained by coagulation of NR latex (NRL) is a type of high-molecular-weight polymeric material. Currently, more than 90% of NRL comes from one single tropical tree species – Hevea brasiliensis (para rubber tree) [Citation1]. NR and NRL are mainly used in traditional industrial products, such as gloves, condoms, balloons, medical equipment, and tires. But currently, NRL’s target application is continuously expanding into tissue engineering. Some promising results on the use of NRL from H. brasiliensis to produce replacement and regeneration tissues have recently been reported [Citation2–6]. In particular, wound healing in cutaneous tissues, eardrum replacement, bone regeneration, and dental alveolus replacement afford a unique method to repair or replace the failing organs or tissues [Citation3,Citation5,Citation6]. The primary particle diameter of NRL is in the range of 100–300 nm [Citation7], which are promising nanoparticles for use in biotechnology including pharmaceutics, tissue engineering, and regenerative medicine.
Due to the difficulty in self-healing of cartilage injuries, chondrogenesis has been a very challenging topic in tissue engineering and regenerative medicine [Citation8,Citation9]. Previous studies have reported that damage of hyaline cartilage caused by trauma is repaired with fibrocartilage, which is inferior in mechanical functions as compared to that of hyaline cartilage [Citation10]. It was reported that maximum pressure loaded on human articular hyaline cartilages in vivo is estimated to about 18 MPa when human stands up from a chair [Citation11]. The data suggest that the regenerative tissue for articular hyaline cartilages seems necessary to provide the mechanical function for withstanding the high pressure.
Human mesenchymal stem cells (hMSCs) have shown to have the potential to differentiate into several cell types including chondrocytes with high-proliferation capacity [Citation12]. However, to date, the successive effects of providing the differentiation of hMSCs into chondrocytes and mechanically stable structure into cartilage tissue have not been reported.
To broaden the knowledge of application in tissue engineering and regenerative medicine of NRL nanoparticles, this novel study has examined the chondrogenesis ability of NRL nanoparticles against hMSCs under normoxic condition [Citation12]. The effective gene expression of in vitro chondrogenesis of hMSCs with administration of NRL was confirmed as revealed by the chondrogenic gene expression analysis. In our previous study [Citation12], we have successfully, for the first time, fabricated the cartilage/NRL biocomposites via hMSC spheroid formation under normoxia condition.
In this study, we fabricated the cartilage/NRL biocomposites under hypoxic condition and demonstrated that the NRL nanoparticles are to be a potential loading component for cartilage tissue repair. In particular, the effect of administration of NRL on mechanical properties was investigated.
2. Experimental section
2.1. NRL
The NRL solution sample (solid content of 35.3 wt%) was provided by Sumitomo Riko Co. Ltd., Japan and was not further purified for use. It was stabilized (pH 11.3) using ammonia solution (0.5 wt% in 100 mL of latex, which corresponds to less than 1 wt% of solid NRL). The viability of healthy and cancer cells for ammonia was reported in our previous study [Citation13]. The characterization of NRL nanoparticle was already discussed in our previous study [Citation7].
2.2. In vitro cell culture
hMSCs (Takara Bio) were cultured in Mesenchymal Stem Cell Growth Medium 2 (MSCGM2) (Takara Bio). Upon reaching confluence, cells were cultured on 10-cm dishes in an atmosphere of 5% CO2 and 95% relative humidity at 37 °C. hMSCs at 5–8 passages were used in the experiment.
2.3. Cell viability assay
The cells were seeded in 96-well plates at a cell concentration of 2.0 × 10⁴ cells/cm2 in 100 µL of media and cultured for 24 h. The NRL nanoparticle suspensions at different concentrations (ranging from 10 µg/mL to 10 mg/mL) were diluted with each complete culture medium and added to each well in 100 µL. After incubation for 24 h in an atmosphere of 5% CO2 and 95% relative humidity (normoxia) or hypoxic condition (94% N2, 5% CO2, and 1% O2) at 37 °C, the cell viability was assessed by WST-8 assay (Dojindo) according to manufacturer’s instructions. The WST-8 colorimetric test measures the activity of intracellular dehydrogenase activity, which is proportional to living cells. The optical density was read on a Multiskan FC (Thermo Fisher Scientific) at 450 nm for the absorbance and at 650 nm for the subtract background absorbance, respectively. The half maximal inhibitory concentration (IC50) values at 24 h were estimated from the dose–response curves.
2.4. Flow cytometry
Cells were seeded on 10-cm dish at a density of 3.0 × 10⁵ cells/cm2 and incubated for 24 h, then the cells were exposed to NRL nanoparticles at concentration of 0.32 mg/mL and 1.7 mg/mL (equal to IC50 for hMSCs) for 6 or 24 h under normoxic or hypoxic conditions. After incubation, the cells were washed twice with cold phosphate buffered saline (PBS) and collected by trypsinization. Then the cells were washed and centrifuged twice with PBS again, and fixed 10 mL 100% MeOH at 4 °C overnight. Then the cells were centrifuged and washed twice with 10 mL PBS, resuspended in propidium iodide (PI, Sigma–Aldrich) solution, i.e. 0.25 mg/mL RNAse in PBS, pH 7.4 for 37 °C for 30 min plus 50 µg/mL PI for 30 min in darkness at room temperature. The cell cycle distribution was analyzed by a flow cytometer (Attune® NxT Acoustic Focusing Cytometer, Thermo Fisher Scientific).
2.5. Spheroids production for chondrogenic differentiation
In order to form spheroids for chondrogenic differentiation by 3D culture, hMSCs were seeded onto EZsphere® 96-well plates (Iwaki) (round bottom) at a density of 5 × 10⁴ cells/cm2 in 100 µL of culture medium (MSCGM2) and incubated for 24 h. After formation of hMSCs spheroids onto each well, culture medium was completely changed to chondrogenic medium (Mesenchymal Stem Cell Chondrogenic Differentiation Medium, Promo Cell) and NRL nanoparticle suspensions at different concentrations (ranged from 32 µg/mL to 0.32 mg/mL) were administrated to each well. hMSCs spheroids cultured with NRL nanoparticles were harvested at different time points (day 3, 7, 14, and 21) under normoxic or hypoxic conditions for further investigation. The medium was changed with a fresh one every 3 days, six times during the 21 days of incubation.
For evaluation of spheroids size, hMSCs spheroids incubated at different time points were fixed with 3.7% paraformaldehyde in PBS solution for 10 min after two quick rinses with PBS. The cell cytoskeleton and nuclei were stained by Alexa Fluor 488 phalloidin (Life Technologies) and Hoechst 33342 (Life Technologies) for 20 min. Cell images were taken on a fluorescent microscope and analyzed to measure spheroids size using ImageJ image analysis software.
2.6. Real-time polymerase chain reaction
Gene expression analysis for chondrogenic differentiation was performed using Fast SYBR® Green Cells-to-CT™ Kit (Thermo Fisher Scientific) which involves obtaining results directly from cultured cells to real-time polymerase chain reaction (RT-PCR) results without purification of the total RNA extracted from the cultured cells. According to the protocol, the total RNA was extracted from hMSCs-based spheroids after chondrogenic differentiation with NRL nanoparticles (0.1 mg/mL) for 3, 7, and 14 days and the total RNA was subjected to reverse transcription. The resulting cDNA yield was then subjected to RT-PCR using a LightCycler® 96 System (Roche). The reaction solutions included SYBR Green Mastermix, 300 nM forward and reverse predesigned primers (Supplementary data Table S1), and 2 μL cDNA template in a 10 μL volume. The cDNA samples were analyzed for expression of hypoxia-inducible factor 1α (HIF-1α), SRY-box 9 (SOX9), aggrecan, collagen type-II (Col-II), collagen type-I (Col-I), and runt-related transcription factor 2 (Rux2), relative to glyceraldehyde-3-phosphate dehydrogenase (GAPDH) as an internal standard for sample normalization.
2.7. Immunofluorescence staining
The spheroids were sectioned into two pieces and were fixed with 3.7% paraformaldehyde for 15 min at room temperature. The spheroids were then washed with PBS and permeabilized with 0.1% Triton X (Nacalai Tesque, Kyoto) for 6 min. The spheroids were washed twice with PBS. To visualize NRL nanoparticles in hMSCs spheroids, immunofluorescence staining was chosen. NRL nanoparticles were exposed to Goat anti-human IgE ε-chain antibody conjugated with FITC (MBL Co., Nagoya) diluted in PBS (1/100 vol/vol) overnight at 5 °C in the dark. The cell nuclei were stained by Hoechst 33342 (Life Technologies) for 15 min to visualize the nuclei. Cell images were taken on a fluorescent microscope using ×20 objective lens and ×40 oil-immersed objective lens.
2.8. Histological staining
The spheroids was embedded in paraffin, and sectioned (∼10-µm thick) in Biopathology Institute Co., Ltd., Japan. The cross-sections were stained with hematoxylin and eosin (HE) (Sigma-Aldrich Japan, Japan) for cell morphology, safranin-O/fast green (Sigma-Aldrich Japan, Japan) for glycosaminoglycan for 5 min, and enclosed. Cell images were taken on a fluorescent microscope using ×20 objective lens.
2.9. Atomic force microscopy measurements of spheroid stiffness
Atomic force microscopy (AFM) (SPM-9700HT, Shimadzu) microindentation was performed for spheroid stiffness including height image, adhesive force, and elastic modulus of hMSCs-based spheroids incubated for 21 days. Prior to the AFM measurement, each spheroid was fixed by carbon tape and immersed in PBS to prevent from drying (Supplementary data Figure S1). The silicon nitride cantilever (OMCL-TR800PSA, OLYMPUS) with spring constants of 0.15 N/m and a tip radius of 15 nm were used. AFM image mapping were ranged from 20 × 20 µm2 in NRL-loaded and -unloaded samples and the areas were divided in 16 × 16 sections having individual force curve. Approach and retracting force curves were recorded at 1 Hz for determination of elastic modulus and surface adhesive force, respectively. Elastic modulus was ditermined by Johnson–Kendal–Roberts (JKR) two-point method [Citation14]:
(1)
(1)
(2)
(2)
where K is reduced modulus, E is Young’s modulus,
is Poisson’s ratio (=0.5), and R is tip radius, F is applied force and δo − δ1 is relative deformation. To calculate the elastic modulus, the Poisson’s ratio of the cell was taken to be 0.5, because a cell is a typical soft biological material [Citation15]. Adhesive force was calculated as difference from the maximum load state and no-load state in the retraction curve. To obtain robust values for stiffness and adhesive force, stiffness and adhesive force image mapping were fitted to Weibull distribution [Citation16]:
(3)
(3)
where α and β are fitting parameter and α means variance, β means medians in Weibull distribution.
2.10. Statistics
All data presented are expressed as the mean and standard deviations (±SD). Statistical analysis was performed using one-way analysis of variance with Tukey–Kramer’ post hoc testing, and significance was considered at a probability of p < 0.05.
3. Results and discussion
3.1. Cytotoxicity of NRL nanoparticles and cell cycle
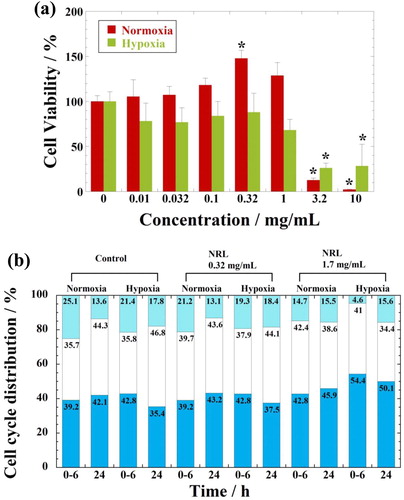
The viability of hMSCs under normoxic condition indicates very sensitive to the NRL nanoparticle concentration, accompanied with high metabolic and dehydrogenase activity of the cells at concentration of less than 0.1 mg/mL (). Beyond concentration of 0.1 mg/mL, NRL nanoparticles enhance hMSCs and viability in the range of 130%–150% in comparison with the control within 24 h. The estimated IC50 values are 1.7 mg/mL for hMSCs in the range of 10 µg/mL–10 mg/mL. With increasing concentration up to 1.0 mg/mL, a significant vitality reduction is not observed in comparison with the control for the detection of living cells by WST-8 assay. Under hypoxic condition, hMSCs exhibit no toxic effects and are not sensitive to NRL nanoparticles at concentration up to 1.0 mg/mL. The results demonstrate higher biocompatibility of the NRL nanoparticles without a significant vitality reduction for hMSCs under both normoxic and hypoxic conditions. In hypoxia, the estimated IC50 values are 1.55 mg/mL for hMSCs in the range of 10 µg/mL–10 mg/mL.
Figure 1. (a) Effect of oxygen concentrations on cell viability as measured by WST-8 assay using hMSCs after 24 h of incubation with NRL nanoparticles of different concentrations. Data were expressed as mean ± SD (n = 4). Note: *p < 0.05 compared with control. (b) Effect of oxygen concentrations on cell cycle distribution of hMSCs after without treatment (control), treated with NRL nanoparticles of 32 µg/mL and of 1.7 mg/mL (equal to IC50 in normoxia for hMSCs) in G0/G1 (dark colors), S (white), and G2/M (light colors) for 0–24 h.
In our previous study, we have successfully fractionated NRL nanoparticles by ultra-centrifuge and obtained three constituents, i.e. rubber component, intermediate phase, and sediment [Citation7,Citation13]. The effect of the non-rubber constituents (intermediate of 5.8 wt% and sediment of 0.2 wt%) on the cytotoxicity against healthy cells was clarified [Citation13,Citation17]. The intermediate phase (5.8 wt%) corresponding to dissolved components in water exhibits adsorbed proteins together with adsorbed phospholipids on the NRL surfaces. The remainder as a sediment (0.2 wt%) is non-rubber constituents such as inorganic ions and sterol glycosides [Citation7]. The intermediate phase induces the enhancement of cellular proliferation and viability in the range of 110%–140%, which is a similar characteristic to NRL nanoparticles [Citation13].
The cell cycle has been examined with the focus on the cellular proliferation. For better understanding of the proliferation state, the cell cycle distribution is shown in . The cell proliferation is controlled by different phases such as the G0/G1 (containing two copies of each chromosome), S (synthesis of chromosomal DNA), and G2/M (doubled chromosomal DNA) phases. Under normoxic condition, the hMSCs exhibits no observed notable difference in distribution from 6 to 24 h, as compared to that of control under the cells exposed to NRL concentration of 0.32 mg/mL. For the cells incubated with IC50 value (1.7 mg/mL), the prolonged G0/G1 phase for 24-h incubation indicates the presence of cell death such as apoptosis [Citation7]. In addition, the small increment of the fraction of cells with NRL nanoparticles (1.7 mg/mL) is found in the G2/M phase. In hypoxia, this condition shows some significant effect on the prolonged G0/G1 phase for 24-h incubation with NRL nanoparticles (1.7 mg/mL, which is near IC50 in hypoxia) in comparison with the cell cycle at concentration of 0.32 mg/mL (<IC50). It is clear from these cell cycle distributions that almost no effect of suppression on the proliferation for hMSCs seems to be different due to the significant difference in cytotoxicity accompanied by NRL concentration in the medium. Our data show that the addition of even as much as 1.0 mg/mL of NRL nanoparticles in cell culture did not kill the tested hMSCs. The potential application of NRL nanoparticles to biological tissue is expected when one applies NRL nanoparticles as an additive for the regenerative cartilage tissue.
3.2. Chondrogenic gene expression
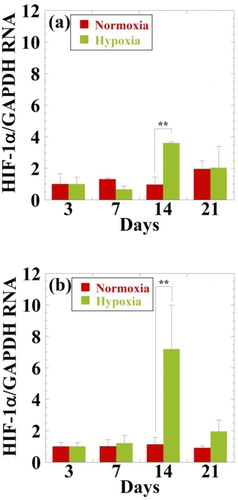
The gene expressions of HIF-1α, SOX9, aggrecan, Col-II, Col-I, and runt-related transcription factor 2 (Rux2) relative to housekeeping gene (GAPDH) were determined by RT-PCR for a period of 3, 7, 14, and 21 days. The relative gene expressions of HIF-1α in NRL nanoparticles loaded (0.32 mg/mL) spheroids are presented in after normalization to the data at day 3. The HIF-1α level under hypoxic condition is markedly increased in hMSCs incubated at day 14 (3.7-fold) in comparison with that of normoxic condition but not a period of 7 and 21 days (). Similar results were obtained in NRL nanoparticles loaded (0.32 mg/mL) spheroids under hypoxic condition. The hMSCs treated with NRL nanoparticles under hypoxic condition express more HIF-1α (7.2-fold) in comparison with that of the data at day 14 ().
Figure 2. Effect of oxygen concentrations on gene expression of HIF-1α for hMSCs (a) and hMSCs cultured with NRL nanoparticles of 0.32 mg/mL at different time interval (3, 7, 14, and 21 days). Data were normalized to the data at day 3 and were expressed as mean ± SD (n = 3). **p < 0.01.
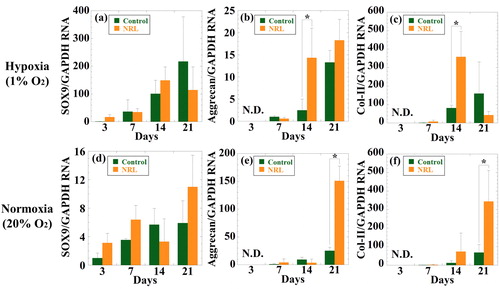
SOX9 is a kind of transcription factors, which is essential for the chondrogenesis. For instance, mouse chimeras that knockout the SOX9 gene do not express chondrocyte-specific markers such as Col-II and aggrecan [Citation18]. More upregulation of SOX9 has shown a trend to further induce the chondrogenesis of hMSCs. The expression of SOX9 in hypoxia gradually increases throughout 21 days of culture. The relative gene expression of SOX9 is normalized to those of control at day 3. The upregulation of SOX9 is observed in NRL nanoparticles-loaded (0.32 mg/mL) spheroid at day 14 (). But there are no statistical difference between NRL-loaded spheroids and control. The expression of SOX9 in normoxia is shown in . The behavior is consistent with the results incubated in hypoxia. As expected, the expression level in hypoxic microenvironment is significantly greater than that observed under normoxic condition, indicating that the chondrogenesis of hMSCs is promoted in the hypoxic microenvironment [Citation19,Citation20].
Figure 3. RT-PCR analysis of the chondrogenic gene expression of (a) and (d) Sox9, (b) and (e) aggrecan, (c) and (f) Col-II, for hMSCs cultured with NRL nanoparticles of 0.32 mg/mL at different time interval (3, 7, 14, and 21 days) under both normoxic (a–c) and hypoxic (d–f) conditions. Data were normalized to those of control at day 3 for (a) and (d) or at day 7 for (b), (c), (e), and (f) and were expressed as mean ± SD (n = 3). *p < 0.05. N.D. indicates data were not detected.
Articular cartilages are composed of water mostly (∼70 wt%). Chondrocytes are minor components (only few percent) and other components are proteoglycans (a kind of glycoproteins) and Col-II. The basic structure of the proteoglycans consists of central core protein where one or more glycosaminoglycan side chains are covalently linked to each other.
Aggrecan is one of the major components of proteoglycans, which have been composed of chondroitin sulfates as glycosaminoglycan side chains. It provides resistance to any fluid flow and redistribution of water. Therefore, articular cartilages are referred to as a viscoelastic tissue and it behaves like the stiff elastic polymer resistant to sudden impact loading [Citation21]. NRL nanoparticles stimulate the synthesis of aggrecan from day 7 to day 21 of culture (). As with SOX9 in NRL-loaded spheroids, the expression of aggrecan is over 6-fold at day 21 in comparison to control, suggesting that the cartilage cultured with NRL nanoparticle produce a large amount of aggrecans. The expression in normoxia is lower in comparison with that in the hypoxic microenvironment (). The expression level of SOX9 and aggrecan are high in the spheroid, indicating that chondrogenic differentiation is successfully induced by the administration of NRL nanoparticles in hypoxia.
The Col-II is upregulated at day 14. The expression level in NRL and NRL-loaded spheroids is more than fourfold in comparison with the control (). Similar results were obtained in NRL nanoparticles loaded (0.32 mg/mL) spheroids under normoxic condition ().
While, the expression levels of collagen type-I (Col-I) in normoxia are elevated up to day 7 for control and day 14 for NRL-loaded spheroids and have a decreasing trend at 21 days (). Under both normoxic and hypoxic conditions, NRL-loaded spheroids are maintained for 21 days (). The NRL nanoparticles promote the suppression of the Col-I expression. It was well known that Col-I is expressed in most of cell types except chondrocytes. Therefore, this decrease is accompanied by acquisition of a chondrogenic phenotype. The result of the Col-II gene expression is consistent with the result of the Col-I expression.
Figure 4. RT-PCR analysis of the chondrogenic gene expression of (a) and (b) Col-I, and (c) and (d) Rux2 for hMSCs cultured with NRL nanoparticles of 0.32 mg/mL at different time interval (3, 7, 14, and 21 days) under both normoxic and hypoxic conditions. Data were expressed as mean ± SD (n = 3). *p < 0.05 and **p < 0.01.
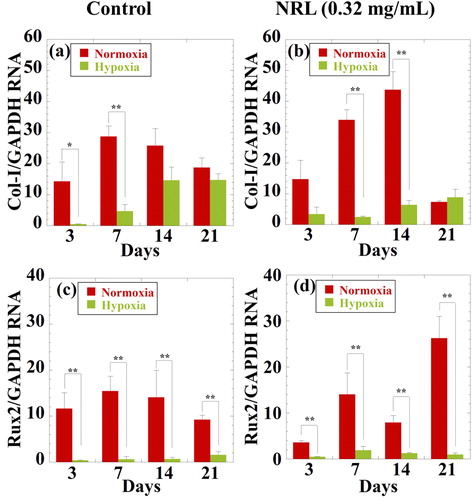
In addition, the administration of NRL nanoparticles in hypoxia yields suppression throughout 21 days of runt-related transcription factor 2 (Rux2) (). This shows the same trend with Col-I expression. Rux2 drives the expression of the terminal differentiation marker (chondrocyte hypertrophy [Citation22]), which functionally contributes to endochondral ossification [Citation23]. These results indicate that the NRL nanoparticles do not cause so significant change in differentiation/hypertrophy [Citation22] and endochondral ossification.
We well recognized the necessity to explore in more detail the mechanism regarding NRL–cell interaction. Up to now, we have limited information regarding surface proteins of NRL nanoparticles. Therefore, the characterization of the surface proteins and its amino acid sequence identification are imperative. These are challenging subjects to investigate as a future study.
3.3. Histological and immunofluorescence staining of cartilage tissues
To produce the cartilage tissue, it needs to be replicated in a three-dimensional (3D) model that aspire at mimic its in vivo counterparts. The most widely used 3D model is the spheroid that are aggregates of cells formed under non-adherent conditions able to recapitulate the dimensionality of the microenvironment [Citation24,Citation25].
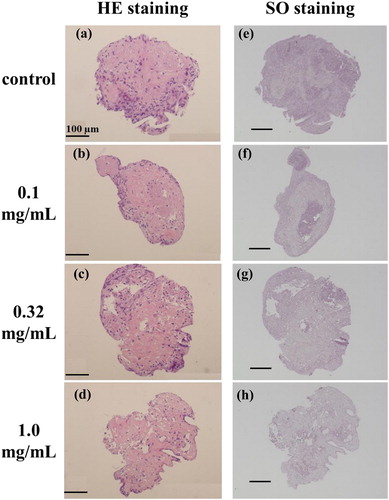
The overview of the cross-sections of the cartilage (spheroid) after 21 days culture in hypoxia is shown in . Histological examination of these specimens using hematoxylin and eosin (HE) stains indicates a heterogeneous spatial cell distribution throughout all specimens (). The chondrocytes showed a natural round morphology in the outer region of the spheroid presumably due to hypoxic condition. In the central region of the spheroid, cartilage tissue based on Col-II was undergoing maturation throughout all specimens. The bright-safranin-O stain indicated that glycosaminoglycans were abundant and homogeously distributed in the spheroid (). The histological examination did not show any difference throughout all specimens.
Figure 5. Representative micrographs of the internalized collagen type-II and glycosaminoglycans in the sections of control and NRL-loaded spheroid after 21 days culture in hypoxia: (a)–(d) cell nuclei stained by hematoxylin (blue) and collagen type-II stained by eosin (red), (e)–(h) glycosaminoglycans stained by safranin-O (red). Bars represent 100 µm.
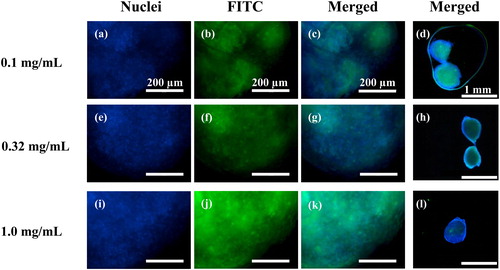
Examination using a fluorescent microscope shows internalized NRL particles in the sections of NRL-loaded spheroid after 21 days culture in hypoxia (). The cell nuclei were stained with Hoechst 33342 (blue fluorescence) (). As shown in merged images (), strong fluorescent signals are detectable in treated spheroid using the amount of green fluorescence emitted by fluorescein isothiocyanate dextran (FITC)-labeled NRL (0.1, 0.32, and 1.0 mg/mL), which are dispersed in the spheroid. The different features in the spheroids do not seem to change in the different NRL loading concentration, as roughly estimated from fluorescence images. Further confirmation of the localization of cell nuclei near to the spheroid surface is detectable at low magnification images (). The cells further confirmed accumulation of the spheroid surface.
Figure 6. Representative micrographs of the internalized NRL particles in the sections of NRL-loaded spheroid after day 21 culture in hypoxia: (a), (e), and (i) cell nuclei stained by Hoechst (blue); (b), (f), and (j) FITC-labeled NRL particles (green); and (c), (d), (g), (h), (k), and (l) merged images of the NRL-loaded spheroid with three different NRL concentration (0.1, 0.32, and 1.0 mg/mL). Bars represent 200 µm for (a)–(c), (e)–(g), (i)–(k), and 1 mm for (d), (h), and (l).
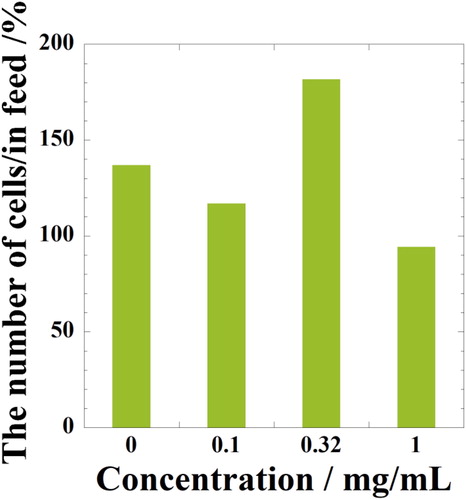
The cell density was calculated from the image of HE staining by using the ImageJ software. Using the method demonstrated in Supplementary data Figure S2, the area of the cell nuclei per area of the cross-sections of the spheroid was quantitatively analyzed from the images and turned into the number of cells in the volume of spheroid, with the results shown in . As shown in , the number of cells per in feed, i.e. proliferation of cells is observed in NRL nanoparticles loaded (0.32 mg/mL) spheroid at day 21. A significant reduction is observed at high concentration of NRL nanoparticles (1.0 mg/mL). In our previous study [Citation12], for day 3 incubation of hMSCs, almost fourfold increase in cell density and the proliferation in optimum NRL nanoparticle concentration of 0.32 mg/mL were observed. In addition, we have reported that the time evolution of the spheroid size with contraction. Starting from day 3, the size of spheroid formation without NRL nanoparticles (control) decreased during culture time up to day 14 due to the balance between the aggregation and contraction phenomena caused by cellular activity. The NRL concentration is predominant in comparison to the contraction phenomena, leading to a size increment over time due to the cellular proliferation, i.e. the suppression of the spheroid contraction.
Figure 7. The number of cells in hMSC spheroids per infeed fter day 21 culture in hypoxia with NRL nanoparticles of different concentrations.
3.4. Elastic and adhesive properties on surface of cartilage
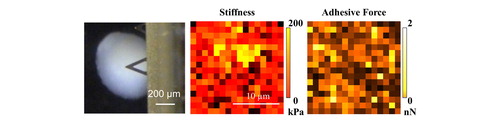
The fixed chondrocyte spheroid structures in PBS are taken by CCD camera (Supplementary data Figure S3). For the spheroid (∼600 µm) cultured with NRL nanoparticles at different concentration, the obtained image of topography exhibits smooth surface morphology in 20 × 20 µm2 as compared with the control (i.e. without NRL nanoparticles) (Supplementary data Figure S4). The adhesive force and Young’s modulus maps in 20 × 20 µm2 (256 points) are constructed of these indented areas for the spheroid (∼600 µm) cultured with NRL nanoparticles at three different concentrations of 0.1, 0.32, and 1.0 mg/mL in hypoxia ().
Figure 8. Young’s modulus map results represented as a heat map: (a) without NRL nanoparticles (control) and NRL loading spheroid with concentration of (b) 0.1 mg/mL, (c) 0.32 mg/mL, and (d) 1.0 mg/mL obtained from the selected 20 × 20 µm2 area. Adhesive force map results represented as a heat map: (e) control and NRL-loading spheroid with concentration of (f) 0.1 mg/mL, (g) 0.32 mg/mL, and (h) 1.0 mg/mL obtained from the selected 20 × 20 µm2 area.
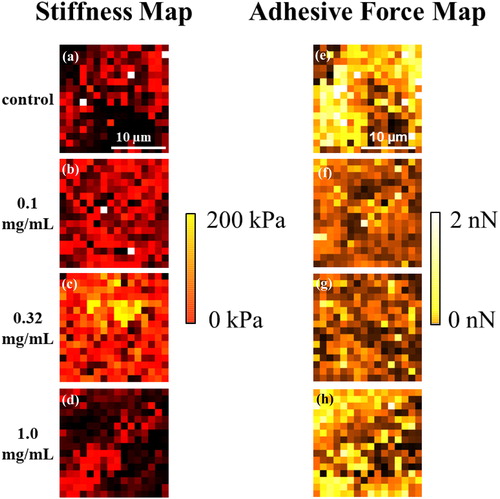
The heterogeneity in stiffness is detected also by AFM indentation. For the early stage of the deformation (corresponding to approach curve), the composition of the surrounding spheroid surface is carefully monitored. For the observed heterogeneous structure, the larger deformability in retraction curve (unloading force) of the adhesive force is revealed.
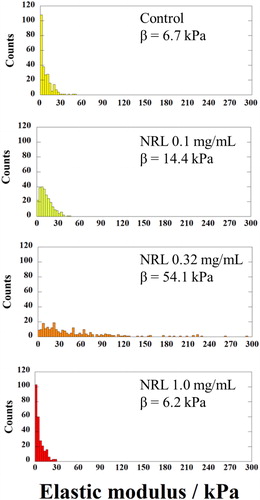
The modulus histogram of the spheroid cultured without NRL nanoparticles (control) is distributed in the range 4–60 kPa and exhibits an evaluated mean modulus of 6.7 kPa by the Weibull distribution curve (, upper panel). Interestingly, in comparison with the stiffness of the NRL-loaded spheroid with concentration of 0.32 mg/mL, the surface heterogeneity was found that the spheroid showed higher modulus (54.1 kPa) with a broadening in the modulus distribution (4–300 kPa) (, 3rd panel), indicating an effect of the administration of NRL nanoparticles in chondrogenic differentiation of hMSCs. This finding may indicate a significant contribution of the dispersion of the NRL nanoparticles in the surface structure in chondrogenesis. The elastic modulus of NRL was measured to be ∼1 MPa, which is much higher than that of cartilage tissue [Citation26]. In addition, the spheroid with NRL concentration of 1.0 mg/mL was overall less stiff (6.2 kPa) (, bottom panel).
Figure 9. Histograms showing elastic modulus of chondrocyte spheroids without NRL (control) and with NRL nanoparticles concentration of 0.1, 0.32, and 1.0 mg/mL. The curves indicate the fitted Weibull distribution function (β = median).
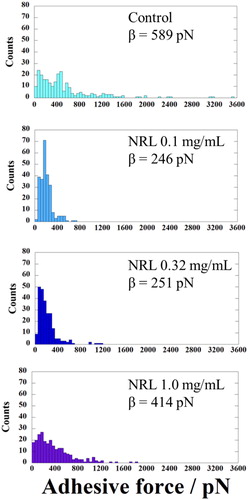
The adhesive force histograms of the spheroids are presented in . The spheroid cultured without NRL nanoparticles exhibits a broad force distribution in comparison to NRL-loaded spheroid. The evaluated mean adhesive forces are 545 and 244 pN for control and NRL-loaded (0.32 mg/mL) spheroid, respectively. This result may be due to the interaction of the hard surface structure in the spheroid as postulated earlier. For NRL-loaded (0.32 mg/mL) spheroid, the comparison between stiffness and adhesive force maps is shown in Supplementary data Figure S5. Importantly, an examination of distribution of local area with high modulus in 5 × 5 µm2 (marked with the arrow) revealed a dramatic decrease in adhesive force heterogeneity of the spheroid surface.
Figure 10. Histograms showing adhesive force of chondrocyte spheroids without NRL (control) and with NRL nanoparticles concentration of 0.1, 0.32, and 1.0 mg/mL. The curves indicate the fitted Weibull distribution function (β = median).
Until now, the successive effects of providing the differentiation of hMSCs into chondrocytes and a mechanically stable structure into cartilage tissue have not been reported.
Many natural composite materials such as collagen, gelatin, chondroitin sulfate, and silk fibroin have been widely used to fabricate scaffolds for cartilage tissue engineering in recent years [Citation27,Citation28]. The scaffold-based tissue engineering is not sufficient for cartilage tissue repair as there is a deficiency of cell-specific binding sites and limited option for growth factor anchorage capacity. In this regard, the administration of NRL nanoparticles acted as main component for gene expression and exhibited the mechanically stable structure. Thus, the NRL nanoparticles might be a potential loading component for cartilage tissue repair.
4. Conclusions
To broaden the knowledge regarding regenerative medicine in NRL nanoparticles, we have examined the chondrogenesis ability of NRL nanoparticles in vitro against hMSCs in hypoxia. NRL nanoparticles had enhanced the cell proliferation of hMSCs. The results demonstrate higher biocompatibility of the NRL nanoparticles without a significant vitality reduction for hMSCs.
We have successfully fabricated the cartilage/NRL biocomposites via hMSC spheroid under hypoxic condition, where the administration of NRL nanoparticles exhibits the suppression of the spheroid contraction due to the cellular proliferation of hMSCs. It has emerged that the NRL nanoparticles acted as a main component, which provides surface heterogeneity of the spheroid, leading to a mechanically stable structure with eightfold higher modulus in comparison with the control as revealed by AFM microindentation.
We have demonstrated that the formation of the cartilage/NRL nanoparticles biocomposite results in having a stiff surface. The gene expression level of SOX9, aggrecan, and Col-II, and glycosaminoglycans formation were high in the spheroid under hypoxic condition, indicating that chondrogenic differentiation was successfully induced by the administration of NRL nanoparticles.
The results showed promise of the NRL nanoparticles for well-controlled chondrogenic differentiation and mechanically stable cartilage tissue. Further efforts are needed to explore the viscoelastic and long-term properties of the biocomposites for cartilage tissue.
Supplemental Material
Download MS Word (2.5 MB)Data availability
The data used to support the findings of this study are available from the corresponding author upon request.
Disclosure statement
The authors declare no competing financial interest.
Additional information
Funding
Notes on contributors
Yuki Okamoto
Yuki Okamoto has graduated with a B.S. in Materials Science, and is currently pursuing a M.S. in Polymeric Nanostructured Materials Engineering at Toyota Technological Institute. His research focuses are in the fields of biocomposite under his advisor M. Okamoto.
Masaya Kinoshita
Masaya Kinoshita has graduated with both a B.S. and M.S. at Toyota Technological Institute, and is a researcher at Toyoda Gosei Co. Ltd.
Masami Okamoto
Masami Okamoto is a professor in Materials Science at Toyota Technological Institute. His expertise is nanostructured materials, tissue-based biocomposites, and cancer cell biology.
References
- Tang C, Huang D, Yang J, et al. The sucrose transporter HbSUT3 plays an active role in sucrose loading to laticifer and rubber productivity in exploited trees of Hevea brasiliensis (para rubber tree). Plant Cell Environ. 2010;33(10):1708–1720.
- Ereno C, Catanzaro Guimaraes SA, Pasetto S, et al. Latex use as an occlusive membrane for guided bone regeneration. J Biomed Mater Res A. 2010;95 (3):932–939.
- Herculano RD, Silva CP, Ereno C, et al. Natural rubber latex used as drug delivery system in guided bone regeneration (GBR). Mater Res. 2009;12(2):253–256.
- Sampaio RB, Mendonca RJ, Simioni AR, et al. Rabbit retinal neovascularization induced by latex angiogenic-derived fraction: an experimental model. Curr Eye Res. 2010;35(1):56–62.
- Floriano JF, Silveira da Mota LSL, Furtado EL, et al. Biocompatibility studies of natural rubber latex from different tree clones and collection methods. J Mater Sci Mater Med. 2014;25(2):461–470.
- Almeida LM, Floriano JF, Ribeiro TP, et al. Hancornia speciosa latex for biomedical applications: physical and chemical properties, biocompatibility assessment and angiogenic activity. J Mater Sci Mater Med. 2014;25(9):2153–2162.
- Furuya M, Shimono N, Yamazaki K, et al. Cytotoxicity and anticancer activity of natural rubber latex particles for cancer cells. Mater Today Chem. 2017;5:63–71.
- Park JS, Yang HN, Woo DG, et al. Chondrogenesis of human mesenchymal stem cells mediated by the combination of SOX trio SOX5, 6, and 9 genes complexed with PEI-modified PLGA nanoparticles. Biomaterials. 2011;32(14):3679–3688.
- Shi D, Xu X, Ye Y, et al. Photo-cross-linked scaffold with Kartogenin-encapsulated nanoparticles for cartilage regeneration. ACS Nano. 2016;10(1):1292–1299.
- Asheesh B, Feeley BT, Williams RJ III. Management of articular cartilage defects of the knee. J. Bone Joint Surg. 2010;92:994–1009.
- Hodge WA, Fijan RS, Carlson KL, et al. Contact pressures in the human hip joint measured in vivo. Proc Natl Acad Sci USA. 1986;83(9):2879–2883.
- Kinoshita M, Okamoto Y, Furuya M, et al. Biocomposites composed of natural rubber latex and cartilage tissue derived from human mesenchymal stem cells. Mater Today Chem. 2019;12:315–323.
- Furuya M, Shimono N, Yamazaki K, et al. Evaluation on cytotoxicity of natural rubber latex nanoparticles and application in bone tissue engineering. e-J Soft Mater. 2017;12:1–10.
- Johnson KL, Kendall K, Roberts AD. Surface energy and the contact of elastic solids. Proc R Soc Lond A. 1971;324:301–313.
- Touhami A, Nysten B, Dufrêne YF. Nanoscale mapping of the elasticity of microbial cells by atomic force microscopy. Langmuir. 2003;19(11):4539–4543.
- Weibull W. A statistical distribution function of wide applicability. J Appl Mech Trans ASME. 1951;18:293–297.
- Furuya M, Shimono N, Domura R, et al. Fabrication of biocomposites composed of natural rubber latex and bone tissue derived from MC3T3-E1 mouse preosteoblast cells. Nanocomposites. 2017;3(2):76–83.
- Bi W, Deng JM, Zhang Z, et al. Sox9 is required for cartilage formation. Nat Genet. 1999;22(1):85–89.
- Kanichai M, Ferguson D, Prendergast PJ, et al. Hypoxia promotes chondrogenesis in rat mesenchymal stem cells: A role for AKT and hypoxia-inducible factor (HIF)-1alpha. J Cell Physiol. 2008;216(3):708–715.
- Yao Y, Shang J, Song W, et al. Global profiling of the gene expression and alternative splicing events during hypoxia-regulated chondrogenic differentiation in human cartilage endplate-derived stem cells. Genomics. 2016;107(5):170–177.
- Mow VC, Zhu W, Lai WM, et al. The influence of link protein stabilization on the viscometric properties of proteoglycan aggregate solution. Biochim Biophys Acta. 1989;992(2):201–208.
- Mrugala D, Dossat N, Ringe J, et al. Gene expression profile of multipotent mesenchymal stromal cells: Identification of pathways common to TGFbeta3/BMP2-induced chondrogenesis. Cloning Stem Cells. 2009;11(1):61–76.
- Arnold MA, Kim Y, Czubryt MP, Phan D, et al. MEF2C transcription factor controls chondrocyte hypertrophy and bone development. Dev Cell. 2007;12(3):377–389.
- Benya PD, Shaffer JD. Dedifferentiated chondrocytes reexpress the differentiated collagen phenotype when cultured in agarose gels. Cell. 1982;30(1):215–224.
- Villasante A, Vunjak-Novakovic G. Tissue-engineered models of human tumors for cancer research. Expert Opin Drug Discov. 2015;10(3):257–268.
- Wang YC, Ludwigson M, Lakes RS. Deformation of extreme viscoelastic metals and composites. Mater Sci Eng A. 2004;370(1–2):41–49.
- Cao H, Xu SY. EDC/NHS-crosslinked type II collagen-chondroitin sulfate scaffold: characterization and in vitro evaluation. J Mater Sci Mater Med. 2008;19(2):567–575.
- Sawatjui N, Damrongrungruang T, Leeanansaksiri W, et al. Silk fibroin/gelatin-chondroitin sulfate-hyaluronic acid effectively enhances in vitro chondrogenesis of bone marrow mesenchymal stem cells. Mater Sci Eng C Mater Biol Appl. 2015;52:90–96.