
 ?Mathematical formulae have been encoded as MathML and are displayed in this HTML version using MathJax in order to improve their display. Uncheck the box to turn MathJax off. This feature requires Javascript. Click on a formula to zoom.
Abstract
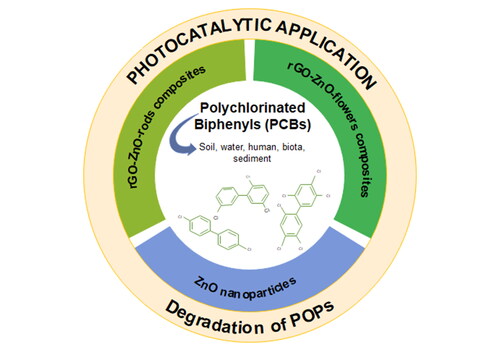
PCBs were used for several decades as coolants, lubricants in transformers, plasticizers, and dielectric fluids, being highly carcinogenic and representing a severe environmental problem in soil and water. Pure and modified TiO2 has been the most studied photocatalyst looking to degrade PCBs into less toxic products. Lately, ZnO-graphene composites have played an essential role in the photocatalytic degradation of various toxic organic compounds. In this work, ZnO nanostructures were coupled with reduced graphene oxide (ZnO-rGO) via a one-pot microwave-assisted hydrothermal route. As a result, the composites exhibited improved photocatalytic performance for PCBs degradation compared to ZnO nanoparticles. Thus, this research provides an in-situ method to grow different morphologies of ZnO on rGO.
Graphical Abstract
1. Introduction
Graphene-based materials can be used as support, co-catalyst, and photosensitizer coupled with semiconductors [Citation1,Citation2]. The structural features of graphene oxide (GO) and reduced graphene oxide (rGO) can significantly improve the photocatalytic performance of semiconductors by promoting the separation of electron-hole pairs on their surface and enhancing the harvesting of light energy in the visible region [Citation3,Citation4]. However, many graphene-based materials have been designed for pollutant degradation due to their excellent electrical and thermal conductivity and large surface area. On the other hand, Zinc oxide (ZnO) has emerged as a promising candidate for environmental applications thanks to its essential properties: (i) it is capable of generating powerful oxidants such as hydroxyl and superoxide radicals, (ii) it has low toxicity and high chemical and thermal stability, thus exhibiting optimal environmental compatibility, and (iii) it is a potentially cheaper alternative to the benchmark TiO2 [Citation2,Citation5–10]. Furthermore, several photocatalytic reactions depend on the size and morphology of the employed ZnO nanostructures [Citation11,Citation12]. It is worth noting that ZnO nanorods present excellent photoexcitation, separation, and diffusion of the electron-hole pairs, which gives rise to enhanced photocatalytic activity [Citation13].
Half of the world’s environment is polluted with chlorinated unrefined chemicals. One of the significant organic pollutants, PCBs, are synthetic chemicals and have persistent nature. PCBs are called e-waste because they are produced through electrical or electronic waste. These compounds are solids or oily liquids, brightly yellow in color, odorless, and tasteless [Citation14,Citation15]. PCBs are carcinogens and can accumulate in adipose tissue, causing diseases in the brain, skin, and internal organs and influencing the nervous, reproductive, and immune systems [Citation16,Citation17]. Their global production is estimated at more than 1.2 million tons from 1929 to 1977, and significant amounts were released into the environment. They can enter drinking water by runoff from landfills, industrial waste discharge, or industrial incinerators [Citation18]. Although its production was suspended, it is estimated that half of the total output has been used as insulating material in electrical equipment such as capacitors and transformers, which reflects the magnitude of the environmental problem [Citation19].
PCBs are part of the Stockholm convention’s list of eradication compounds. The convention held in May 2004 made it mandatory to ban the use of products containing PCBs by 2025 and to eco-friendly dispose of PCBs containing wastes by 2028 [Citation20]. Since then, the number of publications on different PCBs removal methods in different matrices, such as water, soil, and oil, has increased (). Currently, as shown in the inset of , the leading technology for the removal of PCBs is incineration [Citation21].
Figure 1. Several published articles regarding PCBs removal. Keywords: "PCBs or polychlorinated biphenyls" AND "removal or elimination or degradation." Inset: Main PCBs removal techniques. Source: ScienceDirect.
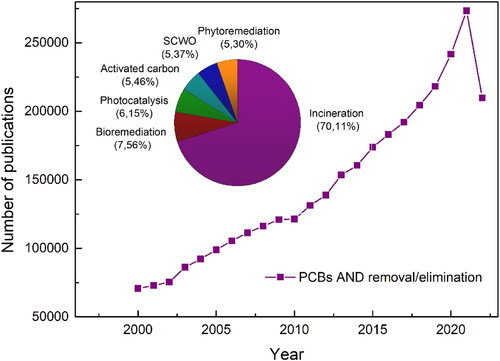
However, it requires expensive installations and high temperatures above 1200 °C. In addition, thermal treatment generates dioxins that are much more toxic than PCBs. Therefore, it is not a good environmentally responsible disposal strategy. Other strategies such as phytoremediation [Citation22], biological treatments [Citation23,Citation24], supercritical water oxidation (SCWO) [Citation20,Citation25], adsorption on carbon activated [Citation26,Citation27], and photocatalysis [Citation11,Citation18] methods are also investigated in PCBs remediation.
Our previous work reported a simple and effective microwave-assisted hydrothermal route to obtain rGO/ZnO-flowers and rGO/ZnO-rods composites evaluated in photocatalytic dye degradation [Citation28]. As a result, we found high adsorption and photocatalytic degradation (ca. 100%) of aqueous methylene blue, which was explained by a good coupling between the rGO sheets and the different ZnO morphologies. Herein, we present an original investigation by using our ZnO/rGO composites, highlighting the ZnO structural and morphological effects on PCB photocatalytic degradation.
2. Materials and methodology
2.1. Chemical reagents
Solution analytical standard of PCB congeners in isooctane (PCB 28, PCB 52, PCB 101, PCB 138, PCB 153, and PCB 180), Zn(CH3COO)2.2H2O, NaOH, CH3CH2OH, HCl (37%), graphite powder 20 µm, H3PO4 (85%), H2SO4 (98%), KMnO4 and H2O2 (30%) were purchased from Sigma-Aldrich. All chemicals used in the experiment were analytical reagent grade and used as received. The aqueous solutions were prepared using ultrapure water.
2.2. Synthesis of ZnO nanoparticles
As reported previously, ZnO nanoparticles were synthesized using a microwave-assisted method [Citation29]. First, a solution of 3 M NaOH was added to 20 mM Zn(CH3COO)2.2H2O until pH = 9 was obtained. This solution was stirred at 500 rpm for about 30 min. Afterward, the aqueous solution was transferred to a microwave oven with 1000 W of power and 60 s microwave irradiation. The obtained precipitate powder was washed several times (6000 rpm and 20 min) with deionized water and ethanol to remove impurities. Finally, the powder sample was dried at 80 °C for 12 h.
2.3. Synthesis of ZnO-rGO composites
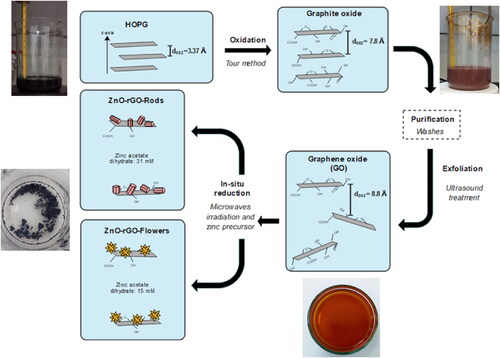
presents the different stages of obtaining the studied photocatalysts. A highly ordered pyrolytic graphite (HOPG) was used as a carbonaceous precursor for getting GO. The GO was synthesized according to the Tour method [Citation30,Citation31], and ZnO-rGO nanocomposites were prepared using the microwave-assisted hydrothermal route [Citation28]. An aqueous zinc acetate dihydrate was mixed with KOH (3 M) solution under constant stirring until a pH = 12 was reached and then subjected to ultrasonic treatment for 5 min. The Zn+2 precursor varied from 0.031 M to 0.015 M to obtain rod and flower-type ZnO, denoted as ZnO-rGO-Rods and ZnO-rGO-Flowers, respectively. A mixture of 1:1 of aqueous GO dispersion and Zn precursor solution was subjected to magnetic stirring for 20 min. The final blend was transferred into a Parr microwave acid digestion vessel and irradiated for 40 s in a microwave oven. The precipitate powder was washed with deionized water and an aqueous ethanol solution to remove impurities. Finally, the powder samples were dried at 80 °C for 7 h.
Figure 2. A schematic mechanism for obtaining GO and rGO-ZnO nanocomposites.
2.4. Characterization
Structural characterization was carried out using an X-ray diffractometer (XRD) D8 Bruker AXS equipped with a Co-Kα source, λ = 1.7903 Å. The morphology of the samples was analyzed using a scanning electron microscope (SEM) JEOL JSM-6490LV and transmission electron microscope (TEM) with JEM2100 operating at an acceleration voltage of 200 kV. The DRS results were obtained with a Varian Cary 100 spectrophotometer with an integration sphere in a wavelength range between 200 and 900 nm. Furthermore, the Kubelka-Munk (K-M) function was used as model for diffuse reflection.
The samples were also analyzed by photoluminescence (PL) spectroscopy by using an FLS1000 spectrophotometer (Edinburg Instruments). The employed excitation wavelength was 325 nm, and the emission of the samples was captured from 350 to 800 nm at room temperature. Each spectrum was acquired using a spectral resolution of 0.5 nm and five accumulations of 0.1 s at each point.
2.5. Photocatalytic measurements
A mixture of six congeners of PCBs with different degrees of chlorination was selected as a model organic pollutant. The photocatalytic performance was tested under UV-A light in the presence of the ZnO-rGO nanocomposites and ZnO nanoparticles as a reference. Typically, 15 mg of sample was added to a 90 mL methanol/water PCBs solution. The initial concentration of each of the six PCB congeners in the solution analytical standard was 10 μg/ml. The concentration of PCBs in the methanol/water solution was adjusted to 0.06 ppm. Before PCBs oxidation, the suspension (catalyst and PCBs) was magnetically stirred for 60 min in the dark at room temperature to achieve the photocatalyst surface’s adsorption/desorption equilibrium. Afterward, the suspension was exposed to a UV lamp (365 nm, 100 W) under proper stirring to ensure uniform sample exposure during the process. The distance between the UV source and the surface of the reaction vessel was 10 cm. The PCBs mineralization was monitored for 8 h by analyzing total organic carbon (TOC) in aliquots taken every 2 h, and the photocatalyst was filtered through a membrane (pore size 0.20 µm).
3. Results and discussion
3.1. Characterization
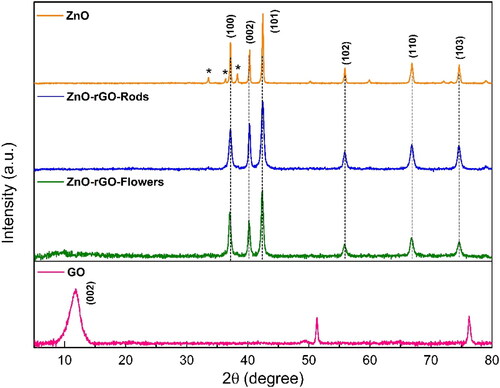
displays the XRD patterns of the ZnO nanoparticles and ZnO-rGO nanocomposites. The XRD pattern of the ZnO nanoparticles shows the major peaks at 2ϴ = 37.2°, 40.3°, 42.4°, 55.9°, 66.9°, and 74.6°, corresponding to the reflection from (100), (002), (101), (102), (110) and (103) crystal planes indexed to the ZnO phase (JCPDS Card no. 36-1451) and which are indicators of a hexagonal phase wurtzite structure. In addition, small peaks (*) observed at 2ϴ = 33.5°, 36.3°, and 38.3° can be indexed to the ZnO phase (JCPDS Card no. 21-1486). The low intensity of these latter peaks indicates the low percentage of this ZnO phase in the prepared sample [Citation32]. The ZnO-rGO nanocomposites corresponding XRD patterns were very similar, appearing with the same significant ZnO peaks assigned to the ZnO hexagonal wurtzite phase reported but inhibiting the formation of the ZnO phase given in the JCPDS Card no. 21-1486. Note clear XRD peaks broadening of the ZnO-rGO nanocomposites compared to those of the ZnO nanoparticles, indicative of smaller crystal sizes. Also, peaks corresponding to rGO are not detectable because the intensities of the sharp ZnO peaks are incomparably higher than the small semi-amorphous rGO peaks. Besides, maybe rGO is sufficiently dispersed in the composite material surface, which effectively inhibited the accumulation of rGO sheets and further expanded the d002 spacing [Citation28,Citation33,Citation34]. Finally, the characteristic peak at 2ϴ = 11.58° corresponds to (002) crystalline reference plane of GO with an interplanar distance of 8.87 Å.
Figure 3. XRD patterns of ZnO nanoparticles and ZnO-rGO nanocomposites.
The average crystallite sizes (D) of ZnO and ZnO-rGO materials were calculated by the Debye Scherrer’s EquationEquation (1)(1)
(1) and Williamson-Hall method using the Uniform Deformation Stress Model (UDSM) (2). The (101) crystal plane shows the most substantial diffraction peak for all samples, indicating that the formed ZnO nanocrystals have a preferential crystallographic (101) orientation. Therefore, the width peak (101) was used in the Debye – Scherrer equation.
(1)
(1)
(2)
(2)
where λ is the wavelength of the X-ray radiation (1.7903 Å), K is a constant taken as 0.89, θ is the diffraction angle, β is the full width at half maximum, σ is the stress of the crystal and Y_hkl is Young’s modulus. The average size of the synthesized materials is presented in . The crystallite size is assumed to be the size of a coherently diffracting domain and is not necessarily the same as particle size [Citation35].
Table 1. Average crystalline sizes of the ZnO and ZnO-rGO materials.
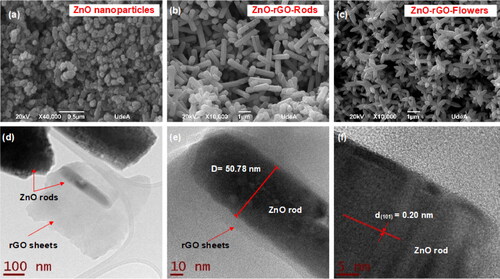
The morphologies of synthesized materials were analyzed by SEM and TEM (). ZnO nanoparticles were successfully obtained with an average particle size of 108 nm and roughly spherical. For the nanocomposites, well-defined ZnO nanostructures of rods and flowers were obtained, and rGO sheets were fully covered. Rod-shaped ZnO nanoparticles deposited on rGO flakes had an average length of 2.60 µm and an average diameter of 511 nm. On the other hand, ZnO petals in ZnO-rGO-Flowers resulted from a configuration of several sharp-pointed rods (8-10) deposited on rGO flakes, with average length and diameter of the rods in this case of 0.86 µm and 361 nm, respectively. By TEM micrographs, the anchoring of a ZnO rod in rGO sheets can be observed. shows that the estimated d-spacing value between two adjacent lattice planes is 0.20 nm, and thus, it corresponds to (101) planes of hexagonal wurtzite ZnO.
Figure 4. SEM micrographs of (a) ZnO nanoparticles (b) ZnO-rGO-Rods and (c) ZnO-rGO-Flowers (d-f) TEM micrographs of ZnO-rGO-Rods.
EDS was used for the chemical characterization of all samples. EDS results confirmed the presence of zinc and oxygen elements for ZnO nanoparticles and zinc, oxygen, and carbon elements for the nanocomposites, carbon, and oxygen for GO, and the absence of any impurity in the materials. shows the atomic percentage of different elements in ZnO nanoparticles and ZnO-rGO nanocomposites. ZnO-rGO-Flowers’ atomic percentage is much higher due to the lower coverage of ZnO flowers in the rGO sheets since a lower concentration of the zinc precursor (15 mM) was used. In ZnO-rGO-Rods, the percentage of carbon is lower, and the portion of zinc increases.
Table 2. Chemical composition of ZnO and ZnO-rGO materials.
We have previously addressed the spectroscopic characterization (FTIR, Raman, XPS) of our composites under study (Supplementary Information), and the most representative results are summarized below. First, the decrease of superficial oxygenated species evidenced the reduction of GO in the composites during the synthesis and the domain of C = C species coupled with a ZnO-rGO interaction. The Raman analysis confirmed the presence of rGO and defects such as oxygen vacancies and zinc interstitials, which improve the photocatalytic performance of the ZnO-rGO composite materials [Citation36]. Finally, a detailed analysis by XPS revealed significant differences in the surface composition of the composites. ZnO-rGO-Rods showed a much lower number of oxygenated functional groups (i.e. C = O and C-O) than those of ZnO-rGO-Flowers (i.e. C–OH/Zn–OH, C = O), which must be linked with the ZnO-rGO chemical interaction.
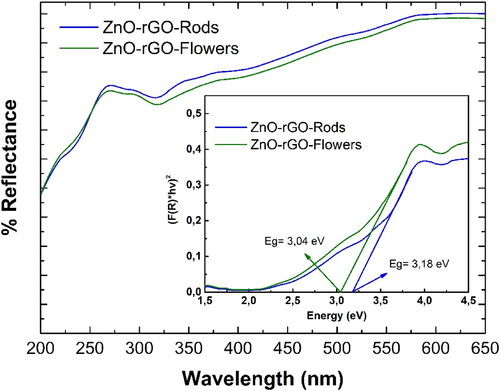
UV-DRS was further studied for the ZnO-rGO nanomaterials (), and the Kubelka-Munk (K-M) model was used to determine the bandgap based on EquationEquation (3)(3)
(3) .
(3)
(3)
where
denotes the K-M function, and R is the reflectance. A graph is plotted between
and
for the two nanocomposites, where the intercept gives the value of the energy bandgap (shown in the inset of ). The bandgap energy values decreased from 3.37 eV for ZnO [Citation37] to 3.04 eV and 3.18 eV for ZnO-rGO-Flowers and ZnO-rGO-Rods, respectively. This slight narrowing of the bandgap energies is due to an electronic coupling between rGO sheets and the ZnO particles.
Figure 5. UV-DRS spectra. Inset: vs.
plots for ZnO-rGO nanocomposites.
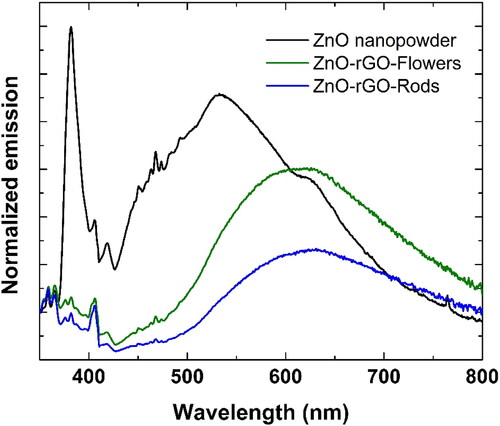
displays the photoluminescence (PL) spectra of ZnO-rGO-Flowers, ZnO-rGO-Rods, and a commercial sample of ZnO. The decrease in the photoluminescence emission of the nanocomposites can be understood as an indication of the suppression of recombination’s of electron-hole pairs in the ZnO due to the charge transfer to de rGO. It can be seen that the prepared nanocomposites showed a lower PL signal.
Figure 6. Photoluminescence spectra of ZnO nanopowder and ZnO-rGO nanocomposites.
3.2. Photocatalytic activity
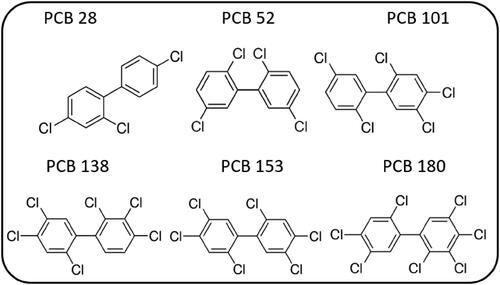
A standard solution of six PCB congeners was selected as a model of persistent organic compounds (POPs) to investigate the influence of rGO on photocatalytic activity. As shown in , the PCB mix consists of congeners with different degrees of chlorination: PCB 28, PCB 52, PCB 101, PCB 138, PCB 153, and PCB 180.
Figure 7. Scheme of molecular structures of PCBs mixtures with different degrees of chlorination.
The degradation process of the PCBs mixture using different photocatalysts was monitored through total organic carbon (TOC) analysis. The TOC removal efficiency (%) was determined using the following EquationEquation (3)(3)
(3) :
(3)
(3)
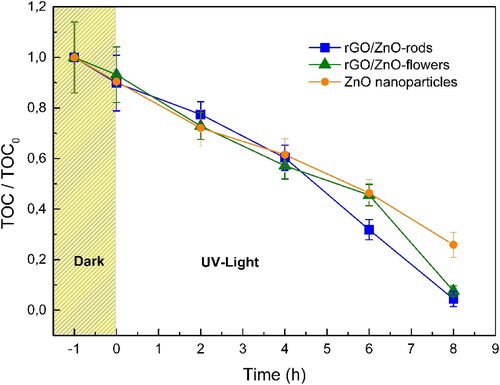
TOC0 and TOCt are the initial solution and the total organic carbon concentrations, respectively. All photocatalysts showed slight adsorption of PCBs (ca.10%). After 8 h of irradiation, degradations of PCBs of 74.1%, 92.4%, and 95.6% were achieved using ZnO nanoparticles, ZnO-rGO-Flowers, and ZnO-rGO-Rods, respectively, as shown in . These results revealed that the synthesized materials show excellent photocatalytic activity against PCB degradation. Furthermore, the notable coupling between ZnO and rGO sheets improved ZnO’s photocatalytic performance by generating more reactive species than ZnO alone. On the other hand, no significant changes were observed in the degradation profiles due to the difference in the morphology of the ZnO particles (i.e. rods and flowers) in the nanocomposites. Note that the complete mineralization of PCBs is rarely reported, which implies long irradiation times. In this way, we demonstrate that using nano-photocatalysts, such as ZnO-rGO nanocomposites, is a promising strategy for eliminating PCBs, with high removal percentages (>90%) and under experimental conditions that are simple and easily scalable.
Figure 8. TOC profiles for PCBs degradation using (a) ZnO nanoparticles and (b) ZnO-rGO-Flowers and ZnO-rGO-Rods nanocomposites.
summarizes the previous investigations that have reported PCB removal using different photocatalysts and under various experimental conditions. As can be seen, pure TiO2 and modified TiO2 are the most common photocatalysts for PCBs degradation. On the other hand, although most PCBs accumulate in the soil, there are many investigations in the aqueous phase due to the easy availability on a laboratory scale and the difficulty of obtaining quickly and well-characterized samples of sediments contaminated with PCBs. Finally, the most used light source was UV irradiation without reporting the degree of mineralization.
Table 3. Overview of photocatalysis investigations for degradation of PCBs.
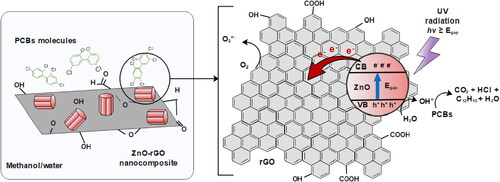
A reaction path was proposed for the photocatalytic degradation of PCBs, . The PCBs molecules can be effectively adsorbed at the surface of ZnO-rGO due to π-π, Van der Waals, electrostatic interactions, and the potential OH bonding formation with chlorine atoms. A ZnO-rGO nanocomposite can become an active photocatalyst when the electrons in its valence band (VB) are photoexcited into its vacant conduction band (CB) by absorption of incident high-energy photons, larger than its corresponding band gap energy (i.e. 3.04 and 3.18 eV). The photoinduced electrons in the CB can rapidly migrate to the surface and initiate the reduction reactions. In contrast, the holes in the VB can quickly migrate to the surface and participate in oxidation reactions [Citation46]. The e-/h+ pair reacts with O2 and HO¯, respectively, to form O2•- and HO•. It is believed that the dominant removal pathway of PCBs from the methanol/water solution is the reaction with hydroxyl radicals (HO•) [Citation47]. OH radicals are the most potent environmental oxidants and are widely reported as the main initiator for removing organic compounds in aqueous solutions [Citation48,Citation49]. There are several pathways for PCBs degradation; however, reductive dichlorination has been identified as the primary step to their mineralization [Citation50–52]. The chlorine atom would be abstracted in a homolytic bond cleavage, forming HCl and an aryl radical. The intermediate aryl radical would then react with a second H to terminate the process. Dichlorination will stop once all chlorine atoms have been removed, leaving biphenyl as the final product for the degradation mechanism [Citation53]. First, the less chlorinated congeners (PCB 28, PCB 52, and PCB 101) are mineralized, leaving the congeners with the highest percentage of chlorination (PCB 138, PCB 152, and PCB 180) in the reaction medium, difficulting their degradation [Citation38]. Finally, the desorption of non-toxic or less toxic products from the photocatalyst surface occurs. It could be concluded that with the presence of HO-/HO•, the adsorbed PCBs undergo dichlorination via electrophilic substitution and a bond breaking of the aromatic ring [Citation43].
Figure 9. Proposed photocatalytic mechanism of the ZnO-rGO nanocomposites for PCBs degradation.
4. Conclusions
We successfully prepared reduced graphene oxide reinforced with zinc oxide (ZnO-rGO) by a simple microwave-assisted hydrothermal route. The concentration of the zinc precursor adjusted the ZnO morphology shown in the nanocomposites. rGO played an essential role in supporting ZnO-rGO-Rods, and ZnO-rGO-Flowers leading to a high PCBs mineralization (>90%) compared to that of ZnO nanoparticles (74%). Furthermore, no significant reduction in the ZnO bandgap was detected after its coupling with the rGO, implying minimal interaction between the two entities. Furthermore, the PCBs degradation was not dependent on the nanocomposite’s size and morphology, which can be explained in terms of the same amount and nature of active sites in ZnO rods and flowers.
Supplemental Material
Download MS Word (2.3 MB)Disclosure statement
The authors declare no competing financial interest.
Additional information
Funding
Notes on contributors
Aura S. Merlano
Aura S. Merlano is a professor in basic science center at the Universidad Pontificia Bolivariana, Medellín, Colombia. She obtained her PhD in the area of optics and spectroscopy. Her research focuses on development of nanomaterials for applications in photocatalysis and wastewater treatment. Other areas of research include optical and electronic properties of nanomaterials from first principles calculations.
Elim Albiter
Elim Albiter received his B.S., M.S. and Ph.D. in Chemical Engineering from “Instituto Politécnico Nacional” (IPN), México. His research interests include hydrogen production using heterogeneous photocatalysis, photocatalytic reduction of CO2, fine chemical synthesis, photopolymerization, and the development of new nano-catalysts.
Miguel A. Valenzuela
Miguel A. Valenzuela received his B.S. and M.S. in chemical engineering from the National Polytechnic Institute (IPN), México, and his Ph.D. in Chemistry from the Metropolitan Autonomous University (UAM-I), México. His current research interests include semiconductor photocatalysis, hydrogen production, CO2 reduction to hydrocarbon fuels, organic synthesis, biomass conversion, and so on.
Lina M. Hoyos
Lina M. Hoyos is a professor at the Universidad Pontificia Bolivariana. Her research is in the area of nanotechnology, materials and medical engineering. Other areas of research include polymeric materials synthesis, carbon-based nanomaterials applications, and electrospinning, chemical vapor deposition and sol-gel techniques.
Ángel Salazar
Ángel Salazar is a titular professor at the Universidad Pontificia Bolivariana in Medellín, Colombia. His research focuses in linear and non-linear optical properties nanomaterials as well as plasmonics in graphene and carbon nanotubes.
References
- Prasad C, et al. An overview of graphene oxide supported semiconductors based photocatalysts: properties, synthesis and photocatalytic applications. J Mol Liq. 2020;297:111826.
- Albiter E, Merlano AS, Rojas E, et al. Synthesis, characterization, and photocatalytic performance of ZnO – graphene nanocomposites : a review. J Compos Sci. 2021;5(4):1–40.
- Lee KM, Lai CW, Ngai KS, et al. Recent developments of zinc oxide based photocatalyst in water treatment technology: a review. Water Res. 2016;88:428–448.
- Raizada P, Sudhaik A, Singh P. Photocatalytic water decontamination using graphene and ZnO coupled photocatalysts: a review. Mater Sci Energy Technol. 2019;2(3):509–525.
- El A, Fendrich M, Bazzanella N, et al. Wastewater remediation with ZnO photocatalysts : green synthesis and solar concentration as an economically and environmentally viable route to application. J Environ Manage. 2021;286(February):112226.
- He Y, Wang Y, Zhang L, et al. High-efficiency conversion of CO2 to fuel over ZnO/g-C3N4 photocatalyst. Appl Catal B Environ. 2015;168–169:1–8.
- Li X, Wang J, Zhang J, et al. Cadmium sulfide modified zinc oxide heterojunction harvesting ultrasonic mechanical energy for efficient decomposition of dye wastewater. J Colloid Interface Sci. 2022;607:412–422.
- Zheng S, Li X, Zhang J, et al. One-step preparation of MoOx/ZnS/ZnO composite and its excellent performance in piezocatalytic degradation of rhodamine B under ultrasonic vibration. J Environ Sci (China). 2023 Mar;125:1–13.
- Pandey N, Shukla SK, Singh NB. Water purification by polymer nanocomposites: an overview. Nanocomposites. 2017;3(2):47–66.
- Alqarni SA. Deliberated system of ternary core–shell polythiophene/ZnO/MWCNTs and polythiophene/ZnO/ox-MWCNTs nanocomposites for brilliant green dye removal from aqueous solutions. Nanocomposites. 2022;8(1):47–63.
- Wojnarowicz J, Chudoba T, Lojkowski W. A Review of microwave synthesis of zinc oxide nanomaterials: reactants, process parameters and morphologies. Nanomaterials. 2020;10:1086.
- Samadi M, Zirak M, Naseri A, et al. Design and tailoring of one-dimensional ZnO nanomaterials for photocatalytic degradation of organic dyes: a review. Res Chem Intermed. 2019;45(4):2197–2254.
- Das A, S.k N, Nair RG. Influence of surface morphology on photocatalytic performance of zinc oxide: a review. Nano-Struct Nano-Objects. 2019;19:100353.
- Munawar A, Akram MS, Javed MT, et al. Polychlorinated biphenyls (PCBs): characteristics, toxicity, phytoremediation, and use of transgenic plants for PCBs degradation. In: Hasanuzzaman M, Prasad MNV, editors. Handbook of bioremediation. Bangladesh and India: Elsevier Inc., 2021. pp. 677–687.
- United States Environmental Protection Agency. Polychlorinated biphenyls (PCBs). https://www.epa.gov/pcbs
- Shaban YA, El Sayed MA, El Maradny AA, et al. Photocatalytic removal of polychlorinated biphenyls (PCBs) using carbon-modified titanium oxide nanoparticles. Appl Surf Sci. 2016;365(August):108–113.
- Zheng C, Zhao L, Zhou X, et al. Treatment Technologies for organic wastewater. In: Elshorbagy W, Chowdhury RK, editors. Water treatment. United Arab Emirates; 2013. p. 38.
- OHA. Polychlorinated biphenyls (PCBs) and drinking water. 2015.
- Ministerio de Ambiente y Desarrollo Sostenible de Colombia. Generalidades y conceptos básicos sobre bifenilos policlorados – PCB. In: Manual Para la Gestión Integral de Bifenilos Policlorados - PCB, no. 1, 2015, p. 48.
- Kim K, Son SH, Kim KS, et al. Environmental effects of supercritical water oxidation (SCWO) process for treating transformer oil contaminated with polychlorinated biphenyls (PCBs). Chem Eng J. 2010;165(1):170–174.
- Jing R, Fusi S, Kjellerup BV. Remediation of polychlorinated biphenyls (PCBs) in contaminated soils and sediment: state of knowledge and perspectives. Front Environ Sci. 2018;6:1–17.
- Passatore L, Rossetti S, Juwarkar AA, et al. Phytoremediation and bioremediation of polychlorinated biphenyls (PCBs): state of knowledge and research perspectives. J Hazard Mater. 2014;278:189–202.
- Bako CM, Mattes TE, Marek RF, et al. Biodegradation of PCB congeners by Paraburkholderia xenovorans LB400 in presence and absence of sediment during lab bioreactor experiments. Environ Pollut. 2021;271:116364.
- Sadañoski MA, et al. Evaluation of bioremediation strategies for treating recalcitrant halo-organic pollutants in soil environments. Ecotoxicol Environ Saf. 2020;202:110929.
- Kim K, Kim K, Son SH, et al. Supercritical water oxidation of transformer oil contaminated with PCBs - a road to commercial plant from bench-scale facility. J Supercrit Fluids. 2011;58(1):121–130.
- Cerasa M, et al. Validation studies on activated carbon fiber passive sampler for PCDD/Fs and PCBs in water. Chemosphere. 2020;239:124666.
- Gomez-Eyles JL, Ghosh U. Enhanced biochars can match activated carbon performance in sediments with high native bioavailability and low final porewater PCB concentrations. Chemosphere. 2018;203:179–187.
- Merlano AS, Hoyos LM, Gutiérrez GJ, et al. Effect of Zn precursor concentration in the synthesis of rGO/ZnO composites and their photocatalytic activity. New J Chem. 2020;44(45):19858–19867.
- Merlano AS, Salazar Á. A facile microwave-assisted synthesis of ZnO nanoparticles and their photocatalytic activity : effect of pH. BISTUA Rev Facultad Cienc Básicas. 2020;18(2):3–8.
- Gómez I, Mejía E, Cabanzo R. Synthesis of graphene oxide and chemically reduced graphene nanosheets. Rev Colomb Mater. 2013;5:177–184.
- Marcano DC, Kosynkin DV, Berlin JM, et al. Improved synthesis of graphene oxide. ACS Nano. 2010;4(8):4806–4814.
- Rashidi H, Ahmadpour A, Bamoharram FF, et al. Controllable one-step synthesis of ZnO nanostructures using molybdophosphoric acid. Chem Pap. 2014;68(4):516–524.
- Meti S, Rahman MR, Ahmad MI, et al. Chemical free synthesis of graphene oxide in the preparation of reduced graphene oxide-zinc oxide nanocomposite with improved photocatalytic properties. Appl Surf Sci. 2018;451:67–75.
- Ding J, Zhu S, Zhu T, et al. Hydrothermal synthesis of zinc oxide-reduced graphene oxide nanocomposites for an electrochemical hydrazine sensor. RSC Adv. 2015;5:22935–22942.
- Bindu P, Thomas S. Estimation of lattice strain in ZnO nanoparticles: X -ray peak profile analysis. J Theor Appl Phys. 2014;8(4):123–134.
- Diallo A, Ngom BD, Park E, et al. Green synthesis of ZnO nanoparticles by aspalathus linearis: structural & optical properties. J Alloys Compd. 2015;646(January):425–430.
- Katiyar RS, Samanta K. Structural and optical properties of Zn1-xCuxO thin films. In: Feng ZC, editor. Handbook of zinc oxide and related materials: volume one, materials. Vol. 1; Boca Raton: CRC Press; 2012. p. 351–372.
- Hernández RFG. Eficiencia de sistemas avanzados de oxidación acoplados para la degradación de bifenilos policlorados. 2012.
- Zhu X, Wang Y, Qin W, et al. Distribution of free radicals and intermediates during the photodegradation of polychlorinated biphenyls strongly affected by cosolvents and TiO2 catalyst. Chemosphere. 2016;144:628–634.
- Lin Y, Gupta G, Baker J. Photodegradation of aroclor 1254 using simulated sunlight and various sensitizers. Bull Environ Contam Toxicol. 1996;56(4):566–570.
- Zhou Z, Zhang Y, Wang H, et al. The comparative photodegradation activities of pentachlorophenol (PCP) and polychlorinated biphenyls (PCBs) using UV alone and TiO2-derived photocatalysts in methanol soil washing solution. PLoS One. 2014;9(9):1–8.
- Almeida P G, Fernández L, Castro R, et al. Degradación fotocatalítica de aroclor 1254 utilizando dióxido de titanio irradiado con haz de electrones acelerados. Infoanalítica. 2019;7(2):111–124.
- Nadarajan R, Bakar WAWA, Ali R, et al. Method for polychlorinated biphenyls removal from mussels and its photocatalytic dechlorination. Appl Catal B Environ. 2017;218:327–337.
- Huang Q, Hong CS. TiO2 photocatalytic degradation of PCBs in soil-water systems containing fluoro surfactant. Chemosphere. 2000;41(6):871–879.
- Dasary SSR, Saloni J, Fletcher A, et al. Photodegradation of selected PCBs in the presence of Nano-TiO2 as catalyst and H2O2 as an oxidant. Int J Environ Res Public Health. 2010;7(11):3987–4001.
- Li X, Yu J, Jaroniec M, et al. Cocatalysts for selective photoreduction of CO2 into solar fuels. Chem Rev. 2019;119(6):3962–4179.
- Xin ML, Yang JW, Li Y. The mechanism for enhanced oxidation degradation of dioxin-like PCBs (PCB-77) in the atmosphere by the solvation effect. Chem Cent J. 2017;11(1):1–14.
- Herrmann JM. Heterogeneous photocatalysis: fundamentals and applications to the removal of various types of aqueous pollutants. Catal Today. 1999;53(1):115–129.
- Sedlak DL, Andren AW. Aqueous-phase oxidation of polychlorinated biphenyls by hydroxyl radicals. Environ Sci Technol. 1991;25(8):1419–1427.
- Huang C, Zeng Y, Luo X, et al. Comprehensive exploration of the ultraviolet degradation of polychlorinated biphenyls in different media. Sci Total Environ. 2021;755:142590.
- Sun Y, Liu X, Kainuma M, et al. Dechlorination of polychlorinated biphenyls by iron and its oxides. Chemosphere. 2015;137:78986.
- Sun Y, Takaoka M, Takeda N, et al. Decomposition of 2,2’,4,4’,5,5’-hexachlorobiphenyl with iron supported on an activated carbon from an ion-exchange resin. Chemosphere. 2012;88(7):895–902.
- DeVor R, Carvalho-Knighton K, Aitken B, et al. Mechanism of the degradation of individual PCB congeners using mechanically alloyed Mg/Pd in methanol. Chemosphere. 2009;76(6):761–766.