
 ?Mathematical formulae have been encoded as MathML and are displayed in this HTML version using MathJax in order to improve their display. Uncheck the box to turn MathJax off. This feature requires Javascript. Click on a formula to zoom.
Abstract
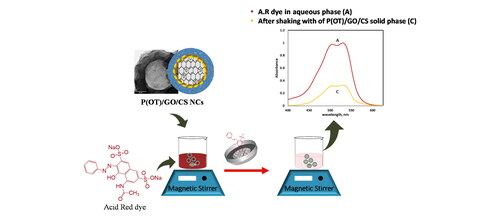
This article describes an easy and simple method to remove a toxic Acid Red dye from aqueous solution. Ternary poly(O-toluidine)/graphene oxide/chitosan P(OT)/GO/CS nanocomposites (NCs) were fabricated by an oxidative polymerization technique to remove Acid Red (A.R.) dye from aqueous solutions using solid-phase extraction. The P(OT)/GO/CS NCs exhibit a metal sieve-like structure consisting of GO nanosheets and a core shell-shell porous structure, which provides several adsorption sites and channels for the transport of dye molecules. FTIR, XRD, RAMAN, TEM, SEM, BET, and TGA-DTG investigations were carried out on NCs. To investigate the removal effectiveness of the NCs using adsorbent dose, pH and solution temperature, shaking time, and ionic strength. Experimental adsorption findings, utilizing 15 mg of solid-phase NCs, can remove the majority of the A.R. dye in 75 min at pH 2.0 with an adsorption efficiency and an adsorption capacity of 99.6% and 169.5 mg/g, respectively. The pseudo-second-order kinetic model best captures the adsorption process of A.R. dye on the NC solid phase, according to experimental data. Thermodynamically, the removal process was endothermic, spontaneous, and associated with increasing randomness. Finally, NCs were tested by removing A.R. dye from real samples. NCs removed A.R. dye from aqueous solutions for four cycles.
Graphical Abstract
1. Introduction
Water contamination is increasingly a priority, and industrialization and wastewater generation have caused several aquatic concerns [Citation1]. Paper, leather, textile, plastic, medicines, food, and cosmetics industries employ synthetic dyes, which create highly colored wastewater [Citation2–4]. Synthetic dyes with an azo group (N = N) can cause cancer, mutagenesis, and aesthetic issues [Citation5–7]. Toxic, nondegradable dyes harm humans, animals, and the environment [Citation8]. It is visible in water at concentrations as low as 1 ppm [Citation2]. Moreover, azo dyes can create issues with oxygen solubility in water sources and can disrupt photosynthesis even at low concentrations [Citation9, Citation10]. Approximately 10–15% of the colors produced during the dying process are discharged into the sewage [Citation11–13]. Untreated colored wastewater pollutes water sources, making its removal from solutions crucial. Traditional wastewater dye removal methods are less effective [Citation14]. Treatment of colored wastewater has included the use of physical and chemical processes such as coagulation and flocculation, adsorption, photocatalytic processes, advanced oxidation precipitation, electrochemical techniques, and biological treatments [Citation14–16]. In comparison to the other methods, adsorption is widely adopted because of its efficiency, operational method, and simple and cost-effective preparation processes [Citation5, Citation17–20].
Many different polymer NC adsorbents have been tested for this purpose, resulting in enhanced surface area, processability, tunable properties, cost-effectiveness, and stability[AQ]. Fast decontamination capabilities along with high selectivity for removing different contaminants were both shown by the polymer NCs [Citation21].
GO nanoparticles (NPs) have a stronger aptitude for adsorbing a variety of dye molecules owing to (π–π) stacking interactions. This is because the two-dimensional structure of GO NPs is conjugated, which gives them a two-dimensional structure [Citation22–27]. Recently, owing to their eco-friendliness, ease of modification, nontoxicity, biodegradability, and broad range of applications, natural polymer adsorbents such as chitosan (CS), cellulose (CE), starch (ST), and lignin have garnered more attention [Citation28–31]. Functional groups can be easily added to the skeleton to improve the adsorption of target pollutants such as metal ions and dyes through chelating effects, hydrogen bonding, and electrostatic interactions [Citation32–34]. Modern hybrids of materials containing conducting polymers (poly-aniline, poly o-toluidine, polypyrrole, poly thiophene, and poly o-anisidine) are of enormous practical significance because they may be used to create composite materials by adding organic moieties to inorganic NPs of different shapes and sizes. For adsorption and ion exchange, numerous nanocomposite materials with conducting polymer coatings have been reported [Citation35].
Alqarni synthesized two different types of ternary NCs by combining polythiophene (PTh), multiwalled carbon nanotubes (MWCNTs), zinc oxide (ZnO), and oxidized multiwalled carbon nanotubes (OXMWCNTs) using in situ chemical polymerization. Using both (PTh-ZnO-MWCNTs) and (PTh-ZnO-OXMWCNTs) NCs to remove brilliant green (B.G.) dye from water shows excellent results. For PTh-ZnO-OXMWCNTs, 9.1 mg g−1 had the greatest adsorption capacity, whereas for PTh-ZnO-MWCNTs, it was 8.3 mg g−1. This finding demonstrates that oxidation of MWCNTs improves the adsorption capacity of the NCs by the addition of more carboxylic (–COOH) groups to the surface of the MWCNTs [Citation36]. Beads of ZnO NPs impregnated with chitosan (CS@ZnO) NCs have been prepared by Raval and colleagues by mechanical stirring as well as microwave-assisted techniques and used for Eriochrome Black-T dye removal [Citation37]. Adsorption capabilities for dye removal from a solution with a multipollutant were highest for the CS@ZnO beads synthesized by microwave-assisted techniques, reaching up to 71%. This work depends on the simple synthesis and incorporation of NPs of metal-oxide in biopolymers to provide the CS with a high capacity for adsorption, a specific surface area, and a mechanical strength to remove dye molecules from textile effluent. In the current study, natural polymer adsorbents have required functional groups (cellulose with abundant hydroxyl groups, chitosan with abundant amino and hydroxyl groups [Citation38] and a hydroxyl group in starch [Citation39] are used as functional entities for the generation of NCs to remove targeted dyes through electrostatic interaction. The GO sheet used to enhance the adsorption capacity of NCs via negative charges from different functional groupings with plenty of oxygen, such as hydroxyl, carbonyl, epoxy, and carboxyl groups, permits additional vigorous electrostatic interactions with cationic dye molecules [Citation27, Citation40, Citation41]. In addition, when GO is incorporated with polymers, it helps to improve the properties of NCs, which include a large surface area, efficient electron transport, a two-dimensional structure, chemical stability, and the capacity to encourage negative charge accumulation on surfaces [Citation42]. OT is used here as the matrix phase. These polymers have a large surface area, are ductile, malleable, and have good mechanical strength [Citation43], in addition to peculiar functional groups (–NH) and remarkable electrical characteristics [Citation44] that improve their organic pollutant removal. Thus, this study describes the modification of NCs with OT by its ease of synthesis, low cost, excellent environmental stability, and ability to avoid aggregation of components [Citation45].
An oxidative polymerization technique was applied for the fabrication of ternary P(OT)/GO/CS, P(OT)/GO/SE, and P(OT)/GO/ST NCs. The biggest advantage was that the NCs exhibit a metal sieve-like structure consisting of GO nanosheets and a core-shell-shell porous structure, which provides several adsorption sites and channels for transport of dye molecules. They are predicted to make surface groups on NCs readily available as adsorption sites for pollutants and allow functional NCs to interact with contaminants in water. It was used to adsorb Acid Red dye from water. On the basis of many factors, including pH, adsorbent dose, dye concentration, and time, we assessed the dye’s adsorptive ability. Additionally, the findings were compared to previously published literature and connected with kinetic and isotherm models.
2. Experimental
2.1. Chemicals
O-toluidine (OT) was supplied by Shanghai Chemical Reagent Co. (China). Ammonium persulfate (APS) was supplied by Acros Organics Geel (Belgium). Acid Red (A.R.) dye, (chitosan, low molecular weight, 50,000–190,000 Da), (cellulose, microcrystalline, powder), (starch, amylose molecular form, soluble), hydrochloric acid (HCl), phosphoric acid (H3PO4) and acetic acid (CH3COOH) were obtained from Sigma–Aldrich (USA). XFNANO Advanced Materials Supplier Inc. (China), supplied the graphene. None of the chemicals or solvents employed were purified more than necessary; they were all of analytical reagent quality.
2.2. Instrumentation
High-resolution transmission electron microscopy (HR-TEM; JEM-2100; 25× magnification and 200 kV) and field emission scanning electron microscopy (SEM Model Quanta 250 FEG; 30 kV accelerating voltage at 14× magnification and up to 1,000,000 resolution for Gun.1n) were used to assess the morphologies of the materials under study. To obtain essential structural and crystallographic information about the NCs, X-ray diffraction (XRD) of the NC crystallinity was also examined. The analysis was carried out with a Bruker Model D8 [including reflectometry, high-resolution diffraction, in-plane grazing incidence diffraction (IP-GID), small-angle X-ray scattering (SAXS), and residual stress and texture investigations] with CuKα radiation (1.5418 Å, Madison, WI, USA) working at a current of 30 mA, voltage of 40 kV and step scan of 0.02°. However, the samples must be prepared before measurement, and sample milling using a simple planetary ball mill (LZQM0.4L, Shicheng Oasis Mineral Equipment Manufacturing Co., Ltd.) in which a ball mill of stainless steel with a 0.1 cm diameter was placed in a milling dram with samples for 30 min at 2500 rpm. To establish the thermal stability of the NC materials and to specify their degradation temperature, thermogravimetric analysis (TGA) and DTG tests were utilized. The analysis was performed on TGA-50 systems at a heating rate of 10 °C/min in air. Fourier transform infrared (FTIR) spectra were recorded and analyzed to determine the sample’s functional groupings, and a Shimadzu spectrometer was utilized in the range of 4000–400 cm−1. The materials were analyzed using a Raman spectrometer to acquire Raman readings. (Lab. RAM-HR Evolution Horiba Co.) with a single visible spectrometer equipped with an air-cooled open electrode 1024 × 256 pixel CCD detector, a 532 nm He-Cd laser with an 1800 grating (450–850 nm) and a 10% ND filter using an acquisition time of 5 s, 5 accumulations without spike filter and delay time, and a 100× objective. The specific surface area (SBET) of Quantachrome’s NOVA touch LX2 model, NT2LX-2, USA, was calculated using the BET technique. The statistics on absorption. The pore volumes and pore-size distributions were obtained from nitrogen sorption isotherms using the Dubinin-Astakhov (DA) method. The samples were degassed in a vacuum for at least three h at 150 °C before measurement. The Stokes-Einstein equation uses the angular intensity distribution to calculate the particle size. This study used a Perkin-Elmer UV–visible (190–1100 nm) spectrophotometer (model Lambda 25, USA) with a 10 mm (path width) quartz cell to capture all spectrophotometric readings. A digital micropipette (Volac) was used to prepare standard Brilliant Green dye, and an Orion pH meter (model EA 940) was used to measure the pH of the test solutions. Milli-Q Plus system (Millipore, Bedford, MA, USA) deionized water was utilized for solution preparation.
2.3. Synthesis of GO
GO was created using a modified version of Hummers’ method following the procedure described in [Citation46].
2.4. Synthesis of P(OT)/GO/CS NCs
In situ polymerization was utilized to prepare the NCs of P(OT)/GO/CS. GO NPs were introduced into hydrochloric acid (100 mL, 1 M). The solution [designated solution A] was sonicated for one h. APS (5 g) was added to HCl (100 mL, 1 M) [designated solution B]. A dispersion (solution designated C) was obtained by dissolving CS (0.5 g) in acetic acid (4%) in a 250 mL (three-neck flask) for 1 h while constantly stirring.
The temperatures of solutions A, B, and C were lowered to 0–4 °C in an ice bath. Dropwise additions of solution A were added into solution (C) over the course of approximately 30 min while stirring continuously between 0 and 4 °C in a nitrogen atmosphere. The procedure for polymerization included adding OT (doubly distilled, 1.07 mL) and stirring continuously for 30 min, followed by adding solution B dropwise into the aforementioned mixture for approximately 30 min while stirring continuously between 0 and 4 °C in a nitrogen atmosphere. For 24 h, the polymerization process was stirred continuously at 0–4 °C in a nitrogen environment. The resulting black precipitate was extracted using ultracentrifugation, and the filtrate was washed in deionized water until it was clear. The obtained black fine powder was dried for 24 h at 60 °C.
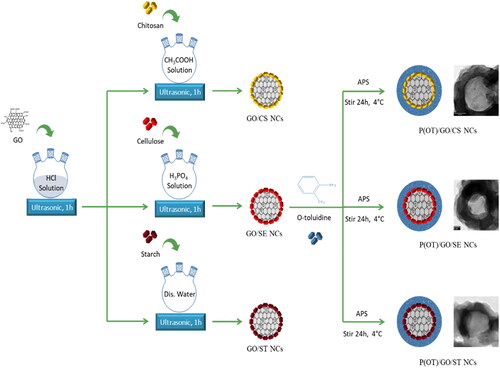
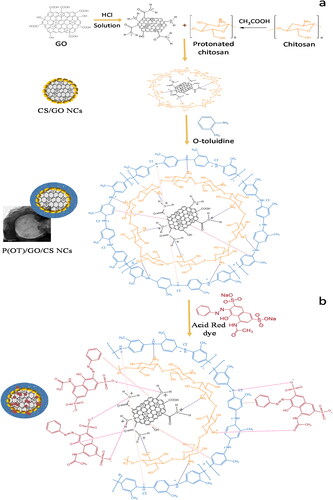
The ternary P(OT)/GO/SE NCs and P(OT)/GO/ST NCs were synthesized in the same procedure as the ternary P(OT)/GO/CS NCs, except solution C in the ternary P(OT)/GO/SE NCs was prepared by adding 0.5 g of SE to a three-neck flask (250 mL) and swirling vigorously for 1 h to adequately dissolve it in 83% phosphoric acid to create a dispersion. For P(OT)/GO/ST NCs, 0.5 g of ST was poured into a 250-mL (three-neck flask), adequately dissolved in distilled water and vigorously mixed for an hour to obtain an even distribution. The rest of the steps are the same as those described for the synthesis of P(OT)/GO/CS NCs. The method used to synthesize the three ternary NCs is presented in Scheme 1. For comparison purposes, pure P(OT) and P(OT)/GO NCs without GO/natural polymers and without natural polymers, respectively, were prepared using the same in situ polymerization process that was used to prepare the ternary P(OT)/GO/CS NCs.
Scheme 1. Illustration of the fabrication route of the ternary P(OT)/GO/CS, P(OT)/GO/SE, and P(OT)/GO/ST NCs.
2.5. Step of batch extraction
Dissolving 0.05 g of A.R. dye into 100 ml of deionized water yielded a stock solution (500 mg L−1) for later use. To create more dilute standard solutions, deionized water was used to dilute the stock solution (10–50 mg L−1). As an extraction medium, a variety of buffers of Bitton-Robinson (BR) with HCl concentration (0.1 mol L−1) at pH (2–11) were used in an A.R. dye sorption experiment by solid phase P(OT) ternary and P(OT)/GO/CS NCs. Accurately measured amounts (0.005 ± 0.0005 g) of P(OT) and P(OT)/GO/CS NCs as the solid phase were equilibrated in 50 mL of an aqueous solution including 20 mg L−1 A.R. dye at pH = 2. The sample solution was mechanically shaken for 120 min. Separating, the aqueous phase allowed us to determine the quantity of A.R. dye remaining in the aqueous phase spectrophotometrically by using a calibration curve and measuring the absorbance of the A.R. dye in aqueous solution at 530 nm before and after adsorption [Citation47] in the P(OT) and P(OT)/GO/CS NC solid phases. Finally, the following EquationEq. (1)(1)
(1) for the dye adsorption percentage (%E) and dye adsorption quantity (qt) per unit mass of P(OT) and P(OT)/GO/CS NCs were calculated using these relationships:
(1)
(1)
(2)
(2)
where (Co) is the initial concentration of dye, (Ct) is the final concentration of dye in the solution (mg L−1), the aqueous solution volume is (V, L), and the solid phase mass utilized is (m, g).
2.6. Environmental applications and sample collection
The effectiveness of the solid phases P(OT) and P(OT)/GO/CS NCs sorbent in the extraction and recovery of A.R. dye from the water of the Red Sea, waste, and tap was studied. The samples were taken from the Red Sea and the Membrane Bioreactor Technology Wastewater at King Abdulaziz University and the lab in the Department of Chemistry, King Abdulaziz University, at Jeddah City (KSA), respectively. After being filtered via a 0.45 m membrane, the samples were stored in Teflon bottles in a refrigerator at 5 °C. A 100 mL sample was modified to pH equal to 2 by using 0.1 mol L−1 HCl before being processed across the solid phases P(OT) and P(OT)/GO/CS NCs. Then, the recovered A.R. dye was measured spectrophotometrically.
3. Results and discussion
3.1. Characterization
Incorporating GO into branching reticular structures provides properties for depositing nanoscale layers of conducting polymers, for example, a relatively large area that increases NC adsorption. The adsorption of NCs is enhanced by the presence of natural polymers such as chitosan, cellulose, and starch, which provide a number of effective adsorption sites in the NCs. Scheme 1 shows the synthesis route of the P(OT)/GO/CS, P(OT)/GO/SE, and P(OT)/GO/ST ternary NCs.
3.1.1. XRD measurement
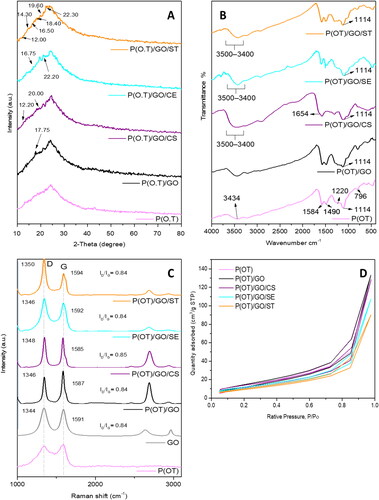
The XRD diffraction patterns for pure P(OT) and its NCs are shown in . The amorphous character of P(OT) is shown by the presence of a large peak between 2θ = 19° and 33°, resulting from component interactions. The literature suggests that periodicities running parallel and perpendicular to the polymer account for the primary diffraction peaks at 20° and 25° [Citation43, Citation44]. Binary P(OT)/GO NCs exhibit the wide diffraction peak of P(OT) in their diffraction patterns. Moreover, the peak at approximately 2θ = 17.75° confirms the presence of GO in the matrix of P(OT) [Citation48]. On the other hand, the patterns created by XRD for the P(OT)/GO/CS, P(OT)/GO/SE, and P(OT)/GO/ST ternary NCs had recognizable peaks in both P(OT) and GO in addition to the characteristic peaks of CS at 2θ = 20.00° and 12.20° corresponding to the CS characteristic peaks [Citation49], at 2θ = 16.75° and 22.20° [Citation50] of cellulose, and the starch exhibits diffraction peaks of 2θ = 12.00°, 14.30°, 16.50°, 18.40°, 19.60°, and 22.30° [Citation51]. The appearance of these peaks proved that all ternary compounds were produced. Moreover, it is noted that the greatest intensity peak has shifted, demonstrating that the grafted polymer differs from its parent polymer in terms of its physical and chemical characteristics.
Figure 1. XRD patterns (A), IR spectrum (B), Raman spectrum (C) and Isotherm curve (D) of P(OT) and its NCs.
3.1.2. FTIR spectra
The FTIR spectra of P(OT) and its NCs are shown in , which are consistent with earlier findings [Citation35] The N–H stretching vibration was responsible for the band at 3434 cm−1 seen in the spectra of P(OT), while the 1585 and 1490 cm−1 bands were assigned to stretching of C=C in a quinoid ring and C=N stretching in a benzenoid ring, respectively. The 1220 cm−1 band was produced by stretching vibrations of C–N in the benzenoid ring. Benzene ring C–H out-of-plane bending vibrations were responsible for the 797 cm−1 band seen in P. (OT). In a doped structure, the conductivity is enhanced by the high doping level, which causes the strongest peak to appear at approximately 1114 cm−1 [Citation52, Citation53]. The decreased peak intensities in the spectra of binary P(OT)/GO NCs show that the P(OT) chains interact with the GO surfaces [Citation54]. Doped P(OT) is responsible for the 1114 cm−1 peak, which is used to quantify electron delocalization [Citation55]. Thus, it is the electrical conductivity peak seen in P(OT). The presence of significant interactions between the conjugated structure of P(OT) and the π-bonded structure of GO is supported by the fact that the strength of the 1114 cm−1 peak increases and the peak is slightly shifted with the addition of GO [Citation56–58], The FTIR spectra of the P(OT)/GO/CS, P(OT)/GO/SE, and P(OT)/GO/ST ternary NCs had characteristic peaks of both P(OT) and GO in addition to the characteristic peaks of CS at 1654 cm−1 corresponding to the –NH bands in CS characteristic peaks [Citation59]. Bands of –NH2 spanning 3435–3500 cm−1 for P(OT) and the range of free –OH at 3500 cm−1 to SE have quite different characteristic bands [Citation60]. The starch exhibits (3432 cm−1) diffraction peaks, which are part of the O–H group’s (in the presence of H-band) characteristic broad band [Citation61]. The appearance of these peaks proved that all ternary compounds were produced. Moreover, the peaks of certain FTIR absorptions have moved to lower wavenumbers, whereas the peaks of other bands have moved to higher wavenumbers. These FTIR data indicated that the effective creation of NCs was the consequence of a combination of electrostatic forces and hydrogen bonding interactions.
3.1.3. Raman spectra
The existence of GO as well as P(OT) in the NCs was verified by Raman spectroscopy. shows the Raman spectra of P(OT) with its NCs. The NC Raman spectra show the distinctive peaks of both D and G of GO. The E2g mode of in-plane stretching is represented by the G band. Sp3-hybridized carbon atoms and other disorder-inducing factors are responsible for the D band [Citation62]. Peaks at 1346 and 1590 cm−1 in the P(OT) polymer are attributed to the (C–N+) stretching vibrations in the semiquinone radical state and quinoid ring C = C ring stretching vibration, respectively [Citation63]. At 1454 cm−1, the stretching vibration of C = N in a ring of quinoid [Citation64] was observed. The bending mode of N–H is located at 1400 cm−1 [Citation65]. The bands of both D and G in the Raman spectra are indicative of GO NPs, which are at approximately 1344 and 1591 cm−1, respectively. The P(OT)/GO NCs have a Raman spectrum with the same D and G peaks seen in GO NPs. When compared to GO NPs, the P(OT)/GO NC bands of D and G emerge at 1346 and 1587 cm−1, respectively, which is a minor shift. The ternary NCs of P(OT)/GO/CS, P(OT)/GO/SE and P(OT)/GO/ST Raman spectra showed both the G band and the D band. There is a noticeable shift in the G and D bands when compared to GO. This minor change can be the result of the polymer and GO interacting strongly [Citation66]. Additionally, the ternary NC curves showed an increase in the D bands, and the ratios of ID/IG of all ternary NCs (ID/IG = 0.85, 0.84, and 0.84 for P(OT)/GO/CS, P(OT)/GO/SE, and P(OT)/GO/ST NCs, respectively) are identical to the ID/IG ratio of GO (ID/IG = 0.84), demonstrating that the level of disorder in GO remains stable through chemical treatment [Citation67]. These findings proved the existence of the polymers P(OT), GO, and CS, SE, and ST in the ternary NCs.
3.1.4. BET
Pure P(OT) and its NCs have their BET surface area as well as volume determined, along with an isotherm. In , the isotherm curves are displayed. All samples showed (IV) isotherms which means they were all mesoporous adsorbents with unrestricted monolayer-multilayer adsorption. The results of BET analysis of all samples are shown in . According to the study results, adding GO to P(OT) caused a decrease in the P(OT) total surface area due to the GO NPs filling the pores of P(OT). On the other hand, the effect of the addition of natural polymers (CS, ES, and ST) on the BET surface area of P(OT)/GO was demonstrated. The BET surface area of ternary NCs of P(OT)/GO/CS, (OT)/GO/SE, and P(OT)/GO/ST showed total surface area decreases. The lower SBET and average total pore volume of ternary NCs with various natural polymers may be attributable to filler instability, which causes agglomeration of fillers inside the adsorbent pores and hence reduces the adsorbent’s adsorption capacity. In comparison to the other ternary NCs, P(OT)/GO/CS was shown to have the largest surface area and the largest average pore volume, measuring 44.2405 m2/g and 0.180873 cc/g, respectively.
Table 1. The SBET, total pore volumes, and average diameters of P(OT) pure, P(OT)/GO, P(OT)/GO/CS, (OT)/GO/SE, and P(OT)/GO/ST NCs.
3.1.5. Morphological study
displays SEM and TEM images of the samples. shows that P(OT) is similar to a lump structure with some smaller granular sizes, which reveals the irregular clustered morphology of the polymer. shows that the lump structure of P(OT) is evidently reduced due to conduction with GO, and the GO is covered by P(OT) to form a more compact composite with a micro/nanostructure. When CS is added to the binary polymer matrix (), the lump structure of P(OT) increases owing to P(OT) and CS electrostatic interactions first, which increases the lump structure after both polymer P(OT) and CS cover the GO to form a core–shell–shell structure. Due to their structure, ternary NCs have a larger surface area and can distribute nanomaterials more effectively. The ternary P(OT)/GO/SE NCs in show the same morphology as the ternary P(OT)/GO/CS NCs. displays the SEM image of P(OT)/GO/ST NCs as stronger aggregation, which may be caused by chains that form stronger interactions.
Figure 2. SEM images of P(OT) (A), P(OT)/GO NCs (B), P(OT)/GO/CS NCs (C), P(OT)/GO/SE NCs (D) and P(OT)/GO/ST NCs (E), and TEM images of P(OT) (F), P(OT)/GO NCs (G), P(OT)/GO/CS NCs (H), P(OT)/GO/SE NCs (I), and P(OT)/GO/ST NCs (J).
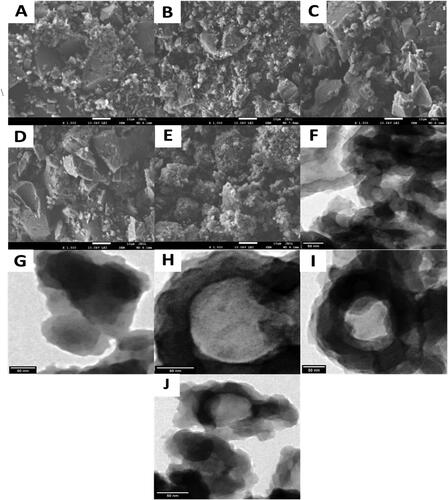
portrays the production of P(OT) with twisting and clustering of fibers into a weblike structure as opposed to a simple bundle. The dark areas show the multilayer P(OT), whereas the transparent regions, which are caused by nanostructure exfoliation, show low-density layers. However, the dark parts are more evident, showing that most layers of P(OT) are exfoliated. After adding GO (), the morphology of the binary P(OT)/GO NC particles primarily consisted of sheet-like structures. After the incorporation of CS, SE, and ST with GO in the P(OT) matrix in P(OT)/GO/CS NCs (), P(OT)/GO/SE NCs (), and P(OT)/GO/ST NCs (), the structure of ternary NCs was determined to be a hollow polymer, and GO was contacted in the center of the hollow polymer to produce a strainer-like structure. The hollow structure of the NCs is clearly visible with the thickness of the shell with a relatively uniform shape. This thickness may be attributed to a homogeneous layer of P(OT) coated on the surface of CS, SE, and ST.
3.1.6. Thermal stability
Thermogravimetric analysis was used to characterize the P(OT) and its NC samples, which allowed for the study of thermal stability in addition to weight loss of the manufactured materials (TGA-DTG). In , the TGA curves are shown. There are three major levels of disintegration visible in the TGA thermogram generated for P(OT). First, at lower temperatures (85 °C), H2O molecules are lost, and HCl is desorbed, resulting in a weight loss of approximately 15%. At 256 °C, a further 25% mass loss occurs, which may be attributable to the dissolution of lighter-weight P(OT). The thermal degradation of the chains of P(OT) is responsible for the ultimate loss of mass of 40% seen at greater temperatures (more than 444 °C). At 533 °C, we observed that P(OT) completely decomposed.
Figure 3. (A) TGA curves and (B) DTG curves for pure P(OT) and its NCs.
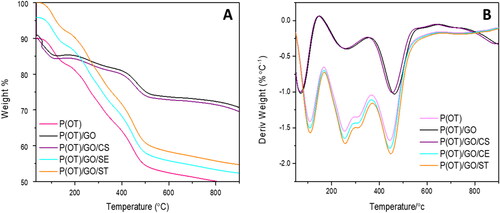
Ternary P(OT)/GO/SE and P(OT)/GO/ST NCs have been observed to exhibit comparable behavior; however, with the addition of GO/SE and GO/ST, respectively, the temperature of thermal degradation changed. The curves moved to higher temperatures, as shown in . There is a slight difference in the behavior of binary P(OT)/GO NCs and ternary P(OT)/GO/CS NCs, and there are primarily three levels of deterioration in the binary P(OT)/GO NCs. In the first level, desorption of HCl as well as loss of H2O molecules at lower temperatures (100 °C) results in a 10% weight loss. At 260 °C, there is a second mass loss of approximately 15%, probably as a result of the degradation of P(OT) at a lower temperature. The P(OT) chain thermal degradation is responsible for the ultimate mass loss of 25% seen at higher temperatures (above 465 °C). At 530 °C, it was shown to completely decompose. For ternary P(OT)/GO/CS NCs, a similar behavior was described, but with the curves shifting to lower temperatures.
The temperatures at which 10 and 25% of a substance’s mass is lost due to combustion are shown in as T10 and T25, respectively. The P(OT)/GO/CS ternary NCs have T10 and T25 values of 50 and 478 °C, respectively. P(OT)/GO/CS NCs had the highest residual mass retentions and thermal stabilities at high temperatures among the three ternary NCs. P(OT), GO, and CS may interact to provide increased stability.
Table 2. Thermal behaviour of P(OT), binary P(OT)/GO NCs, ternary P(OT)/GO/CS NCs, ternary P(OT)/GO/SE NCs and ternary P(OT)/GO/ST NCs.
The final composite degradation temperature [CDTfinal], is where temperature is considered the temperature at which the decomposition ends [Citation49, Citation68, Citation69]. displays the results of the TGA curves, elucidating the similarity between the CDTfinal of all ternary NCs. Moreover, based on the DTG curves seen in , the PDTmax values, which are the maximum temperatures at which polymers degrade [Citation49, Citation70, Citation71] proven for samples in , confirm that the ternary P(OT)/GO/CS NCs are more thermally stable due to their interplaying constituents. In comparison between the ternary NCs, the values of PDTmax and CDTfinal of ternary P(OT)/GO/CS NCs are higher than the values of both ternary P(OT)/GO/SE and P(OT)/GO/St NCs.
The previous analysis forms the basis for the proposed mechanism for the formation of ternary P(OT)/GO/CS NCs. The ternary P(OT)/GO/CS NCs were synthesized in an acidic medium using the facile chemical oxidative polymerization method, and their network core–shell–shell structures are shown in Scheme 2a. Acidic conditions cause the –COOH groups on the surface of GO to become protonated, gaining H+ from the surrounding medium [Citation70]. Protonated amine groups in the CS biopolymer structure provide active sites, along with hydroxyl and carboxylate groups [Citation49, Citation69, Citation72]. As a result, the cationic properties of the polymer are due to the protonation of amine groups in acidic conditions [Citation73]. As a result, the surface positive charges of CS as well as GO might be neutralized by the adsorption of several Cl− anions. In addition, in this charge compensation system, throughout the process of P(OT)/GO/CS NC creation, additional Cl− adsorption on the CS and GO surface may act as a charge compensator for P(OT) chains that are positively charged. On the other hand, in acidic environments, the OT monomers transform into O-toluidinium cations. Anions absorbed by the surfaces of CS and GO interact in electrostatic interactions with one another, as well as cationic O-toluidinium. Furthermore, it is possible that there will be two types of hydrogen bonding. First, oxygen and nitrogen atoms on the CS and GO surfaces form hydrogen bonds with P(OT) chains. Second, hydrogen bonding between P(OT) chains occurs in ternary P(OT)/GO/CS NCs. Finally, GO (bonds) stacking with the P(OT) aromatic rings in the π–π configuration assists in stabilizing the ternary P(OT)/GO/CS NC-bound structure [Citation49]. The interactions can confirm that the CS contacted the GO first to form the CS/GO core–shell structure, then the P(OT) was coated with CS to form the P(OT)/CS/GO core–shell–shell structure that produces ternary NCs which show a hollow polymer connected with GO sheets inside the hollow polymer circle and form the NCs as a metal sieve-like structure. As a result, uniform and continuous high interconnection networks are generated. This network provides active centers that are ideal for increasing dye adsorption, so the P(OT)/GO/CS NCs provide a framework for the removal of dye materials.
Scheme 2. Illustration of the fabrication procedure of ternary P(OT)/GO/CS NCs (a) and proposed mechanism of dye removal (b).
3.2. Adsorption studies
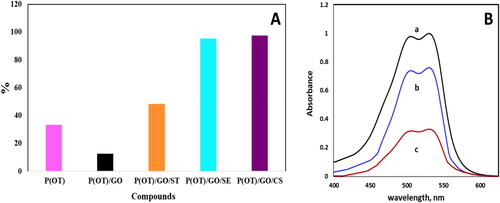
displays a comparison of the polymers’ performance in removing A.R. dye from aqueous solution, the rustle demonstrations that the ternary P(OT)/GO/CS NCs were better than other correspondents in dye extraction, so it was selected as the most appropriate NC for all experimental studies. One absorption peak at 530 nm was visible in the electronic spectrum of A.R. dye when it was recorded in the aqueous phase, as shown in . Meanwhile, after shaking with solid phases P(OT) and P(OT)/GO/CS, this peak substantially diminished ( curves b and c, respectively). This result supports the solid phases’ effectiveness in the removal of A.R. dye from the aqueous phase.
Figure 4. (A) Comparison of the efficiency of the five samples in removing the A.R. dye from an aqueous phase. (B) The electronic spectra of 20 ppm concentration of A.R. dye in aqueous phase (a), and after shaking with 5 mg of P(OT) solid phase (b), and after shaking with 5 mg of P(OT)/GO/CS solid phase (c).
3.3. Comparison with other adsorbents
compares the P(OT)/GO/CS NC adsorption capacity and adsorption time to those of other literature-reported adsorbents. From the data in , it is evident that P(OT)/GO/CS NCs have a remarkable uptake capacity and are potentially an effective, competitive, and promising replacement for other solid adsorbents when used to remove A.R. dyes from solutions.
Table 3. Adsorption capacity of various adsorbents on Acid Red dye.
3.4. Influence of the parameters
3.4.1. Influence of pH
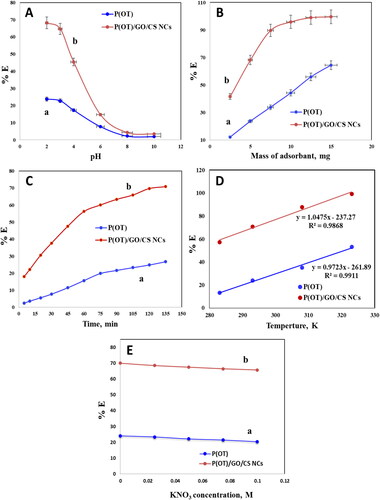
A solution’s adsorption for recovery of dyes depends on several factors, one of which is pH. The features of sorption in aqueous solutions containing A.R. dye at various pH values by solid phases P(OT) and P(OT)/GO/CS NCs was studied after being shaken at room temperature for 120 min. After reaching equilibrium, the amount of A.R. dye in the aqueous phase was determined photometrically [Citation47]. The percentage %E of adsorption of A.R. dye onto solid phases P(OT) and P(OT)/GO/CS NCs have the maximum value in (pH = 2) then the percentage decrease with pH increase. displays sample data. There is a very large concentration of H+ ions in both acidic and slightly alkaline dye solutions [Citation77, Citation78]. This causes the P(OT)/GO/CS NCs to become highly protonated, which facilitates the rapid adsorption of the anionic dye molecules. Dye solution decolorization happens owing to strong electrostatic interaction among positively charged P(OT)/GO/CS NCs and negatively charged dye molecules [Citation79]. When exposed to a very alkaline dye solution with a pH = 10, however, due to the high concentration of OH ions, the P(OT)/GO/CS NC surface attracted hydroxyl ions, neutralizing their charges and limiting dye adsorption. This caused poor dye removal [Citation80, Citation81]. As a result, the researchers decided that a pH value of 2 was ideal for moving forward. The proposed mechanism of dye removal is suggested in Scheme 2b.
Figure 5. Optimization of parameters for the adsorbent solid phases of A.R. dye from the solution samples. Effect of the solution pH with contact time 120 min (a), mass of material with shaking time 90 min (B), contact time (C), temperature at 10, 20, 35, and 50 °C (D) and Influence of concentration of KNO3 (E). (experimental conditions: A.R. dye (20 ppm), pH = 2, 20 ± 0.1 °C temperature, 5 mg of P(OT) (a) and P(OT)/GO/CS NCs (b) solid phases.
3.4.2. Influence of mass
At an A.R. dye (20 mg/L), the impact of the adsorbent mass on the A.R. dye removal from aqueous solution was analyzed (). Dye removal is found to increase in tandem with the mass of NCs because there are more free sites for the dye to occupy. The plot demonstrated an increase in the percentage of removed A.R. dye from the aqueous solution from 41.6 to 99.6% as the P(OT)/GO/CS NC solid phase mass increased from 2.5 to 15 mg and from 12.2 to 64.4% as the P(OT) solid phase mass increased from 2.5 to 15 mg. In this work, we used 5 mg of P(OT)/GO/CS NCs solid phase mass, which corresponds to 68.2%, to investigate how changing other variables impacts the adsorption procedure.
3.4.3. Influence of contact time
One of the most crucial variables in dye adsorption studies is contact time. The results are displayed in , which shows how the contact time affected the A.R. dye removal by the P(OT) and P(OT)/GO/CS NCs solid phases. The percentage of A.R. dye removal increased over time. Within the first 75 min, when the majority of the A.R. dye was adsorbed, this effect was particularly noticeable. Within 135 min, the percentage of A.R. dye removal reached equilibrium. This demonstrates that A.R. dye adsorption on solid phases P(OT) and P(OT)/GO/CS NCs took place in two stages in succession, first in which A.R. dye was transferred from the aqueous phase to the exterior surface of solid phases, was the fastest. The diffusion of A.R. dye between the solid phase bundles was the second step, which was the slower one.
3.4.4. Influence of temperature
The effect of solution temperature on the adsorption process was studied. Experiments at a constant time were conducted at four temperatures: 10, 20, 35, and 50 °C. Solid phase removal of A.R. dye P(OT) and P(OT)/GO/CS NCs was found to increase dramatically with increasing solution temperature (from 10 to 20 to 35 to 50 °C; see ). These data point to the adsorption process being endothermic in nature.
3.4.5. Influence of ionic strength
In the dyeing industry, a number of additives are used, including surfactants and salts (sodium chloride). The presence of salts may reduce dye uptake by reducing the attractive forces between dye molecules and an adsorbent with opposing charges. In contrast, the presence of foreign ions may promote dye dissociation, leading to a general improvement in dye adsorption [Citation82]. Thus, large-scale industrial wastewater cleanup must carefully examine this aspect. Adsorption studies of A.R. dye onto solid phases P(OT) and P(OT)/GO/CS NCs were performed, and the effect of ionic strength on adsorption was also studied. By varying the ionic strength during the adsorption experiments, KNO3 concentrations of 0.025, 0.05, 0.075, and 0.1 mol/L were used (). Increasing the ionic strength of the aqueous solution was shown to decrease the proportion of dye species that were adsorbed. Due to charge accumulation near the adsorbent surface, cations such as K + reduce the dye species’ contact with it [Citation83].
3.5. Adsorption kinetics
Sorption kinetics of pollutants such as A.R. dye from aqueous solution via solid sorbent are important because they reveal important information about reaction pathways and sorption mechanisms. The ability of solid phases P(OT) and P(OT)/GO/CS NCs to retain A.R. Dye sorption is determined by both film diffusion and intraparticle diffusion, and the faster of the two will determine how quickly things move overall. The result from the influence of shaking time was verified by determining the half-life time (t1/2) of A.R. dye solid sorbents from aqueous solutions. For A.R. dye sorption onto solid phases P(OT) and P(OT)/GO/CS NCs, the t1/2 values were determined from log C/Co plots versus time. When calculating the t1/2 value, it was determined to be 1.44 ± 0.06 min and 1.56 ± 0.06 for the P(OT)/GO/CS NCs and P(OT) solid phase, respectively, in accordance with what had been disclosed earlier for values of t1/2 [Citation84]. Therefore, film and intraparticle diffusion are necessary for the kinetics of a dye’s adsorption on solid phase sorbents.
The kinetics of A.R. sorption onto solid phase P(OT) and P(OT)/GO/CS NCs were studied using the following models.
3.5.1. Weber-Morris model
The Weber-Morris model was applied based on the following equation [Citation85]:
(3)
(3)
in which qt and Rd are the sorbed A.R. dye concentration at time t and the rate constant of intraparticle transport, respectively.
displays the plot of qt as a function of time, and the numerical values of Rd are determined by the distinct slope of the Weber-Morris plots, as shown in .
Figure 6. Kinetic models for the adsorption removal of A.R. by P(OT) and P(OT)/GO/CS NCs (A) Weber–Morris plot, (B) Fractional power model, (C) Lagergren plot, (D) Pseudo-second order plot, (E) Elovich model plot and (F) The plot of ln Kc vs. 1000/T for calculating thermodynamic parameters.
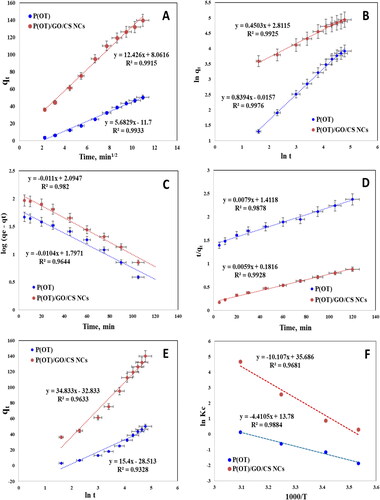
Table 4. Different kinetic models parameters for the adsorption of A.R. dye on the solid phases at 293 K.
3.5.2. Fractional power function model
To determine the kinetic model of the fractional power function, the following equations were used [Citation86]:
(4)
(4)
where at any time t, qt (mg/g) represents the amount of A.R. dye adsorbed per unit of mass of solid phases P(OT) and P(OT)/GO/CS NCs, while a and b are coefficients with b < 1. The experimental data of the adsorption route are applied to the fractional power function equation displayed in , and the values of (R2) are shown in . This information could suggest that the fractional power function kinetic model suitability for the description of A.R. dye adsorption by the solid phases P(OT) and P(OT)/GO/CS NCs.
3.5.3. Lagergren pseudo-first-order model
The Lagergren equation is one of the most often used equations for characterizing rates of adsorption in liquid-phase approaches. We use the following equation [Citation87]:
(5)
(5)
where qe is the A.R. dye amount absorbed per unit of mass of sorbent at equilibrium. For the retention process, KLager is the first-order overall rate constant, and the time is t. From the slope and intercept of the plot log (qe−qt) against t (), which gives the starting line, we calculated both KLager and qe, and the values are presented in .
The first-order kinetics of the sorption of the A.R. dye species onto the employed solid phase sorbent is not supported by all of these data [Citation88, Citation89].
3.5.4. Pseudo-second-order model
In this kinetics model, the following must be considered [Citation90, Citation91]: (i) the total number of binding sites at equilibrium is determined by the quantity of adsorbate adsorbed, and (ii) the concentration of the adsorbate is constant over time. To express the pseudo-second order rate in its linearized form, the following equation was used.
(6)
(6)
where h = k2qe2 represents the initial sorption rate, and qe and qt are the amounts of adsorbate that are absorbed per unit of mass at equilibrium and at any time. As demonstrated, the t/qt plots versus t were linear under these conditions ().
The values of both the second-order rate constant (k2) and the equilibrium capacity (qe) for A.R. dye removed by solid phases, are listed in .
The values of k2, which are generally dependent on experimental factors such as the initial dye concentration, pH, and temperature of the solution, are shown to be in excellent agreement with all of the experimental data [Citation92].
3.5.5. Elovich model
The Elovich model is often used to describe the rate equation mainly depending on their capacity for absorption [Citation93, Citation94]. In most cases, for situations where the absorbing surface is not uniform, this model is valid, and it is most useful for calculating chemisorption kinetics. The following equation provides an expression for this model:
(7)
(7)
where α and β are the initial adsorption rate (g mg−1 min−1) and the desorption coefficient (mg g−1 min−1), respectively. The Elovich parameters α and β were computed from the intercepts and the slopes of the plot of qt against lnt, which was linear (). The data is listed in .
The results of the above various models depend on the correlation coefficient values (see ). The pseudo-second-order adsorption model with good regression coefficients can simulate A.R. dye adsorption on nanocomposites.
3.6. Thermodynamic studies
The retention of A.R. dyes on solid phases is calculated, its sorption was studied at a range of temperatures (293–323 K) using solid phase P(OT) and P(OT)/GO/CS NCs. To calculate the values of the thermodynamic parameters [ΔH, ΔS, and ΔG], we used the following formulas [Citation95]:
(8)
(8)
(9)
(9)
(10)
(10)
where changes in enthalpy, entropy, and Gibbs free energy are denoted by ΔH, ΔS, and ΔG, respectively. The temperature, denoted by T in Kelvin, and the constant for gases are denoted by R (≈8.314 J K−1 mol−1) and the equilibrium constant constant, denoted by KC. To determine the KC values for A.R. dye equilibrium retention from the aqueous solution under test onto the sorbent in the solid phase, we can use the following equation:
(8)
(8)
where Ce is the A.R. dye concentration at equilibrium in aqueous solution (mg L−1), Ca is the amount of A.R. dye adsorbed onto the solid phase per liter at equilibrium (mg L−1). For A.R. dye retention onto solid phases P(OT) and P(OT)/GO/CS NCs, a linear relationship between ln KC versus 1000/T was observed, as proven in , over a wide temperature range (293–323 K). The retention of A.R. dye on the utilized sorbents is an endothermic process, as evidenced by the increase in the constant of equilibrium for solids with increasing temperature.
From the linear plot slope and intercept of ln KC versus 1000/T, we were able to derive the ΔH, ΔS, and ΔG numerical values for A.R. dye retention (). The results are listed in .
Table 5. Illustration thermodynamic parameters at 293 K.
The solid phases have values of ΔH that are proportional to the bond energy difference between the sorbent and the analyte, indicating that the uptake process is endothermic. The positive value of ΔS for solid phases suggests that A.R. dye binding increases the degree of freedom at the solid–liquid interface owing to the release of water molecules from the hydration sphere through adsorption. The negative value of ΔG at 293 K for solid phases suggests spontaneous along with physical retention of A.R. dye onto solid phases.
3.7. Environmental applications
Real samples from the environment must be examined to determine whether solid phases P(OT) and P(OT)/GO/CS NCs are appropriate for the removal of compounds. Water from three different sources was taken for testing: Red Sea water, waste water, and tap water (described in Section 2.6). Three of the samples had their A.R. dye concentration measured, and it was discovered that this concentration was below the (UV–vis) measurement’s detection limit. The results are displayed in and .
Figure 7. The removal percentages of A.R. dye from different real samples by solid phases P(OT) and P(OT)/GO/CS NCs, (experimental conditions: 50 ml solution, pH = 2, shaking time = 120 min, temp. = 308 K, A.R. concentration 20 mg L−1, and 15 mg of P(OT)/GO/CS NCs solid phase and 30 mg P(OT) solid phase).
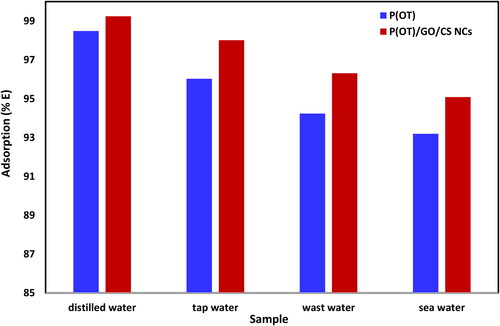
Table 6. The percentages of A.R. dye removed from the real samples by P(OT) and P(OT)/GO/CS NCs solid phase.
For the purpose of removing A.R. dye from solution, the solid phases used were cleaned with acetone, dried, and reused. Adsorption percentages were nearly constant across all four cycles. This demonstrates that solid phases P(OT) and P(OT)/GO/CS NCs can be recycled without losing efficiency.
4. Conclusion
The current investigation shows the fabrication of ternary P(OT)/GO/CS, P(OT)/GO/SE, and P(OT)/GO/ST NCs by the oxidation polymerization method. The properties of these NCs were characterized. Among the ternary NCs, the P(OT)/GO/CS NCs exhibit the greatest A.R. dye removal efficiency compared to other ternary NCs. NCs were tested by removing A.R. dye from real water samples. The removal procedure was efficient for four consecutive cycles. The simple method of production and good reusability of this material demonstrate that natural polymer/GO functionalized poly o-toluidine-based adsorbents may be useful in the treatment of industrial wastewater.
Authors’ Contributions
Dina F. Katowah: Conceptualization; Data curation; Formal analysis; Investigation; Methodology; Project administration; Supervision; Validation; Visualization; roles/Writing - original draft; Writing - review & editing. Mohamed A. Abdel-Fadeel: Conceptualization; Data curation; Formal analysis; Investigation; Methodology; Validation; Visualization; Roles/Writing - original draft; Writing.
Ethics approval
No results of studies involving humans or animals are reported.
Consent to participate
No results of studies involving humans or animals are reported.
Consent for publication
No results of studies involving humans or animals are reported.
Disclosure statement
The authors declare no competing interests.
Data Availability
The authors confirm that the data supporting the findings of this study are available within the article.
Additional information
Funding
Notes on contributors
Dina F. Katowah
Dina F. Katowah, Received his Ph.D. from King Abdulaziz University, and is an Assistant Professor of Organic Chemistry at Umm Al-Qura University. His research interest covers polymer chemistry, synthesis of novel polymers and polymer nanocomposite, natural products, materials chemistry, environmental, medical, and sensor applications…etc.
Mohamed A. Abdel-Fadeel
Mohamed A. Abdel-Fadeel, Received his Ph.D. from King Abdulaziz University, and is an Assistant Professor of Analytical Chemistry at King Abdulaziz University, his research interests include the determination of some heavy metals in aqueous and non-aqueous media, the determination of some organic compounds using different separation techniques, study the removal of different pollutants from water using different techniques such as adsorption, design and synthesis of new nanomaterials, and their applications for environmental remediation, besides extraction of different analytes from solid and water media Kinetic and thermodynamic evaluation of different chemical reactions, and development of new methods for determining organic and inorganic analytes in a different matrix.
References
- Najafi Chaleshtori A, Meghaddam FM, Sadeghi M, et al. Removal of acid red 18 (Azo-Dye) from aqueous solution by adsorption onto activated charcoal prepared from almond shell. JESAM. 2017;20(2):9–16. doi: 10.47125/jesam/2017_2/02.
- Saleh TA, Al-Ruwayshid SH, Sarı A, et al. Synthesis of silica nanoparticles grafted with copolymer of acrylic acrylamide for ultra-removal of methylene blue from aquatic solutions. Eur Polym J. 2020;130:109698. doi: 10.1016/j.eurpolymj.2020.109698.
- Acisli O, Khataee A, Karaca S, et al. Modification of nanosized natural montmorillonite for ultrasound-enhanced adsorption of acid red 17. Ultrason Sonochem. 2016;31:116–121. doi: 10.1016/j.ultsonch.2015.12.012.
- Ashrafi SD, Rezaei S, Forootanfar H, et al. The enzymatic decolorization and detoxification of synthetic dyes by the laccase from a soil-isolated ascomycete, paraconiothyrium variabile. Int Biodeterior Biodegrad. 2013;85:173–181. doi: 10.1016/j.ibiod.2013.07.006.
- Altıntıg E, Yenigun M, Sarı A, et al. Facile synthesis of zinc oxide nanoparticles loaded activated carbon as an eco-friendly adsorbent for ultra-removal of malachite green from water. Environ Technol Innov. 2021;21:101305. doi: 10.1016/j.eti.2020.101305.
- Gholami-Borujeni F, Mahvi AH, Nasseri S, et al. Enzymatic treatment and detoxification of acid orange 7 from textile wastewater. Appl Biochem Biotechnol. 2011;165(5-6):1274–1284. doi: 10.1007/s12010-011-9345-5.
- Zhao T, Li P, Tai C, et al. Efficient decolorization of typical azo dyes using low-frequency ultrasound in presence of carbonate and hydrogen peroxide. J Hazard Mater. 2018;346:42–51. doi: 10.1016/j.jhazmat.2017.12.009.
- Tuzen M, Sarı A, Saleh TA. Response surface optimization, kinetic and thermodynamic studies for effective removal of rhodamine B by magnetic AC/CeO2 nanocomposite. J Environ Manage. 2018;206:170–177. doi: 10.1016/j.jenvman.2017.10.016.
- Koupaie EH, Moghaddam MA, Hashemi S. Post-treatment of anaerobically degraded azo dye acid red 18 using aerobic moving bed biofilm process: enhanced removal of aromatic amines. J Hazard Mater. 2011;195:147–154. doi: 10.1016/j.jhazmat.2011.08.017.
- Mirzadeh S-S, Khezri S-M, Rezaei S, et al. Decolorization of two synthetic dyes using the purified laccase of paraconiothyrium variabile immobilized on porous silica beads. J Environ Health Sci Eng. 2014;12(1):6. doi: 10.1186/2052-336X-12-6.
- Bazrafshan E, Alipour MR, Mahvi AH. Textile wastewater treatment by application of combined chemical coagulation, electrocoagulation, and adsorption processes. Desalin Water Treat. 2016;57(20):9203–9215. doi: 10.1080/19443994.2015.1027960.
- Dalvand A, Nabizadeh R, Ganjali MR, et al. Modeling of reactive blue 19 azo dye removal from colored textile wastewater using L-arginine-functionalized Fe3O4 nanoparticles: optimization, reusability, kinetic and equilibrium studies. J Magn Magn Mater. 2016;404:179–189. doi: 10.1016/j.jmmm.2015.12.040.
- Altintig E, Onaran M, Sarı A, et al. Preparation, characterization and evaluation of bio-based magnetic activated carbon for effective adsorption of malachite green from aqueous solution. Mater Chem Phys. 2018;220:313–321. doi: 10.1016/j.matchemphys.2018.05.077.
- Abdullah NH, Inu I, Razab M, et al. Effect of acidic and alkaline treatments to methylene blue adsorption from aqueous solution by coconut shell activated carbon. IJCRSET. 2018;1(Spl-1):319–324. doi: 10.30967/ijcrset.1.S1.2018.319-324.
- Shokoohi R, Vatanpoor V, Zarrabi M, et al. Adsorption of acid red 18 (AR18) by activated carbon from poplar wood-A kinetic and equilibrium study. E-J Chem. 2010;7(1):65–72. doi: 10.1155/2010/958073.
- Altıntıg E, Altundag H, Tuzen M, et al. Effective removal of methylene blue from aqueous solutions using magnetic loaded activated carbon as novel adsorbent. Chem Eng Res Des. 2017;122:151–163. doi: 10.1016/j.cherd.2017.03.035.
- Bazrafshan E, Mostafapour FK, Hosseini AR, et al. Decolorisation of reactive red 120 dye by using single-walled carbon nanotubes in aqueous solutions. J Chem. 2013;2013:1–8. doi: 10.1155/2013/938374.
- Saleh TA, Elsharif AM, Bin-Dahman OA. Synthesis of amine functionalization carbon nanotube-low symmetry porphyrin derivatives conjugates toward dye and metal ions removal. J Mol Liq. 2021;340:117024. doi: 10.1016/j.molliq.2021.117024.
- Saleh TA, Tuzen M, Sarı A. Evaluation of poly (ethylene diamine-trimesoyl chloride)-modified diatomite as efficient adsorbent for removal of rhodamine B from wastewater samples. Environ Sci Pollut Res Int. 2021;28(39):55655–55666. doi: 10.1007/s11356-021-14832-3.
- Gouthaman A, Azarudeen RS, Gnanaprakasam A, et al. Polymeric nanocomposites for the removal of acid red 52 dye from aqueous solutions: synthesis, characterization, kinetic and isotherm studies. Ecotoxicol Environ Saf. 2018;160:42–51. doi: 10.1016/j.ecoenv.2018.05.011.
- Pandey N, Shukla SK, Singh NB. Water purification by polymer nanocomposites: an overview. Nanocomposites. 2017;3(2):47–66. doi: 10.1080/20550324.2017.1329983.
- Geim AK, Novoselov KS. The rise of graphene. Nat Mater. 2007;6(3):183–191. doi: 10.1038/nmat1849.
- Li D, Kaner RB. Graphene-based materials. Science. 2008;320(5880):1170–1171. doi: 10.1126/science.1158180.
- Geim AK. Graphene: status and prospects. Science. 2009;324(5934):1530–1534. doi: 10.1126/science.1158877.
- Huang X, Qi X, Boey F, et al. Graphene-based composites. Chem Soc Rev. 2012;41(2):666–686. doi: 10.1039/c1cs15078b.
- Xu Y, Zhao L, Bai H, et al. Chemically converted graphene induced molecular flattening of 5, 10, 15, 20-tetrakis (1-methyl-4-pyridinio) porphyrin and its application for optical detection of cadmium (II) ions. J Am Chem Soc. 2009;131(37):13490–13497. doi: 10.1021/ja905032g.
- Jin F, Lv W, Zhang C, et al. High-performance ultrafiltration membranes based on polyethersulfone–graphene oxide composites. RSC Adv. 2013;3(44):21394–21397. doi: 10.1039/c3ra42908c.
- Gao B, Li P, Yang R, et al. Investigation of multiple adsorption mechanisms for efficient removal of ofloxacin from water using lignin-based adsorbents. Sci Rep. 2019;9(1):637. doi: 10.1038/s41598-018-37206-1.
- Hokkanen S, Bhatnagar A, Sillanpää M. A review on modification methods to cellulose-based adsorbents to improve adsorption capacity. Water Res. 2016;91:156–173. doi: 10.1016/j.watres.2016.01.008.
- Haroon M, Yu H, Wang L, et al. Synthesis and characterization of carboxymethyl starch-g-polyacrylic acids and their properties as adsorbents for ammonia and phenol. Int J Biol Macromol. 2019;138:349–358. doi: 10.1016/j.ijbiomac.2019.07.046.
- Vakili M, Rafatullah M, Salamatinia B, et al. Application of chitosan and its derivatives as adsorbents for dye removal from water and wastewater: a review. Carbohydr Polym. 2014;113:115–130. doi: 10.1016/j.carbpol.2014.07.007.
- Chauhan K, Kaur J, Kumari A, et al. Efficient method of starch functionalization to bis-quaternary structure unit. Int J Biol Macromol. 2015;80:498–505. doi: 10.1016/j.ijbiomac.2015.07.011.
- Song W, Gao B, Xu X, et al. Adsorption of nitrate from aqueous solution by magnetic amine-crosslinked biopolymer based corn stalk and its chemical regeneration property. J Hazard Mater. 2016;304:280–290. doi: 10.1016/j.jhazmat.2015.10.073.
- Zhang W, Yan H, Li H, et al. Removal of dyes from aqueous solutions by straw based adsorbents: batch and column studies. Chem Eng J. 2011;168(3):1120–1127. doi: 10.1016/j.cej.2011.01.094.
- Sahu S, Mallik L, Pahi S, et al. Facile synthesis of poly o-toluidine modified lanthanum phosphate nanocomposite as a superior adsorbent for selective fluoride removal: a mechanistic and kinetic study. Chemosphere. 2020;252:126551. doi: 10.1016/j.chemosphere.2020.126551.
- Alqarni SA. Deliberated system of ternary core–shell polythiophene/ZnO/MWCNTs and polythiophene/ZnO/ox-MWCNTs nanocomposites for brilliant green dye removal from aqueous solutions. Nanocomposites. 2022;8(1):47–63. doi: 10.1080/20550324.2022.2054209.
- Raval NP, Priyadarshi GV, Mukherjee S, et al. Statistical physics modeling and evaluation of adsorption properties of chitosan-zinc oxide nanocomposites for the removal of an anionic dye. J Environ Chem Eng. 2022;10(6):108873. doi: 10.1016/j.jece.2022.108873.
- Lee J, Patel R. Wastewater treatment by polymeric microspheres: a review. Polymers (Basel). 2022;14(9):1890. doi: 10.3390/polym14091890.
- Ashogbon AO, Akintayo ET. Recent trend in the physical and chemical modification of starches from different botanical sources: a review. Starch‐Stärke. 2014;66(1–2):41–57. doi: 10.1002/star.201300106.
- Alyarnezhad S, Marino T, Parsa JB, et al. Polyvinylidene fluoride-graphene oxide membranes for dye removal under visible light irradiation. Polymers (Basel). 2020;12(7):1509. doi: 10.3390/polym12071509.
- Junaidi N, Khalil N, Jahari A, et al. Effect of graphene oxide (GO) on the surface morphology & hydrophilicity of polyethersulfone (PES). IOP Conf Ser: Mater Sci Eng. 2018;358:012047. doi: 10.1088/1757-899X/358/1/012047.
- Mahmoud KA, Mansoor B, Mansour A, et al. Functional graphene nanosheets: the next generation membranes for water desalination. Desalination. 2015;356:208–225. doi: 10.1016/j.desal.2014.10.022.
- Zare EN, Motahari A, Sillanpää M. Nanoadsorbents based on conducting polymer nanocomposites with main focus on polyaniline and its derivatives for removal of heavy metal ions/dyes: a review. Environ Res. 2018;162:173–195. doi: 10.1016/j.envres.2017.12.025.
- Nasar A, Mashkoor F. Application of polyaniline-based adsorbents for dye removal from water and wastewater—a review. Environ Sci Pollut Res Int. 2019;26(6):5333–5356. doi: 10.1007/s11356-018-3990-y.
- Mylkie K, Nowak P, Rybczynski P, et al. Polymer-coated magnetite nanoparticles for protein immobilization. Materials. 2021;14(2):248. doi: 10.3390/ma14020248.
- Shahriary L, Athawale AA. Graphene oxide synthesized by using modified hummers approach. Int J Renew Energy Environ Eng. 2014;02:58–63.
- Marczenko Z, Freiser H. Spectrophotometric determination of trace elements. Crit Rev Anal Chem. 1981;11:195–260.
- Sofla RLM, Rezaei M, Babaie A. Investigation of the effect of graphene oxide functionalization on the physical, mechanical and shape memory properties of polyurethane/reduced graphene oxide nanocomposites. Diamond Relat Mater. 2019;95:195–205. doi: 10.1016/j.diamond.2019.04.012.
- Katowah DF, Rahman MM, Hussein MA, et al. Ternary nanocomposite based poly (pyrrole-co-O-toluidine), cobalt ferrite and decorated chitosan as a selective Co2+ cationic sensor. Composites Part B: Engineering. 2019;175:107175. doi: 10.1016/j.compositesb.2019.107175.
- Wan Ishak WH, Ahmad I, Ramli S, et al. Gamma irradiation-assisted synthesis of cellulose nanocrystal-reinforced gelatin hydrogels. Nanomaterials. 2018;8(10):749. doi: 10.3390/nano8100749.
- Chia M-R, Ahmad I, Phang S-W. Starch/polyaniline biopolymer film as potential intelligent food packaging with colourimetric ammonia sensor. Polymers (Basel). 2022;14(6):1122. doi: 10.3390/polym14061122.
- Chiang J-C, MacDiarmid AG. Polyaniline’: protonic acid doping of the emeraldine form to the metallic regime. Synth Met. 1986;13(1–3):193–205. doi: 10.1016/0379-6779(86)90070-6.
- Ping Z. In situ FTIR–attenuated total reflection spectroscopic investigations on the base–acid transitions of polyaniline. Base–acid transition in the emeraldine form of polyaniline. J Chem Soc, Faraday Trans. 1996;92(17):3063–3067. doi: 10.1039/FT9969203063.
- Ibrahim NI, Wasfi AS. A comparative study of polyaniline/MWCNT with polyaniline/SWCNT nanocomposite films synthesized by microwave plasma polymerization. Synth Met. 2019;250:49–54. doi: 10.1016/j.synthmet.2019.02.007.
- Quillard S, Louarn G, Lefrant S, et al. Vibrational analysis of polyaniline: a comparative study of leucoemeraldine, emeraldine, and pernigraniline bases. Phys Rev B Condens Matter. 1994;50(17):12496–12508. doi: 10.1103/physrevb.50.12496.
- Yang J, Wang X, Wang X, et al. Preparation of highly conductive CNTs/polyaniline composites through plasma pretreating and in-situ polymerization. J Phys Chem Solids. 2010;71(4):448–452. doi: 10.1016/j.jpcs.2009.12.008.
- Sharma AK, Chaudhary G, Kaushal I, et al. Studies on nanocomposites of polyaniline using different substrates. Am J Polym Sci. 2015;1:1–6.
- Mazzeu MAC, Faria LK, Baldan MR, et al. Influence of reaction time on the structure of polyaniline synthesized on a pre-pilot scale. Braz J Chem Eng. 2018;35(1):123–130. doi: 10.1590/0104-6632.20180351s20160201.
- Yavuz AG, Uygun A, Bhethanabotla VR. Substituted polyaniline/chitosan composites: synthesis and characterization. Carbohydr Polym. 2009;75(3):448–453. doi: 10.1016/j.carbpol.2008.08.005.
- Nepomuceno N, Seixas A, Medeiros E, et al. Evaluation of conductivity of nanostructured polyaniline/cellulose nanocrystals (PANI/CNC) obtained via in situ polymerization. J Solid State Chem. 2021;302:122372. doi: 10.1016/j.jssc.2021.122372.
- Nazarzadeh ZE, Najafi MP, Azariyan E, et al. Conductive and biodegradable polyaniline/starch blends and their composites with polystyrene. Iran Polym J. 2011;2:319–328.
- Dresselhaus MS, Dresselhaus G, Saito R, et al. Raman spectroscopy of carbon nanotubes. Phys Rep. 2005;409(2):47–99. doi: 10.1016/j.physrep.2004.10.006.
- Kumar Sharma A, Bhardwaj P, Kumar Dhawan S, et al. Oxidative synthesis and electrochemical studies of poly (aniline-co-pyrrole)-hybrid carbon nanostructured composite electrode materials for supercapacitor. Adv Mater Lett. 2015;6(5):414–420. doi: 10.5185/amlett.2015.5690.
- Khan A, Khan A, Asiri A, et al. Surfactant-assisted graphene oxide/methylaniline nanocomposites for lead ionic sensor development for the environmental remediation in real sample matrices. Int J Environ Sci Technol. 2019;16(12):8461–8470. doi: 10.1007/s13762-019-02447-8.
- Savitha P, Sathyanarayana D. Copolymers of aniline with o‐and m‐toluidine: synthesis and characterization. Polym Int. 2004;53(1):106–112. doi: 10.1002/pi.1316.
- Luo J, Shen P, Yao W, et al. Synthesis, characterization, and microwave absorption properties of reduced graphene oxide/strontium ferrite/polyaniline nanocomposites. Nanoscale Res Lett. 2016;11(1):141. doi: 10.1186/s11671-016-1340-x.
- Wu T-M, Lin Y-W, Liao C-S. Preparation and characterization of polyaniline/multi-walled carbon nanotube composites. Carbon. 2005;43(4):734–740. doi: 10.1016/j.carbon.2004.10.043.
- Katowah DF, Mohammed GI, Al‐Eryani DA, et al. Fabrication of conductive cross‐linked polyaniline/G‐MWCNTS core‐shell nanocomposite: a selective sensor for trace determination of chlorophenol in water samples. Polym Adv Technol. 2020;31(11):2615–2631. doi: 10.1002/pat.4988.
- Katowah DF, Saleh SM, Alqarni SA, et al. Network structure-based decorated CPA@ CuO hybrid nanocomposite for methyl orange environmental remediation. Sci Rep. 2021;11(1):5056. doi: 10.1038/s41598-021-84540-y.
- Katowah DF, Hussein MA, Alam M, et al. Poly (pyrrole-co-o-toluidine) wrapped CoFe 2 O 4/R (GO–OXSWCNTs) ternary composite material for Ga 3+ sensing ability. RSC Adv. 2019;9(57):33052–33070. doi: 10.1039/c9ra03593a.
- Katowah DF, Hussein MA, Alam M, et al. Selective fabrication of an electrochemical sensor for Pb2+ based on poly (pyrrole‐co‐o–toluidine)/CoFe2O4 nanocomposites. ChemistrySelect. 2019;4(35):10609–10619. doi: 10.1002/slct.201902714.
- Sureshkumar V, Kiruba Daniel S, Ruckmani K, et al. Fabrication of chitosan–magnetite nanocomposite strip for chromium removal. Appl Nanosci. 2016;6(2):277–285. doi: 10.1007/s13204-015-0429-3.
- Guibal E. Interactions of metal ions with chitosan-based sorbents: a review. Sep Purif Technol. 2004;38(1):43–74. doi: 10.1016/j.seppur.2003.10.004.
- Kamran U, Bhatti HN, Noreen S, et al. Chemically modified sugarcane bagasse-based biocomposites for efficient removal of acid red 1 dye: kinetics, isotherms, thermodynamics, and desorption studies. Chemosphere. 2022;291(Pt 2):132796. doi: 10.1016/j.chemosphere.2021.132796.
- Salam MA, Gabal M, Al Angari Y. The recycle of spent Zn–C batteries and the synthesis of magnetic nanocomposite from graphene nanosheets and ferrite and its application for environmental remediation. J Mater Res Technol. 2022;18:4267–4276. doi: 10.1016/j.jmrt.2022.04.112.
- Zhang J-W, Mariska S, Van HT, et al. Synthesis of titanate nanotubes/layered double hydroxides/graphene oxide composites and applications for the removal of methylene blue, methylene green 5, and acid red 1 from aqueous solutions. Inorg Chem Commun. 2023;152:110723. doi: 10.1016/j.inoche.2023.110723.
- Saratale RG, Saratale GD, Chang J-S, et al. Bacterial decolorization and degradation of azo dyes: a review. J Taiwan Inst Chem Eng. 2011;42(1):138–157. doi: 10.1016/j.jtice.2010.06.006.
- Ko SH, Lee D, Kang HW, et al. Nanoforest of hydrothermally grown hierarchical ZnO nanowires for a high efficiency dye-sensitized solar cell. Nano Lett. 2011;11(2):666–671. doi: 10.1021/nl1037962.
- Długosz M, Żmudzki P, Kwiecień A, et al. Photocatalytic degradation of sulfamethoxazole in aqueous solution using a floating TiO2-expanded perlite photocatalyst. J Hazard Mater. 2015;298:146–153. doi: 10.1016/j.jhazmat.2015.05.016.
- Gong J-L, Wang B, Zeng G-M, et al. Removal of cationic dyes from aqueous solution using magnetic multi-wall carbon nanotube nanocomposite as adsorbent. J Hazard Mater. 2009;164(2–3):1517–1522. doi: 10.1016/j.jhazmat.2008.09.072.
- Mattoso L, Manohar S, MacDiarmid A, et al. Studies on the chemical syntheses and on the characteristics of polyaniline derivatives. J Polym Sci A Polym Chem. 1995;33(8):1227–1234. doi: 10.1002/pola.1995.080330805.
- Liu Y, Zeng G, Tang L, et al. Highly effective adsorption of cationic and anionic dyes on magnetic Fe/Ni nanoparticles doped bimodal mesoporous carbon. J Colloid Interface Sci. 2015;448:451–459. doi: 10.1016/j.jcis.2015.02.037.
- Dastgheib SA, Rockstraw DA. A systematic study and proposed model of the adsorption of binary metal ion solutes in aqueous solution onto activated carbon produced from pecan shells. Carbon. 2002;40(11):1853–1861. doi: 10.1016/S0008-6223(02)00036-2.
- Palágyi S, Braun T. Separation and preconcentration of trace elements and inorganic species on solid polyurethane foam sorbents. In Preconcentration techniques for trace elements. United States: CRC Press; 1992. p. 363–400.
- Weber W, Morris J. Kinetics of adsorption on carbon from solution. J. Sanit. Engrg. Div. 1963;89(2):31–59. doi: 10.1061/JSEDAI.0000430.
- Dalal R. Desorption of soil phosphate by anion‐exchange resin. Commun Soil Sci Plant Anal. 1974;5(6):531–538. doi: 10.1080/00103627409366531.
- Bhattacharya AK, Venkobachar C. Removal of cadmium (II) by low cost adsorbents. J. Environ. Eng. 1984;110(1):110–122. doi: 10.1061/(ASCE)0733-9372(1984)110:1(110).
- El-Shahawi M, Othman M, Abdel-Fadeel M. Kinetics, thermodynamic and chromatographic behaviour of the uranyl ions sorption from aqueous thiocyanate media onto polyurethane foams. Anal Chim Acta. 2005;546(2):221–228. doi: 10.1016/j.aca.2005.05.018.
- Gabal M, Al-Zahrani N, Al Angari Y, et al. CoFe2O4/MWCNTs nano-composites structural, thermal, magnetic, electrical properties and dye removal capability. Mater Res Express. 2019;6(10):105059. doi: 10.1088/2053-1591/ab3b88.
- Al-Saidi H, Abdel-Fadeel M, El-Sonbati A, et al. Multi-walled carbon nanotubes as an adsorbent material for the solid phase extraction of bismuth from aqueous media: kinetic and thermodynamic studies and analytical applications. J Mol Liq. 2016;216:693–698. doi: 10.1016/j.molliq.2016.01.086.
- Al-Saidi HM, Abdel-Fadeel MA, Alharthi SS. Preconcentration and ultrasensitive spectrophotometric estimation of tungsten in soils using polyurethane foam in the presence of rhodamine B: kinetic and thermodynamic studies, and designing a simple automated preconcentration system. J Saudi Chem Soc. 2021;25(8):101301. doi: 10.1016/j.jscs.2021.101301.
- Braun T, Navratil JD, Farag A. Polyurethane foam sorbents in separation science. United States: CRC Press; 2018.
- Salam MA, Mohamed RM. Removal of antimony (III) by multi-walled carbon nanotubes from model solution and environmental samples. Chem Eng Res Des. 2013;91(7):1352–1360. doi: 10.1016/j.cherd.2013.02.007.
- Salam MA, Lateefa A, Abdel-Fadeel MA. Removal of toxic ammonium ions from water using nanographene sheets. DWT. 2018;129:168–176. doi: 10.5004/dwt.2018.23085.
- Hameed SA, Abdel-Fadeel MA, Al-Saidi HM, et al. Simultaneous removal of the toxic tungsten ions and rhodamine B dye by graphene nanosheets from model and real water. DWT. 2020;188:266–276. doi: 10.5004/dwt.2020.25348.