
 ?Mathematical formulae have been encoded as MathML and are displayed in this HTML version using MathJax in order to improve their display. Uncheck the box to turn MathJax off. This feature requires Javascript. Click on a formula to zoom.
Abstract
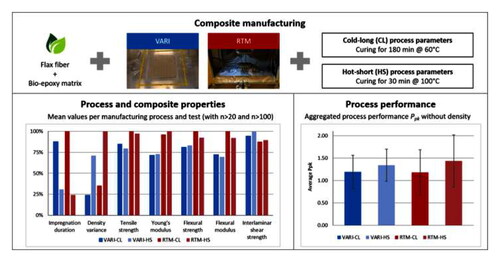
The utilization of bio-based materials for the manufacturing of fiber-reinforced polymer composites is gaining importance under the sustainability paradigm. The identification of suitable process parameters and limited process reproducibility remain among the major challenges to enhance the industrial application potential of bio-based composites. This is especially relevant, as the manufacturing process influences composite quality, economic performance and environmental impacts. This study compares Resin Transfer Molding and Vacuum Assisted Resin Infusion for two sets of process parameters in order to manufacture a composite plate consisting of a flax-fiber textile impregnated with a partially bio-based epoxy matrix. Process quality is described through statistical analysis of processing and composite properties, and performance in terms of process replicability and reliability using performance estimates. Processing parameters were selected to depict a range of manufacturing scenarios that were suitable for the selected bio-based material system from curing for 180 min at 60 °C to curing for 30 min at 100 °C. For an identical set of process conditions, Resin Transfer Molding outperforms Vacuum Assisted Resin Infusion in terms of tensile and flexural characteristics. Conversely, the latter shows the strongest fiber-matrix adhesion and the most homogeneous impregnation. Whereas manufacturing at lower temperature leads to positive effects on composite quality, higher processing temperature with shorter curing cycles achieve highest process performance in terms of Pp and Ppk indices. An additional annealing at 120 °C neither increases composite quality nor reduces manufacturing-induced variability. Results depend on processing differences and indicators to determine process performance, as well as methodological choices.
GRAPHICAL ABSTRACT
1. Introduction
In light of global environmental challenges and the sustainability paradigm, industry and research aim to find solutions to shift from a conventional, fossil resource-based economy to a more sustainable one while maintaining benefits associated with the use of fiber-reinforced polymer composites (FRPC). One field of interest in implementing this change is the substitution of non-renewable textile reinforcements and matrix systems with ones based on renewable, biogenic resources [Citation1]. Previous research focuses especially on the substitution of glass fiber reinforcements with natural fibers such as flax, hemp, kenaf, and jute fibers, and the resulting composite properties [Citation2]. There is an increasing interest in alternative, bio-based matrix materials sourced from renewable feedstock, but these natural fibers are often combined with a thermoplastic or thermoset matrix derived from fossil resources. Therefore, recent research also considers polymers produced from agricultural biomass, derived from micro-organisms, and synthesized from bio-based monomers to achieve a higher bio-based content in the composite [Citation3].
Next to material choices, the composite manufacturing process and chosen processing parameters influence composite properties, industrial application potential, energy consumption, and environmental impacts [Citation4, Citation5]. Van Oosterom et al. report significant differences in infusion time, laminate pressure, fiber volume fraction, and mechanical properties between six different infusion methods they investigated using a glass fiber unidirectional non-crimp fabric in a low viscosity epoxy resin matrix [Citation6]. The choice of the manufacturing process depends on the field of application targeted as different processes have specific advantages and drawbacks [Citation7]. Among the liquid composite molding (LCM) processes, Resin Transfer Molding (RTM) and Vacuum Assisted Resin Infusion (VARI) are industrially relevant processes for high-quality composites with complex geometry for structural applications [Citation8]. The general challenge of reproducibility in LCM processes is exacerbated when processing bio-based materials due to their inherently heterogeneous nature [Citation5, Citation9].
Given the lack of studies on LCM process reproducibility for manufacturing bio-based composites, this study quantifies the processability of a flax fiber textile reinforcement with a partially bio-based epoxy system in VARI and RTM processes using process capability estimates and performance measures. This research aims to be relevant to a wide possible range of applications using LCM processes. Advanced applications of FRPC require thermoset matrix materials, such as epoxies, to reach high mechanical properties, high durability, and good adhesion to the textile reinforcement. Bio-based epoxies are promising to provide similar benefits to their conventional counterparts [Citation10].
Process performance is the statistical measure of inherent process variability for a given process characteristic (ISO 22514-4:2016) and thus, a useful tool to assess process replicability and reliability. Two configurations per process depict the range of potential process parameters, such as curing time and temperature. This research’s objectives are to understand the performance of the different processes and to assess the current capabilities and limitations of the selected processes to manufacture bio-based FRPC. The manufacturing processes are described and assessed by processing parameters, such as impregnation duration and homogeneity of impregnation (via variance of density in the direction of resin flow), and according to composite quality, using criteria such as tensile and flexural properties as well as interlaminar shear strength (ILSS). Therefore, it also gives insight into the impact of the manufacturing process on the composite properties of a rather heterogeneous material. In addition to composite manufacturing, the effects of annealing to potentially improve material properties and homogeneity are studied and discussed. The implications of these findings on industrial application potentials are presented in the conclusion.
2. Materials and methods
2.1. Composite manufacturing: Materials and processes
To make VARI and RTM processes comparable for this study, the same materials were used and the manufactured composites were designed to have identical geometry: a flat plate of 270 mm width and 269 mm length. To produce these plates, six layers of a flax fiber-based 4 × 4 twill weave (ampliTexTM 5042 from Bcomp®, Switzerland) were impregnated with the partially bio-based epoxy system: Epinal IR 78.31 (37.58% bio-based content) and IH 77.11 of bto-epoxy GmbH, Austria. The natural fiber textile is composed of a 500 tex no twist yarn and possesses an areal weight of 500 g/m2. The mixing ratio of resin and hardener is 100:25 by weight, with a pot life of around 75 min (for 100 g at 20 °C) and a glass transition temperature between 60 °C (when cured at 25 °C for 7 days) and 93 °C (when cured at 70 °C for 8 h). Materials were selected according to market availability, processability (pot life above 10 min, viscosity of 100–1000 mPas and acceptable curing times of up to 3 h and temperatures of up to 120 °C), potentially high material properties, and whether the bio-based content is derived from regional material sources.
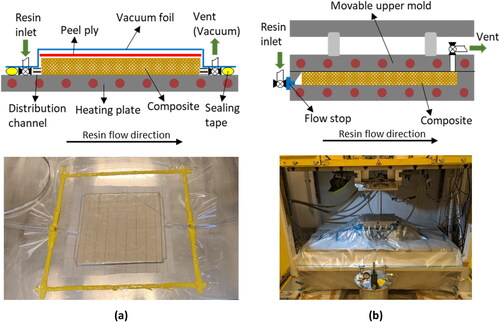
As natural fibers absorb humidity, the flax fiber preforms have been dried at 120 °C for 30 min before the impregnation with the bio-based resin. The resin and hardener were mixed by hand at room temperature and degassed before injection/infusion. Degassing time was monitored using a timer beginning at the opening of the valve of the vacuum chamber until there were no more visible air bubbles at the surface of the liquid resin at which point it was stopped. The average degassing time was approximately five minutes. The schematic setup of VARI and RTM processing is visible in . Both processes are at laboratory scale to conduct explorative research. In VARI, the preform is impregnated due to the low pressure compared to ambient air pressure generated by the E2M28 vacuum pump (Edwards Limited, United Kingdom) at the vent, whereas in RTM the resin is injected by means of a pressure pot. Additionally, in VARI the preform is compacted due to environmental pressure acting on top of the vacuum foil compared to RTM, where the mold is closed by the hydraulic mold carrier LZT-OK-80-SO (Langzauner GmbH, Austria) resulting in a defined cavity height of 4 mm.
Figure 1. Schematic description and illustration of the VARI (a) and RTM (b) process setup as investigated in this study.
For both, VARI and RTM, two different process configurations were chosen. The processing parameters for these configurations are listed in . In the Cold-Long (CL) configurations, the tool temperature of 60 °C was lower with longer curing times of 180 min, while the Hot-Short (HS) configurations use a higher tool temperature of 100 °C with shorter curing cycles of 30 min. The tool temperature was set to a maximum of 100 °C after the determination of gel points at different temperatures. At 120 °C, it was not possible to fully impregnate the preform due to the speed of the curing reaction. 60 °C as the lower limit was chosen to depict a range of process parameters, while still achieving feasible curing times to be able to conduct the repetitions of trials with the available resources. To reflect on this choice and impregnation durations, the viscosity of the matrix system was analyzed with a modular compact rheometer MCR 702 MultiDrive (Anton Paar GmbH, Austria) in oscillating mode with disposable plate-plate geometry of 50 mm diameter in accordance with ISO 6721 [Citation11]. Frequency sweep measurements were performed at an angular frequency of 10 rad/s at a strain of 5% (to be in the viscoelastic region) at 60 °C and 100 °C. The epoxy resin and hardener were mixed at room temperature and degassed directly before the viscosity measurements.
Table 1. Processing parameters in VARI-CL, VARI-HS, RTM-CL and RTM-HS.
For the entire curing cycle in RTM-HS, an injection pressure of six bars from the pressurized air system was applied. For the RTM-CL manufacturing, the impregnation pressure was additionally applied for the first 60 min of the curing cycle after closing the outlet tubes until the curing reaction was well-advanced and the resin solidified. For VARI-CL trials, two plates were produced at the same time, of which one was selected for an additional annealing step (AN). Annealing in thermoset FRPC serves to ensure a high degree of cure and leads to improved material properties [Citation12]. The annealing included heating up from room temperature to 120 °C and after 120 min, convectional cooling to room temperature. For the RTM-HS configuration, the tool was actively cooled to 60 °C after the 30 min curing cycle to demold the composite below glass-transition temperature. Furthermore, the surfaces of the molds used for the manufacturing processes (heating plate in VARI and upper and lower mold in RTM) were prepared with a release agent to avoid composite damage during demolding.
As this is a study on replicability, all sources of external variance were reduced as much as possible by following a specifically defined trial conduction sheet keeping the same responsibilities and limiting the number of people working on manufacturing and testing of the specimens.
2.2. Sample size and indicators to determine process performance
For each manufacturing process configuration, 21 plates have been produced from which the specimens for material testing have been cut. The sample size has a critical influence on determining and interpreting capability estimates in an industrial context. The minimum sample size was chosen after reviewing studies on capability, which recommend sample sizes of >20 for a study at an experimental scale [Citation13]. Nevertheless, the sample size differs per indicator as multiple indicators have been chosen to determine process performance. Data on infusion/injection duration was collected by measuring the time between opening the resin inlet and closing the resin inlet or outlet for either VARI or RTM configurations, respectively. Both RTM configurations featured holding pressure for 30 min in RTM-HS and 60 min in RTM-CL after closing the outlet. The variance of mass density tested along the length of the plate from injection inlet to outlet was used as an indicator for impregnation homogeneity per plate. Variance rather than actual density values was chosen as an indicator for process performance to emphasize differences as a result of the manufacturing process and parameter choice. Nevertheless, their suitability for process performance analysis will be discussed. Variance is determined by measuring nine specimens of 25 × 25 mm according to the Archimedes method as described in ISO 1183-1:2019 [Citation14] using analytical balance AG204 (Mettler Toledo Inc., United States) with distilled water. Young’s modulus (secant modulus) and tensile strength were determined according to ISO 527-4:2021 [Citation15] at strain rates of 2 mm/min and a gauge length of 75 mm. Five specimens per plate of 250 × 25 mm were prepared with GF/epoxy end-tabs according to Adams & Adams [Citation16]. The specimen production and especially the tabbing procedure (roughening of the surface, gluing, and curing the two-component glue UHU Plus Endfest 300 under pressure) have affected the absolute strength of the composite and are a source of additional variance. Despite specimen failure close to the end-tabs, the tabbing was necessary due to the inhomogeneous surface of the VARI specimens. The results are still useful to compare the processes as all specimens were conditioned using the same procedure and preparation parameters. In this sense, composite quality is analyzed as a function of the manufacturing process rather than the individual material properties. Flexural strength and modulus were determined according to ISO 14125:1998 [Citation17] with six specimens per plate. The speed of testing was 2 mm/min and the span width was 64 mm. ILSS measurements are based on ISO 14130:1997 [Citation18] with five specimens per plate. The speed of testing was 1 mm/min and the span width was 20 mm. In both standards, it is recommended to determine specimen size based on laminate thickness. The thickness of VARI plates varies from 5.4 to 5.8 mm, while in RTM there is less variance due to the cavity height of 4 mm. To ensure comparability, the same size has been chosen for all specimens: 80 × 10 mm for flexural, and 50 × 25 mm for ILSS tests. Universal testing machine Z250 (Zwick Roell AS, Germany) was used to carry out tensile, flexural, and ILSS measurements. As the mechanical properties of composites manufactured using LCM processes are susceptible to specimen location [Citation19], the same specimen preparation and cutting scheme has been used for all plates manufactured. All tests were conducted at standard atmospheric conditions [Citation20] and specimens were incubated at these conditions for 24 h before testing.
2.3. Statistical analysis
Absolute values, reference intervals, and performance values were calculated using Minitab Software [Citation21] to sufficiently characterize the processes, illustrate deviation per process, and make the processes and chosen indicators comparable by a single, unitless indicator. Before the calculation of these results, the distribution type was determined graphically via histograms and probability plots, and quantitatively via Anderson-Darling-tests [Citation22] to identify the most suitable method for outlier identification and capability analysis. The target for distribution identification is a significance level α of 0.05. The distribution with the highest p-value was chosen for further analysis, which will be critically discussed in Section 4.2. Outlier analysis was performed by analyzing histograms and boxplots, using Dixon’s r22 ratio test [Citation23], and the Grubbs test [Citation24]. The Grubbs test is limited to normally distributed data and Dixon’s-ratio-tests are less suitable for skewed distributions and large sample sizes [Citation25]. Only when two tests (from descriptive or quantitative analysis) indicated an outlier, was the outlier in question investigated. Explainable outliers (e.g. due to specimen slippage during testing) were considered invalid data points and removed from the datasets for further analysis.
Prior to calculating performance indices, data was analyzed to determine whether the process was in statistical control. Processes are considered in control when there is no value greater than the mean plus three times the standard deviation, and also no value lower than the mean minus three times the standard deviation. For subsequent manufacturing process performance evaluation, the term “capability” is used for processes that are in statistical control. For processes that are not controlled using a control chart, the term “performance” is employed. Despite the difference in terminology, calculation and interpretation methods are the same for both estimates [Citation26]. In the following, only the term “performance” is used to improve readability.
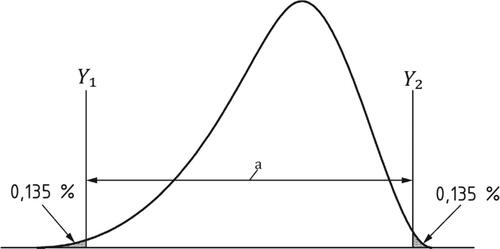
As visible in , the reference for process performance is the interval a between Y1 ≙ 0.135% and Y2 ≙ 99.865% of the individual values’ distributions, thus, the interval containing 99.73% of the data.
Figure 2. Reference interval a according to ISO 22514-4: 2016.
The process performance index, known as Pp, is the ratio of a specified tolerance to the reference interval and is calculated as follows:
(1)
(1)
where U is the upper specification limit and L is the lower specification limit. The minimum process performance index Ppk considers the location relative to the specification limits in addition to Pp. It is the smaller value of (a) the upper process performance index PpkU and (b) the lower process performance index PpkL, which are calculated as follows:
(2)
(2)
(3)
(3)
where X50% is the median of the distribution of individual values. For the normal distribution, it is equal to the mean μ.
Specification limits U and L are usually set according to industrial requirements. This study encounters the challenge of no industrially available tolerance limits due to the novelty of the material and the explorative nature of the research depicting several manufacturing scenarios. Therefore, two approaches to determine U and L have been identified. The median deviation (MD) approach sets U and L for each performance indicator to a tolerance of ±25% of the median. Maurer et al. [Citation27] propose the Reverse Six Sigma (R6σ) approach, which calculates U and L for arbitrary data distributions as follows:
(4)
(4)
(5)
(5)
where μ is the mean and σ is the estimate of the standard deviation of the sample data set. The R6σ approach is based on the normal distribution assumption that the reference interval equals 6σ. Processes and performance indicators with comparatively large standard deviation will lead to a wider tolerance range (U–L), thus, increasing the likelihood of the process to perform within the specification limits and potentially higher performance indices.
3. Process quality comparison by basic statistical description and outlier analysis
3.1. Process comparison by performance indicators
The results of the basic statistical analysis for all seven performance indicators as well as actual mass density data before and after outlier analysis are presented in . Density variance is computed per plate to emphasize on the homogeneity of the impregnation of the plate from the inlet to the outlet side. In absolute values, the RTM-CL and RTM-HS plates have a similar average mass density of approximately 1.31 g/cm3. This is higher than the average mass density of VARI-CL and VARI-HS plates (1.26 g/cm3) due to the higher level of transverse compaction of the fabric preform in RTM compared to VARI. As a consequence, VARI plates have a lower fiber volume content (around 40% for VARI) compared to RTM plates (around 53%). The differences in fiber volume content were anticipated and accepted to compare the processes with the same amount of textile reinforcement (size and number of layers) in regards to process reproducibility and the influence of the inherently heterogenous bio-based materials on composite quality.
Table 2. Basic statistical results for the seven indicators to determine process performance and actual density values for VARI-CL, VARI-HS, RTM-CL, and RTM-HS processes before (in brackets) and after outlier removal.
As visible from the results in , the LCM process choice as well as the processing parameters significantly influence bio-based composite quality. For some indicators, the process choice is more decisive (tensile, flexural, and ILSS properties), whereas selected process parameters influence the results for impregnation duration and density variance primarily. While both RTM configurations have higher mean values in terms of tensile and flexural properties compared to the VARI configurations (an increase of up to 30%), VARI leads to a higher level of impregnation homogeneity from infusion inlet to outlet and potentially higher ILSS.
The different characteristics of the manufacturing processes are visible when comparing impregnation duration and homogeneity. RTM-HS has shorter injection cycles due to the decrease in resin viscosity as a function of higher tool temperature. At 100 °C, resin viscosity is significantly lower (22.5 ± 3 mPa s) than at 60 °C (104 ± 2.1 mPa s). At the same time, RTM-HS exhibits the highest variance in density variation. In comparison, VARI-HS requires an average of 46 sec additional impregnation duration but results in a decrease of mass density variance of approximately 29%. RTM-CL has a longer injection duration than VARI-CL at 60 °C tool temperature due to the higher compaction of the preform. The latter can also explain the greater density variance in RTM-CL, although the VARI plates have an uneven surface from the comparatively low level of transverse preform compaction and imprints of the peel ply.
The process choice is more influential than its parameters when analyzing mean density values, whereas variance data show that the CL configuration leads to lower variance compared to the HS configuration in both processes. No trend can be observed for density changes from inlet to outlet in VARI-CL, which can also be a result of the overall comparatively low variance of density for this process configuration. VARI-HS shows a tendency of decreasing density from inlet to outlet although the specimen closest to the inlet represents an exception from this trend. Concerning the highest density in RTM, there is no clear trend: The highest density in RTM-CL is either close to the inlet or in the middle of the plate, whereas in RTM-HS specimens in the middle of the plate (number three, four, and five counted from the inlet) exhibit highest density. There are various factors to explain the differences in average densities per process and variations from inlet to outlet: Relaxation of the laminate with increasing fluid pressure during the infusion, textile architecture, nesting effects, and flow-induced fiber-washout, as well as racetracking and its influence on pressure distribution affect local mass density and fiber volume content [Citation6, Citation7]. In addition to these explanations, it is important to note that the aim of the experimental setup was not the optimization of process parameters but to depict a range of potential scenarios. In the HS configurations, the fast curing of the resin can potentially lead to a more uneven impregnation in the direction of resin flow. Despite differences in actual density values from inlet to outlet, it is difficult to draw conclusions on influences on mechanical properties listed in . Further statistical analysis on correlation and interdependencies of variables is out of the scope of this study but will be subject to future research.
The influence of the process parameters (CL and HS) on tensile, flexural, and ILSS properties provides differentiated results. The CL configuration leads to comparatively higher tensile strength and flexural modulus (of up to 6% and 8% respectively), but HS process parameters can potentially lead to higher stiffness and ILSS (up to 4% and 6%). No trend can be observed concerning flexural strength: Flexural strength is 3% higher for VARI-HS compared to VARI-CL, but 8% lower for RTM-HS compared to RTM-CL.
A clear differentiation between process and material-induced variability is difficult. Differences in mean values result mainly from process and processing parameter selection, which influence the formation of macro and micro-voids and ultimately, mechanical properties [Citation19]. Additionally, variability within the specific process configuration can be attributed to inherent bio-based material heterogeneity. Although the standard deviations as absolute values vary, the percentual deviations from the mean value for material properties are similar when comparing processes and configurations (ranging from 3.3% for Young’s modulus for RTM-HS to 9.2% deviation from the mean for flexural modulus of VARI-CL). Additional sources of minor influence on deviations can also be cutting and placement of the textile reinforcement in the tool as well as variations during the manufacturing (e.g. vacuum quality, climate conditions in the laboratory, etc.). Other potential sources of variance are specimen preparation and testing. For tensile tests, the surface roughening and pressure applied during end-tab gluing can result in a wider spread of data. Additionally, imperfect positioning in the clamping system or three-point bending setup of the testing machines can lead to heterogeneous load distributions [Citation28]. Comparing sample sizes in before and after outlier removal, it is visible that the modulus is more sensitive towards irregularities such as human influence of positioning and fixing specimens during testing.
Fiber matrix adhesion as measured by ILSS is higher in VARI than in both RTM configurations. Interfacial adhesion is an important property, as it determines the composite’s response to different types of stress, but is still not perfectly understood [Citation29]. Natural fiber treatment and surface modifications are at the center of ongoing research to improve fiber-matrix adhesion and overall composite performance [Citation30]. Adhesion strength depends on various factors influencing the chemical bonds formed between the reactive groups on the fiber surface and the matrix material. Oun et al. [Citation31] found that ILSS of flax-fiber-epoxy composites decreases with elevated temperatures and also depends on additivation with nanoparticles. The in-depth investigation of fiber-matrix bonding mechanisms in the manufactured composites, their effects on ILSS, and their relationship with other material properties is out of the scope of this study but will be subject to future investigations.
3.2. Outlier analysis
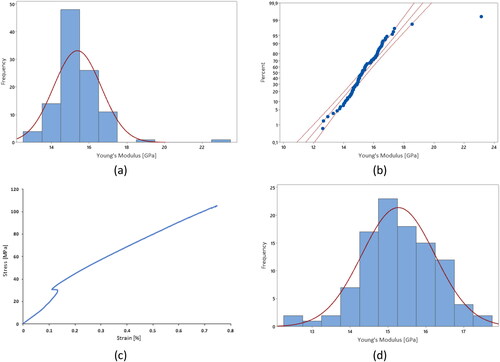
As visible in , the removal of outliers has the largest influence on variances per performance indicator and manufacturing processes. One data point from RTM-HS was removed from the injection duration data set due to a considerably longer degassing time of the resin, which can lead to premature formation of cross-links in the polymeric matrix and thus, higher viscosity. With respect to mass density, outliers were identified due to damage during the cutting of the specimens. Reasons for the elimination of data points from tensile, flexural, and ILSS tests were either related to specimen and extensometer slippage during testing or to specimen damage during preparation. Young’s and flexural moduli as well as ILSS are especially sensitive towards slippage and settling of the specimens. depicts the histogram (a), the probability plot (b) for the Gaussian normal distribution, and the stress-strain diagram (c) for Young’s modulus data of VARI-CL as an example for distribution testing, outlier detection, and outlier investigation. The stress-strain curve visibly shows the slippage of the specimen at approximately 0.12% strain. After the removal of the two outliers with specimen slippage, the p-value of the Anderson-Darling tests for the data set increased from <0.005 to 0.27 for the normal distribution, which is confirmed by the histogram after outlier removal (d).
Figure 3. Histogram (a) and probability plot for the normal distribution (b) before outlier removal in Young’s modulus data set of VARI-CL, stress-strain diagram for one of the detected outliers (c) and histogram of Young’s modulus data set of VARI-CL after outlier removal (d).
4. Process replicability comparison using performance estimates
4.1. Manufacturing process performance indices
The performance estimates for all four manufacturing processes vary depending on the choice of the performance indicator as visible in . Performance indices above 1.33 are considered acceptable capabilities in industrial applications [Citation32]. Applying this rule, all processes are capable using ILSS as an indicator. The data were fitted to the distribution with the highest p-value, which is also reported for each process and performance indicator. For most indicators, data fit the normal and three-parameter Weibull (3P Weibull) distribution except for flexural strength data in RTM-CL and Young’s modulus data in RTM-HS, where a loglogistic distribution exhibited the highest p-values. Young’s modulus data for RTM-CL has been fitted to a Largest Extreme (LE)-Value distribution (with a p-value of 0.2). The consequent PpkL and PpkU vary from 3.14 to 1.15. Pp, PpkL, and PpkU differ when process data are neither well-centered nor symmetric in relation to the specification limits. Pp and Ppk values are most similar to one another in VARI-CL because the data is less skewed and less tailed (in terms of kurtosis). For tensile, flexural, and ILSS properties, exceeding upper specification limits is less problematic than vice versa. On the other hand, for infusion/injection duration and density variance2, the process performance in relation to U is more important, as lower mass density as well as shorter impregnation duration is desired.
Figure 4. Pp, PpkL and PpkU values per performance indicator for VARI-CL manufacturing process (a), VARI-HS manufacturing process (b), RTM-CL manufacturing process (c), and RTM-HS manufacturing process (d) using the MD approach to determine specification limits including information on selected distributions and their p-values.
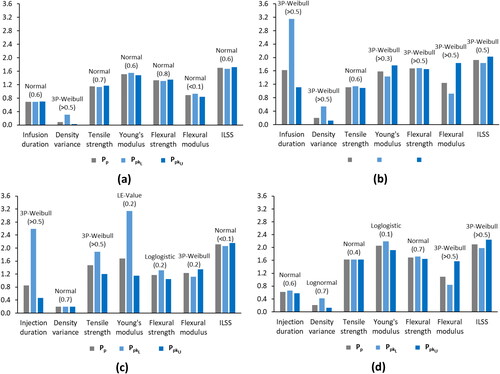
RTM-HS has the highest average Pp and Ppk values (with 1.34 and 1.25) as well as the highest individual values for tensile strength, Young’s modulus, and flexural strength. Short processing time generally leads to better processability of the selected inherently heterogeneous bio-based materials as VARI-HS similarly exhibits high average values for both process performance indicators (with 1.33 and 1.16). On the other hand, longer curing times lead to a potential decrease in process performance in terms of replicability despite resulting in comparatively better tensile and flexural properties of the composite. It is important to note that the selected manufacturing parameters were chosen to depict a range of processing scenarios and not to optimize the processing of the used material system. Injection and curing at 80 °C might lead to Pareto-optimal results concerning composite quality, processing time, and process replicability and reliability. Similarly, reducing the fiber volume and consequently, the thickness of the laminate can lead to a comparatively higher performance of VARI processes due to more homogenous heat distribution in the lay-up during infusion and curing.
Some performance indicators are less suitable to describe process performance. Minor differences in the preform (such as locally increased transverse compaction and thus, locally varying fiber volume fraction) and the environmental laboratory conditions influenced impregnation duration but did not impact the composite properties of the final product significantly. On the other hand, processing time is generally an important factor for economic performance. Increased processing time is perceived as a main challenge when using bio-based materials in an industrial context [Citation33]. Performance estimates concerning density variance are generally much lower than for all other performance indicators due to the exponentiation in calculating values based on standard deviation. This leads to a generally wider spread of data. For VARI processes, the rather low median of mass density variance in comparison to RTM processes is disadvantageous as it forms the basis for calculating the 25% specification limits. The median for density variance in VARI is also significantly lower than the mean for both VARI processes as visible in . If the Ppk value of mass density variance is not considered in calculating the average process performance, VARI-CL (average Ppk of 1.19) is more capable than RTM-CL (average Ppk of 1.17). For the HS-configurations, RTM remains on average more performant regardless of whether mass density is considered in the average. Using moduli as a performance indicator is also debatable as the modulus is more sensitive towards deviations that occurred during testing (such as specimen slippage, and extensometer positioning) and is not exclusively related to the manufacturing process or the material.
4.2. Influence of methodological choices
The different process capability results visible in are not only a consequence of manufacturing process differences and choice of performance indicator but also depend on methodological choices. The fit of the data to the selected distribution type and the choice of U and L play an especially important role. depicts Pp and Ppk values of the RTM-HS manufacturing process choosing ILSS data as the performance indicator for two different U and L values: following the MD approach and using the R6σ approach. Additionally, the results are computed for five statistically acceptable distribution types that all exhibit p-values significantly higher than the 0.05 confidence level chosen in the Anderson–Darling test for distribution identification.
Table 3. Performance estimates for ILSS data of RTM-HS process considering different distribution types and comparing the MD and the R6σ approach to determine specification limits.
In this case, the R6σ approach leads to much lower performance estimates than the MD approach due to the generally low standard deviation of the data set. The two methods to calculate specification limits have different approaches and objectives. The R6σ approach illustrates the ability of the process to reach the desired capability for normally distributed data. Thus, it prioritizes process replicability over composite quality. The MD approach calculates process capability that respects a desired tolerance. The latter is closer to the prevailing praxis for industrial quality control focusing on component quality that the process can deliver. For this study, the MD approach was more suitable as processes are not optimized but compared to each other in terms of replicability and reliability (under the premise that they will result in different composite properties). Nevertheless, the MD approach also has drawbacks by disadvantaging processes that exhibit lower values regardless of whether a low value is desired (as is the case in infusion/injection duration and mass density variance).
Similar to the choice of specification limit, the choice of distribution fit is both important and debatable. Depending on the selected distribution type, performance estimates can vary up to 80%. Normal or Weibull distributions were expected for all performance indicators except density variance. Other distributions can be explained by outliers that are statistically identified but remained within the sample size due to a lack of explanation justifying removal. For overall process performance comparison as visualized in , the distribution with the highest p-value has been selected and results in comparatively high Pp and Ppk values. Nevertheless, it is important to reflect on these choices when interpreting results.
5. Influence of annealing on composite quality and process capability
Overall, an additional annealing step after VARI-CL neither leads to an increase in composite quality nor to enhanced process performance (and homogenization) as visible in . Even after fiber drying there is remaining humidity in the natural fibers, which can damage the FRPC when heated above 100 °C [Citation34]. This effect also serves to explain the decrease in tensile and flexural strength of VARI plates and the comparatively low variance after annealing at 120 °C. Density variance and Young’s modulus are the only properties, which exhibit an improvement after annealing. The average increase of 3% for Young’s modulus can be attributed to material-inherent variance. The significant reduction of density variance of 52% after the annealing step suggests that annealing leads to a homogenization of individual plate quality, but has adverse effects on process performance.
Figure 5. Influence of annealing on material properties and Ppk values using MD approach in reference to VARI-CL results including information on selected distributions and their p-values for annealing data.
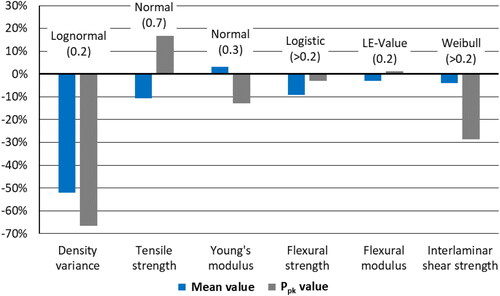
Besides mass density variance, the effect of annealing on process performance is most pronounced for tensile strength (+17%) and ILSS as process performance indicators (-29%). The two potential explanations for these differences are the nature of failure mechanisms and methodological choices in process performance analysis. The damage of tensile properties through annealing (average decrease in tensile strength of 11%) is more pronounced than the initial manufacturing process influence and thus, homogenizes process performance results. The failure mechanisms in ILSS vary locally [Citation31]. Thus, the damage of overall ILSS (−4%) caused by annealing amplifies existing bio-based material and process-induced variability. The influence of distribution selection and fit to the data has been demonstrated in Section 4.2. The p-value for the selected distribution to perform process performance analysis for the annealing ILSS data is significantly lower than the one for VARI-CL (>0.2 and 0.6, respectively).
6. Conclusion
Reflecting to the initial goal of this study to quantify the processability of the selected bio-based materials in LCM processes, results show that there is a trade-off between different process and composite properties, and process reproducibility per respective performance indicators. While RTM leads to comparatively higher tensile and flexural properties (of up to 30%), VARI plates exhibit higher fiber-matrix adhesion and more homogenous impregnation (of up to 13%). Operating processes at lower temperatures with longer curing time can potentially increase composite quality but has adverse effects on process performance and reproducibility (with an average decrease in process performance of 7% for all performance indicators). An additional annealing step is advantageous in regards to neither composite quality nor process performance.
A comparison with other studies on flax-fiber-thermoset composites shows that the achieved properties enable the usage of the composites in multiple semi-structural applications in the automotive, aviation, and civil engineering sectors [Citation33, Citation35, Citation36]. The composites manufactured in this study exceed the mechanical and ILSS properties reported by Haramina et al. [Citation37], which target applications in the nautical sector. Nevertheless, additional properties, such as water absorption and environmental resistance, need to be considered to determine suitability for this sector. VARI is more suitable for manufacturing large structures in low quantities, such as wind turbine blades, whereas RTM-HS is the better choice for sectors producing high quantities under time constraint, such as the automotive industry. Processing reliability and replicability (as demonstrated by process performance estimates) remain challenges in promoting bio-based composites at the industrial level. Advanced process control and optimization, as well as improvements in material production to achieve more homogenous quality, can help to overcome these challenges. Performance estimates do not only depend on processing and composite quality differences but also on methodological choices in statistical data analysis. Their application to industrial cases should therefore carefully (and in a transparent way) consider the choice of performance indicator, outlier analysis and removal, distribution selection and fitting, and determination of reference intervals.
In the presented research, process performance is described among seven performance indicators: infusion/injection duration, density variance, tensile strength, Young’s modulus, flexural strength, flexural modulus, and ILSS. Nevertheless, other important characteristics need to be considered to sufficiently describe and evaluate the processes. These include energy and resource consumption, economic parameters, and environmental performance. VARI processing requires less machinery and is more labor-intensive compared to RTM. On the other hand, RTM consumes more energy whereas VARI requires more single-use auxiliary equipment. Future research should investigate these factors and how they influence the environmental performance of the manufacturing processes to foster the bio-economy of FRPC.
Acknowledgements
This research was performed through funding of the Austrian Ministry for Climate Action, Environment, Energy, Mobility, Innovation and Technology within the frame of the project “QB3R” (project no. FO999889818) under the FTI initiative “Kreislaufwirtschaft 2021,” which is administered by the Austria Research Promotion Agency (FFG). Especially the support of project partner Manfred Sieberer of bto epoxy GmbH is kindly acknowledged.
Disclosure statement
No potential conflict of interest was reported by the authors.
Data availability statement
The authors confirm that the data supporting the findings of this study are available within the article. Raw data were generated at Montanuniversitaet Leoben, Department of Polymer Engineering and Science. Derived data supporting the findings of this study are available from the corresponding author on request.
References
- Mittal V, Saini R, Sinha S. Natural fiber-mediated epoxy composites – A review. Compos Part B: Eng. 2016;99:425–435. doi: 10.1016/j.compositesb.2016.06.051.
- Li M, Pu Y, Thomas VM, et al. Recent advancements of plant-based natural fiber–reinforced composites and their applications. Compos Part B: Eng. 2020;200:108254. doi: 10.1016/j.compositesb.2020.108254.
- Vinod A, Sanjay MR, Suchart S, et al. Renewable and sustainable biobased materials: an assessment on biofibers, biofilms, biopolymers and biocomposites. J Cleaner Prod. 2020;258:120978. doi: 10.1016/j.jclepro.2020.120978.
- Schillfahrt C, Fauster E, Schledjewski R. Influence of process pressures on filling behavior of tubular fabrics in bladder-assisted resin transfer molding. Adv Manufact Polym Compos Sci. 2017;3(4):148–158. doi: 10.1080/20550340.2017.1389048.
- Lunetto V, Galati M, Settineri L, et al. Sustainability in the manufacturing of composite materials: a literature review and directions for future research. J Manuf Processes. 2023;85:858–874. doi: 10.1016/j.jmapro.2022.12.020.
- van Oosterom S, Allen T, Battley M, et al. An objective comparison of common vacuum assisted resin infusion processes. Compos Part A: Appl Sci Manufact. 2019;125:105528. doi: 10.1016/j.compositesa.2019.105528.
- Bodaghi M, Costa R, Gomes R, et al. Experimental comparative study of the variants of high-temperature vacuum-assisted resin transfer moulding. Compos Part A: Appl Sci Manufact. 2020;129:105708. doi: 10.1016/j.compositesa.2019.105708.
- Struzziero G, Skordos AA. Multi-objective optimization of Resin Infusion. Adv Manufact Polym Compos Sci. 2019;5(1):17–28. doi: 10.1080/20550340.2019.1565648.
- Konstantopoulos S, Hueber C, Antoniadis I, et al. Liquid composite molding reproducibility in real-world production of fiber reinforced polymeric composites: a review of challenges and solutions. Adv Manufact Polym Compos Sci. 2019;5(3):85–99. doi: 10.1080/20550340.2019.1635778.
- Saadati Y, Lebrun G, Chatelain J-F, et al. Experimental investigation of failure mechanisms and evaluation of physical/mechanical properties of unidirectional flax–epoxy composites. J Compos Mater. 2020;54(20):2781–2801. doi: 10.1177/0021998320902243.
- International Organization for Standardization. Plastics—Determination of dynamic mechanical properties – Part 10: complex shear viscosity using a parallel-plate oscillatory rheometer, September 2015, 83.080.01 Plastics in general (6721-10:2015). [cited 2024 June 12]. Available from: https://www.iso.org/standard/62159.html.
- Zhang C, Li Y, Wu J. Mechanical properties of fiber-reinforced polymer (FRP) composites at elevated temperatures. Buildings. 2022;13(1):67. doi: 10.3390/buildings13010067.
- Ranjan N. Process capability analysis for fabrication of high elongated PVC polymer using extrusion process. Mater Today: Proc. 2022;48:1731–1734. doi: 10.1016/j.matpr.2021.10.040.
- International Organization for Standardization. Plastics—Methods for determining the density of non-cellular plastics—Part 1: immersion method, liquid pycnometer method and titration method, March 2019, 83.080.01 Plastics in general (1183-1:2019). [cited 2022 Mar 16]. Available from: https://www.iso.org/standard/74990.html.
- International Organization for Standardization. Plastics—Determination of tensile properties—Part 4: test conditions for isotropic and orthotropic fibre-reinforced plastic composites, December 2021, 83.120 Reinforced plastics (527-4:2021). [cited 2022 Mar 16]. Available from: https://www.iso.org/standard/80369.html.
- Adams DO, Adams DF. Tabbing guide for composite test specimens, 2002. Washington D. C.: U.S. Department of Transportation - Federal Aviation Administration.
- International Organization for Standardization. Fibre-reinforced plastic composites—Determination of flexural properties, March 1998, 83.120 Reinforced plastics (14125:1998). [cited 2023 Feb 15]. Available from: https://www.iso.org/standard/23637.html.
- International Organization for Standardization. Fibre-reinforced plastic composites—Determination of apparent interlaminar shear strength by short-beam method, December 1997, 83.120 Reinforced plastics (14130:1997). [cited 2023 Feb 15]. Available from: https://www.iso.org/standard/23642.html.
- Leclerc JS, Ruiz E. Porosity reduction using optimized flow velocity in Resin Transfer Molding. Compos Part A: Appl Sci Manufact. 2008;39(12):1859–1868. doi: 10.1016/j.compositesa.2008.09.008.
- International Organization for Standardization. Plastics—Standard atmospheres for conditioning and testing, May; 2008, 83.080.01 Plastics in general (291:2008). [cited 2023 Mar 9]. Available from: https://www.iso.org/standard/50572.html.
- Ryan B. LCC. Minitab® Statistical Software; 2023.
- Stephens MA, et al. Anderson-darling test of goodness of fit. Kotz S, editor. Encyclopedia of statistical sciences, 2nd edn. Hoboken, N.ew Jersey: Wiley; 2006.
- Rorabacher DB. Statistical treatment for rejection of deviant values: critical values of Dixon’s "Q" parameter and related subrange ratios at the 95% confidence level. Anal Chem. 1991;63(2):139–146. doi: 10.1021/ac00002a010.
- Grubbs FE. Procedures for Detecting Outlying Observations in Samples. Technometrics. 1969;11(1):1–21. doi: 10.2307/1266761.
- Chernick MR. A note on the robustness of Dixon’s ratio test in small samples. The American Statistician. 1982;36(2):140–140. doi: 10.1080/00031305.1982.10482812.
- International Organization for Standardization. Statistical methods in process management—Capability and performance—Part 4: Process capability estimates and performance measures’, August 2016, 03.120.30 Application of statistical methods (22514-4:2016). [cited 2022 Mar 3]. Available from: https://www.iso.org/standard/65289.html.
- Maurer O, Herter F, Bähre D. Tolerancing the laser powder bed fusion process based on machine capability measures with the aim of process control. J Manuf Processes. 2022;80:659–665. doi: 10.1016/j.jmapro.2022.06.031.
- Parmiggiani A, Prato M, Pizzorni M. Effect of the fiber orientation on the tensile and flexural behavior of continuous carbon fiber composites made via fused filament fabrication. Int J Adv Manuf Technol. 2021;114(7-8):2085–2101. doi: 10.1007/s00170-021-06997-5.
- Zhou Y, Fan M, Chen L. Interface and bonding mechanisms of plant fibre composites: an overview. Compos Part B: Eng. 2016;101:31–45. doi: 10.1016/j.compositesb.2016.06.055.
- Khanam PN, AlMaadeed MAA. Processing and characterization of polyethylene-based composites. Adv Manufact Polym Compos Sci. 2015;1(2):63–79. doi: 10.1179/2055035915Y.0000000002.
- Oun A, Manalo A, Alajarmeh O, et al. Influence of elevated temperature on the mechanical properties of hybrid flax-fiber-epoxy composites incorporating graphene. Polymers (Basel). 2022;14(9):1841. doi: 10.3390/polym14091841.
- Mahapatra APK, Song J, Shao Z, et al. Concept of process capability indices as a tool for process performance measures and its pharmaceutical application. J Drug Delivery Ther. 2020;10(5):333–344. doi: 10.22270/jddt.v10i5.4288.
- Andrew JJ, Dhakal HN. Sustainable biobased composites for advanced applications: recent trends and future opportunities – a critical review. Compos Part C: Open Access. 2022;7:100220. doi: 10.1016/j.jcomc.2021.100220.
- Resch-Fauster K, Džalto J, Anusic A, et al. Effect of the water absorptive capacity of reinforcing fibers on the process ability, morphology, and performance characteristics of composites produced from polyfurfuryl alcohol. Adv Manufact Polym Compos Sci. 2018;4(1):13–23. doi: 10.1080/20550340.2018.1436234.
- Koronis G, Silva A, Fontul M. Green composites: a review of adequate materials for automotive applications. Compos Part B: Eng. 2013;44(1):120–127. doi: 10.1016/j.compositesb.2012.07.004.
- Santamala H, Livingston R, Sixta H, et al. Advantages of regenerated cellulose fibres as compared to flax fibres in the processability and mechanical performance of thermoset composites. Compos Part A: Appl Sci Manufact. 2016;84:377–385. doi: 10.1016/j.compositesa.2016.02.011.
- Haramina T, Hadžić N, Keran Z. Epoxy resin biocomposites reinforced with flax and hemp fibers for marine applications. JMSE. 2023;11(2):382. doi: 10.3390/jmse11020382.