
Abstract
Aim: The aim of the present study is to develop a liquid chromatography-mass spectrometry method to measure two important biomarkers of biotin deficiency from dried blood spot samples for effective management of the disorder. Materials & methods: The method was developed on a liquid chromatography-mass spectrometry system using pentafluorophenyl column employing a mobile phase composition of methanol and water in the isocratic mode. A full validation of the method was performed as per relevant guidelines. Results & conclusion: Correlation between the results of dried blood spot and plasma method was evaluated to determine the interconvertibility of the method. The developed method was successfully applied for establishing the reference ranges for these biomarkers in the population of Udupi, a coastal district of South India.
Plain language summary
Biotin deficiency can lead to many complications such as impaired growth, compromised immune function, depression, myalgia and may even lead to death. The disorder can be managed by supplementation of biotin. Early detection is crucial in managing biotin deficiency. In this paper we describe a comprehensive method for the early detection of biotin deficiency. The method employs the use of minimally invasive blood sampling such as dried blood spot that is suitable for vulnerable neonatal population.
GRAPHICAL ABSTRACT
Scope
The LC-MS method targets the simultaneous determination of 3-hydroxyisovaleric acid (3-HIV) and 3-hydroxyisovaleryl carnitine (3-HIC) in dried blood spots (DBS), providing a comprehensive analysis for diagnosing and preventing biotin deficiency in newborns and infants.
Method characteristics
Simple, selective, rapid, specific and highly sensitive.
Validation
The method was validated for accuracy, precision, recovery, matrix effect, hematocrit effect, stability and blood volume/punch position effects.
Quantification
High linearity (R2 >0.99), good sensitivity (LLOQ 0.088 μM and 0.040 μM for 3-HIV and 3-HIC respectively). Recovery of QC samples was within acceptable limits for both analytes.
Interconvertibility of DBS vs. plasma results
Strong correlation and minimal bias were found between DBS and plasma measurements.
Population application
Applied successfully for establishing reference ranges in the population of Udupi, South India. 3-HIV (0.06–18.59 μM) and 3-HIC (0.01–0.49 μM) in Udupi population.
Clinical significance
The newly developed method is a promising tool for confirmatory diagnosis of biotin deficiency in a clinical setting.
1. Background
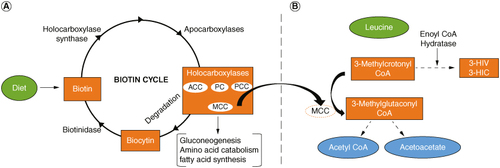
Biotin is a water-soluble vitamin essential for all living organisms. It serves as a cofactor for carboxylase enzymes crucial in various metabolic activities, including gluconeogenesis, fatty acid synthesis and branched-chain amino acid catabolism [Citation1–5]. The biotin cycle depicting the role of various enzymes and the intermediates in the metabolic process is shown in A. Biotin deficiency can lead to multiple carboxylase deficiency (OMIM: #253270), resulting in neurological disorders, metabolic disturbances, impaired growth, compromised immune function, depression, myalgia, skin problems, hair thinning and may even lead to coma and death in severe deficiency [Citation6–8]. Biotin deficiency can arise from various factors, including genetic disorders affecting biotin metabolism, chronic alcohol exposure, consumption of raw egg whites over time, pregnancy and long-term anticonvulsant therapy [Citation9–11].
Figure 1. The interrelationship between biotin deficiency and the production of markers 3-HIV and 3-HIC. (A) The biotin cycle. A deficiency in biotin can lead to deficiency in production of MCC. (B) Lucine catabolism. A deficiency in MCC results in the accumulation of 3-Methylcrotonyl CoA and higher levels of 3-HIV and 3-HIC.
3-HIV: 3-hydroxyisovaleric acid; 3-HIC: 3-hydroxyisovaleryl carnitine; ACC: Acetyl-CoA carboxylase; MCC: 3-methylcrotonyl CoA carboxylase; PC: Pyruvate carboxylase; PCC: Propionyl-CoA carboxylase.
Early detection and proper testing are crucial for managing biotin deficiency, with supplementation and dietary adjustments being the mainstay of treatment [Citation5,Citation12,Citation13]. Lifelong supplementation may be necessary for genetic disorders, accompanied by regular medical monitoring for biotin deficiency. The frequency of testing for biotin deficiency will vary depending on the severity of symptoms, individual's age, overall health and the response to the treatment. Neonates have a dynamic body physiology and pharmacokinetics which necessitates frequent monitoring to ensure sufficient biotin levels [Citation14,Citation15]. Newborns with genetic disorders predisposing them to biotin deficiency require frequent monitoring, typically every 1–2 weeks until they reach 6 months old. Adults, pregnant women and breastfeeding women may also need periodic monitoring based on their health status and response to treatment [Citation16,Citation17].
Detecting biotin deficiency presents challenges, with various methods available including direct biotin analysis, measurement of enzyme activity (biotinidase and carboxylase) and assessment of metabolites indicative of biotin deficiency [Citation18–20]. Direct biotin analysis in biological fluids is unspecific and insensitive as it contains biotin metabolizing enzymes and proteins that can interfere in the measurement process [Citation5,Citation9]. While some newborn screening programs include measurement of biotinidase activity, the carboxylase activity assessment is not included [Citation17]. Consequently, relying solely on biotinidase activity measurement may not reliably indicate biotin status. A more promising approach involves measuring metabolites that are elevated in biotin-deficient individuals [Citation21–26]. Two such metabolites are, 3-hydroxyisovaleric acid (3-HIV) and 3-hydroxyisovaleryl carnitine (3-HIC), which gets elevated in the absence of 3-methylcrotonyl-CoA carboxylase (MCC), which is produced in the biotin cycle. A deficiency in MCC will lead to elevation in the levels of these markers (B). By quantifying these metabolites, clinicians can obtain a more accurate assessment of biotin deficiency, facilitating timely intervention and management. Our study specifically focuses on simultaneously measuring 3-HIV and 3-HIC as biomarkers for early biotin deficiency detection, particularly targeting high-risk groups like newborns and pregnant women.
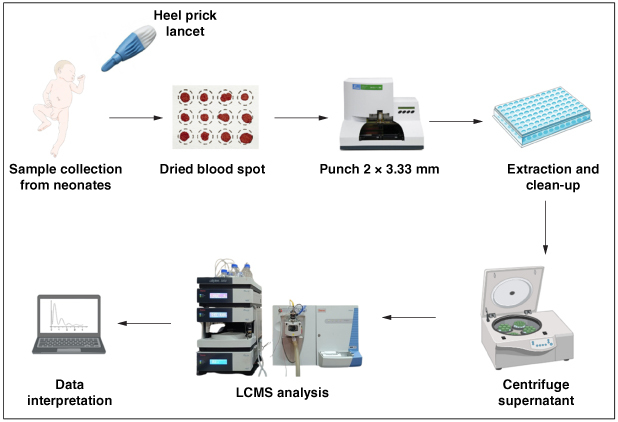
To facilitate frequent monitoring in neonates, dried blood spot (DBS) sampling is preferred since it is less invasive than venous sampling [Citation27–34]. In our research, we developed and validated a liquid chromatography-mass spectrometry (LC-MS) method for quantifying simultaneously, 3-HIV and 3-HIC from DBS samples. The reference ranges for these biomarkers in our population was also established in this study.
2. Materials & methods
2.1. Chemicals, reference standards & reagents
3-Hydroxyisovaleric acid (3-HIV, purity ≥95%), 3-hydroxyisovaleryl-L-carnitine (3-HIC, purity ≥90%) 3-hydroxyisovaleryl-L-carnitine-(N-methyl-d3) (3-HIC-d3, purity ≥90%) and formic acid AR grade (purity >85%) were purchased from Sigma-Aldrich (MO, USA). Methyl malonic acid (methyl-d3) (MMA-d3, purity ≥98%) was purchased from Cambridge isotopes laboratories (MA, USA). MMA-d3 and 3-HIC-d3 were the internal standards for 3-HIV and 3-HIC, respectively. LC-MS grade methanol was purchased from Merck India Ltd (Bangalore, India). The purified water (MilliQ) was generated in house. Luna PFP (2) 100 Å (50 mm × 4.6 mm, 3 μm) column was purchased from Phenomenex (CA, USA).
2.2. Instrumentation
A Thermo Scientific (MA, USA) LC-MS with Dionex Ultimate 3000 liquid chromatograph hyphenated with an LTQ XL linear ion trap mass spectrometer was used. A heated electron spray ionization (HESI) was used as the ion source. MS/MS and chromatographic method development was performed using Xcaliber (MA, USA) and Chromeleon (MA, USA) software, respectively.
2.3. Preparation of standard solutions
Stock solutions (1 mM) of both the analytes (3-HIV and 3-HIC) and their internal standards (MMA-d3 and HIC-d3) were prepared in methanol. Working stocks of concentration 100 μM were prepared in 50:50 v/v methanol: water and stored at -20°C until use. Calibration solutions were prepared for 3-HIV and 3-HIC in the range of 0.088 to 22.429 μM and 0.040 to 10.141 μM, respectively. Quality control samples (LQC, MQC and HQC) were prepared at 0.264, 11.215 and 16.822 μM concentrations for 3-HIV and 0.119, 5.071 and 7.606 μM concentrations for 3-HIC. Calibration and quality control (QC) working solutions were mixed with leftover blood from healthy controls (hematocrit of 50%) at a ratio of 1:40 (% v/v). DBS calibrators and QCs were prepared by pipetting 40 μl of the blood mixtures onto Whatman 903 filter paper. Prior to the analysis, DBS cards were left to dry at room temperature for 3 h. Plasma was prepared by centrifuging the human whole blood collected in K2 EDTA tubes. Calibration standards and quality control samples were prepared by spiking pooled plasma with respective working standards of 3-HIV and 3-HIC. Internal standard solutions were prepared at a concentration of 0.5 μM.
2.4. Sample collection & processing
The institutional ethics committee of Kasturba Medical College, Manipal, granted approval for the study (MUEC/010/2017 dated 8 May 2017, MAHE EC/Renewal-02/2018 dated 10 May 2018, and IEC 303/2019 dated 15 May 2019). For the determination of reference ranges of the biomarkers, DBS sampling from 350 neonates was done by certified medical professionals after 48 h of birth in Kasturba Hospital, Manipal, India. Informed consent from parents was obtained before sampling. For analytical method development, leftover blood collected in EDTA-coated vacutainers were used. For the preparation of DBS, 40 μl of blood was spotted onto Whatman 903 filter paper. The DBS samples were dried and stored at -80°C for further analysis. The remaining blood was converted to plasma by centrifuging at 5758× g at 4°C and stored at -80°C until further analysis.
Plasma samples were thawed unassisted to room temperature before processing them for analysis. Added 20 μl of the IS solution to 180 μl of plasma and vortexed for 2 min. To denaturize the protein, methanol was added to the sample in 1:3 ratio followed by vortexing it for another 2 min. Final content was centrifuged at 9392× g, at 4°C for 10 min and 10 μl of supernatant was injected to LC-MS system.
For processing DBS samples, two DBS discs of 3.2 mm (2 × 3.2 mm) were punched into a 96-well plate (1.2 ml volume). To this was added 20 μl of working standard solution of IS prepared in methanol: 0.1% formic acid buffer (75:25 v/v). Extraction was performed using protein precipitation technique by adding 100 μl of methanol and 170 μl of water and keeping it for 2 h. The contents of the 96-well plate were sonicated for 2 min at 25°C and transferred to 0.5 ml microcentrifuge tube and centrifuged at 9392× g at 4°C for 10 min and 30 μl of supernatant was injected to LC-MS system.
2.5. Chromatographic & mass spectrometric conditions
The chromatographic separation was performed using Luna PFP (2) 100 Å (50 mm × 4.6 mm, 3 μm) column purchased from Phenomenex (CA, USA). Mobile phase was a mixture of 25 mM formic acid (FA) in methanol: 25 mM FA in water (55:45), pH adjusted to 6.7 using 1% formic acid. The flow rate was set at 0.3 ml/min. The column and autosampler temperature were maintained at 30 and 4°C, respectively. Total run time was 10 min. The mass spectrometer was operated in positive/negative switching mode with selected reaction monitoring (SRM). The electrospray ionization (ESI) used a spray and capillary voltage of 4.12 and 35 V, respectively; vaporizer and ion transfer capillary temperature were 300 and 350°C, respectively; and nitrogen sheath gas, auxiliary gas and sweep gas flow were 40, 15 and 1 arbitrary units, respectively. The SRM transitions and the respective collision energy (CE) used for the biomarkers and the internal standards were as follows: 3-HIV (m/z 117.21 → 58.75, MOI: (-) CE: 35 eV), 3-HIC (m/z 262 → 84.93, MOI: (+) CE: 35 eV), MMA-d3 (m/z 120.86 → 76, MOI: (-) CE: 35 eV) and HIC-d3 (m/z 265.30 → 85, MOI: (+) CE: 35 eV).
2.6. Method validation
The developed LCMS analytical method was validated for its accuracy, precision, linearity and recovery as per the recommendations of ICH M10 Bioanalytical method validation guideline. Linearity, recovery and accuracy were assessed using the blank subtraction technique, where endogenous analyte levels in healthy control blood samples were determined via the standard addition method. This enabled subtraction of the endogenous analyte to internal standard (IS) ratio from the spiked DBS analyte to IS ratio. Regression analysis was then conducted on the resultant subtracted area ratio versus analyte concentration plot. The percent nominal for each level was calculated. Linearity experiments were carried out in five batches, each comprising blank, zero and ten nonzero samples. Accuracy evaluations were performed at different QC levels (LLOQ, LQC, MQC and HQC) by comparing mean calculated values (post endogenous subtraction) to nominal concentrations. Extraction recovery and matrix effect were assessed at varying QC levels using comparisons with neat standard solutions and post-extraction spike techniques, respectively, to ensure the method's robustness and reliability [Citation35–37].
2.6.1. Evaluation of dilution integrity
Dilution integrity was assessed to verify the ability of analyte concentrations exceeding the upper limit of quantification (ULOQ) in actual samples to be accurately back-calculated to their original levels. The dilution integrity QCs were prepared in plasma and DBS (n = 5) at concentrations of 44.858 μM and 20.282 μM, respectively, for 3-HIV and 3-HIC. Following extraction of the analytes from the samples, serial dilution was performed at a ratio of 1:5 on the final extracts by adding an appropriate volume of plasma [Citation38]. Subsequently, the samples underwent processing and analysis as previously described, and back calculated the concentrations of the dilution QCs. Five repeat injections were performed at each QC level. As per ICH M10 guideline, the precision and accuracy of the back calculated dilution QCs should not deviate beyond ±15%.
2.6.2. Assessment of relative matrix effects
To investigate the influence of various components within plasma and DBS matrices on the mass spectrometric ionization responses of 3-HIV and 3-HIC, we spiked both drugs at calibration ranges (3-HIV: 0.08–22.429 μM and 3-HIC: 0.04–10.141 μM) into blood and plasma obtained from five different healthy neonates. Each concentration point per blood sample was analyzed once by LC-MS, resulting in a total sample size (n) of 5 at each concentration level. Standard curves were constructed for each blood sample by fitting the obtained data to a straight line using 1/x2 weighted least squares. To evaluate relative matrix effects, the standard lines were generated using five different lots of biofluid. For the assay to be considered free of relative matrix effects, the slopes of the standard lines obtained for each lot of biofluid should not exceed 3–4% (relative standard deviation) and each individual concentration point should vary less than 15% across all five lots of biofluid, except at the lower limit of quantitation where 20% is acceptable [Citation39].
2.6.3. Hematocrit effect
According to gestational age and clinical settings, the HCT (hematocrit) in newborns varies from 28 to 65% within the first 28 days after birth [Citation40]. The distribution of blood on the DBS card is significantly influenced by the HCT in DBS-based analysis, which introduces assay bias [Citation41,Citation42]. Hence, extra care is taken while analyzing DBS samples to reduce bias. The viscosity of whole blood is influenced by its HCT concentration, and this in turn affects the size of the DBS spot, and thus the concentration of the analyte. To prepare various hematocrit levels, red blood cells (RBCs) and plasma were separated through centrifugation. Then, appropriate volumes of plasma were added or removed to achieve the desired ratios. The process was repeated, adjusting volumes accordingly, to obtain hematocrit levels ranging from 30 to 65% [Citation43]. The impact of altering HCT levels on the test was examined at eight HCT levels (30, 35, 40, 45, 50, 55, 60 and 65%) with concentrations at LQC and HQC and checking the consistency in analytical results.
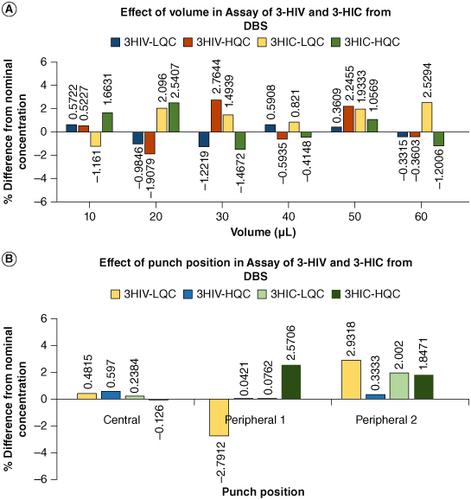
2.6.4. Effect of blood volume & punch position
The impact of blood volume on the spot size and test was evaluated by applying 10–60 μl of whole-blood samples in five duplicates at LLOQ, LQC, MQC and HQC on the DBS and checking the consistency in the analysis results [Citation42]. Similarly, the effect of punch position on the analysis results were evaluated by punching discs from the center and periphery of the blood spot. The DBS sample collection criteria were adhered to during the clinical sample collection and processing. Low-quality samples like circles without blood, filter paper without saturation, filter paper damage, stacked specimens, contamination, serum rings and clotted specimens were rejected [Citation44].
2.6.5. Stability studies
Benchtop stability was evaluated on LQC and HQC samples stored at room temperature (25°C) for 2, 4 and 8 h. Stability of sock solution on storage at (2–8°C) was evaluated on six replicates of freshly prepared MQC samples for 2, 4, 6 and 8 h. Processed sample stability in autosampler was evaluated at 4°C for 6, 12, 24 and 48 h on LQC and HQC samples. For the freeze–thaw stability study, LQC and HQC samples were subjected to three freeze–thaw cycles at -80°C. After each freeze–thaw cycle, the samples were thawed unassisted at room temperature and analyzed. The long-term stability of analytes in DBS and plasma at -80°C was studied for a duration of up to 360 days to assess the reliability of DBS samples for biobanking and retrospective analyzes. LQC and HQC samples were stored at -80°C and analyzed at 30, 60, 90, 180 and 360 days. On the day of analysis, samples were thawed unassisted at room temperature and analyzed. The mean, standard deviation and percent change were calculated for each study and evaluated the stability.
2.7. Evaluation of interconvertibility between the plasma & DBS assay
To evaluate the interconvertibility of the results obtained from DBS and plasma, we compared the concentrations of 3-HIV and 3-HIC measured in DBS specimens with that of the plasma. Residual blood from 15 anonymous adults was collected from the department of Biochemistry, Kasturba Medical College, Manipal. DBS card was prepared by spotting 40 μl of blood on to the 903 paper and the rest was centrifuged to get plasma. The plasma and DBS samples were analyzed and the concentration of 3-HIV and 3-HIC in both the matrices were calculated. Pearson correlation coefficient and linear regression equation were used to predict the concentration in plasma that is corresponding to the concentration in the DBS. Further, Bland-Altman comparison was made between the concentration determined from both the matrices to evaluate the distribution of measurements from the mean at 95% CI.
2.8. Determination of reference ranges for the biomarkers 3-HIV & 3-HIC
Using the validated method, we analyzed 350 DBS samples to build a reference range for analytes in the healthy newborn population of Udupi, a coastal district in South India. We included healthy term neonates on breast feeding, born between 37 and 42 weeks of gestation, with birth weight greater than 2500 g, with or without physiological jaundice and born by both caesarean and vaginal delivery. We excluded neonates with asphyxia, those requiring IV fluids, and neonates with congenital malformations. The reference intervals for the metabolites in DBS, calculated using the nonparametric percentile method with a 95% CI, are reported in terms of 2.5th to 97.5th percentiles.
2.9. Greenness of analytical procedure
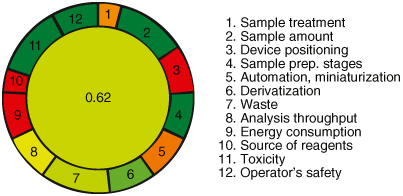
The greenness of the proposed analytical method was evaluated using the AGREE software (Analytical GREEnness Metric Approach and Software) [Citation45]. This approach considers twelve criteria, each assigned a score between 0 and 1, with higher values indicating a more environmentally friendly method. Details of these criteria, their weightings, and assigned values are provided in the Supplementary Materials. To evaluate the environmental impact, parameters related to the use of toxic substances, waste generation and resource utilization were assessed against predefined criteria. Penalty points were assigned based on the method's adherence to each criterion, resulting in a final score represented at the center of a circular pictogram. In this pictogram, criteria where the method aligns ideally with green principles are colored green, while areas deviating from these principles are marked red. Intermediate responses fall between these extremes and are graded accordingly.
3. Results & discussion
3.1. LC-MS/MS method
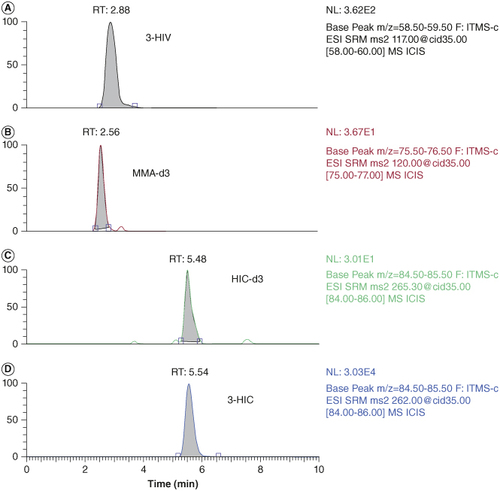
The biomarker, 3-HIV (Molecular weight: 118.13 g/mol) has three hydrogen bond acceptors and two hydrogen bond donors. It has a logP value of 6.3 and pKa value of 4.55. Similarly, 3-HIC (molecular weight: 261.31 g/mol) has four hydrogen bond acceptors and one hydrogen bond donor. It has a logP value of -4.3 and pKa value of 4.21. As can be seen from the physicochemical properties of 3-HIV and 3-HIC, both analytes are polar having slight lipophilic properties. The structures of 3-HIV and 3-HIC are shown in . Accordingly, a reversed phase Luna PFP (2) column has been selected as the stationary phase. The PFP (2) column has the pentafluorophenyl group bonded to the trimethyl silane skeleton and provides sufficient selectivity to 3-HIV and 3-HIC. A mobile phase composition of 55:45 methanol and 0.1% formic acid in water (pH 6.7) was found to be well suited for the separation of these biomarkers. Based on the pKa values of these analytes, a pH of 6.7 was selected for the mobile phase. Methanol provides sufficient level of lipophilicity for retention of the analytes on the column, while the 0.1% formic acid containing aqueous phase helps to keep the analytes ionized and makes the mobile phase sufficiently hydrophilic. This combination of mobile phase composition helped to improve the resolution of the separation. A simple isocratic elution gave good resolution between the biomarkers and their respective internal standards. A lower flow rate of 0.3 ml/min allowed more time for the analytes to interact with the stationary phase and for the separation. The retention time of these analytes were observed at 2.88, 5.54, 2.56 and 5.48 min for 3-HIV, 3-HIC, MMA-d3 and HIC-d3, respectively. Chromatogram of the 3-HIV and 3-HIC along with their respective internal standards is provided in .
Figure 2. Structure of 3-hydroxyisovaleric acid (3-HIV) and 3-Hydroxyisovaleryl carnitine (3-HIC).
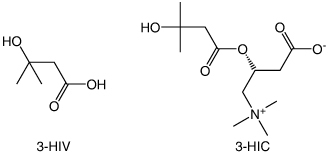
Figure 3. LCMS Chromatograms of the analytes and internal standards obtained in spiked DBS. (A) 3-HIV at MQC (RT: 2.88 min), (B) MMA-d3 at 0.05 μM (RT 2.56 min), (C) 3-HIC-d3 (RT 5.48 min) at 0.05 μM and (D) 3-HIC at MQC (RT 5.54 min).
RT: Retention time.
3.2. Method validation
3.2.1. Accuracy & precision
Six replicates of QC samples were injected at LLOQ, LQC, MQC and HQC to assess accuracy and precision within the run. Three separate runs for accuracy and precision over successive days were carried out to establish between-run accuracy and precision. An acceptable limit of ±15% accuracy (±20% for LLOQ) and ≤15% CV precision was used to evaluate the bias of calculated concentrations with the nominal concentrations of QCs. Prior to each accuracy and precision run, a linearity run was performed to check for compliance with the acceptance limit as indicated in the linearity range. The accuracy and precision data as depicted in fall within the acceptable range.
Table 1. Accuracy, precision and recovery data of 3-HIV and 3-HIC.
3.2.2. Linearity & LLOQ
Calibrators of 3-HIV and 3-HIC were prepared in the range of 0.08–22.429 μM and 0.04–10.141 μM concentrations. Three independent calibration curves (CC) were plotted on three different days. By using the software XCalibur and the weighing factor 1/x2, the slope and intercept of the linearity curves were calculated. For the plasma method, the calibration equation and the correlation coefficient (R2) for 3-HIV were y = 0.3366x + 0.0977 and 0.9958, respectively, while for 3-HIC these were y = 0.6066x + 0.0791 and 0.9936. For DBS method, these were y = 0.3515x + 0.0127 (R2 = 0.9924) and y = 0.3447x + 0.0133 (R2 = 0.9919), respectively, for 3-HIV and 3-HIC. The correlation coefficients obtained were within the specified limits proving the linearity of the method. A summary of the findings is provided in Supplementary Table S1. The back-calculated concentrations of calibrator standards were within 20% of the nominal concentration for LLOQ and within 15% for the other CC standards, confirming the suitability of the technique within the tested range.
3.2.3. Recovery
Recovery study was carried out to evaluate the degree and uniformity of analyte and IS extraction from the matrix. Recovery was evaluated using the direct area-to-area comparison method with an acceptance limit of 10% coefficient of variation from mean recovery, pre and post-extraction after spiking QC and IS working standards in five replicates at LQC and HQC [Citation46]. The mean recovery of 3-HIV from plasma and DBS samples were found to be 81 and 67%, respectively, while for 3-HIV, the recovery values were 84 and 65%. The breakdown of plasma and DBS recovery at various quality control levels is presented in the . Recovery from plasma was found to be better than that from DBS. Recovery was found to be reproducible with the %CV at all levels within the acceptance limits.
3.2.4. Dilution integrity
The integrity of dilution on the analysis results needs to be evaluated if the method measures diluted samples. Accordingly, the impact of dilution procedure on the accuracy and precision of the method was evaluated. The assessment of dilution integrity revealed that the dilution process had no significant impact on the accuracy or precision of the analysis for either plasma or DBS matrices. The mean calculated concentrations of 3-HIV (43.12 μM for plasma and 42.19 μM for DBS) and 3-HIC (17.38 μM for plasma and 17.39 μM for DBS) fell within the expected ranges, indicating the effectiveness of the dilution process in bringing the spiked samples within the measurable range without compromising accuracy. Moreover, the accuracy of determination exceeded acceptable limits, with values of 96.0 and 103.4% for 3-HIV and 3-HIC, respectively, in plasma, and 94.8 and 96.97%, respectively, in DBS. Precision, as indicated by %CV, was within acceptable limits (3-HIV: 2.21% and 3-HIC: 2.20% in plasma; 3-HIV: 2.94% and 3-HIC: 0.71% in DBS).
3.2.5. Relative matrix effects
In our validation study, we found that the slopes of the standard lines determined for the five different blood samples varied by only <1.2%, as detailed in Supplementary Table S3. This minimal variation suggests a consistent response across different lots of biofluid, indicating the absence of significant relative matrix effects. Additionally, the precision of the individual concentration points fell within the acceptable range of 15%, as indicated in Supplementary Table S4. This further supports the robustness of the assay and its ability to reliably quantify analyte concentrations across different biofluid lots. Based on these findings and adhering to generally accepted criteria, our assay can be considered free of relative matrix effects. This suggests that any observed variations in ionization responses are attributed to the analytes themselves rather than differences in the biofluid matrices. Consequently, our assay provides a reliable method for accurately quantifying 3-HIV and 3-HIC concentrations in both plasma and DBS matrices, enhancing its applicability in clinical and research settings.
3.2.6. Effect of HCT, blood volume & punch position
The effect of HCT at the studied levels of 30, 35, 40, 45, 50, 55, 60 and 65% on the analysis results evaluated at LQC and HQC concentrations have shown that the back calculated results were within the accuracy level of 15% and precision not more that 15% (CV). The results demonstrated that hematocrit effect is not influencing the analysis accuracy of 3-HIV and 3-HIC. This is very valuable considering the applicability of the method for testing neonates who have dynamic body physiology. The results are depicted in . Results of effect of blood volume and punch position are presented in A & B respectively. The difference from nominal concentration was within ±3% indicating that the blood volume and punch position does not influence the analysis results.
Figure 4. Histograms representing the effect of hematocrit on the DBS assay results of 3-HIV and 3-HIC.
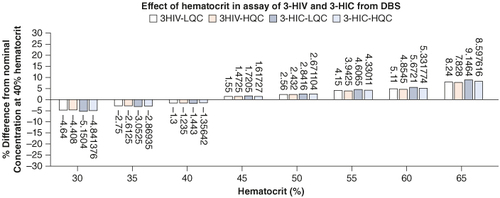
Figure 5. Effect of blood volume and punch position. (A) Histogram representing the effect of blood volume on the DBS assay results of 3-HIV and 3-HIC. (B) Histogram representing the effect of punch position on the DBS assay results of 3-HIV and 3-HIC.
3.2.7. Stability
Extensive stability studies for the biomarkers at different stress conditions recommended by US FDA were performed. The results are presented in . The analytes were found to be stable in stock solution prepared in methanol stored in the refrigerator for 8 h with a percent change within 5% from the baseline value. The benchtop stability was relatively constant over time, with a slight decrease (<5%) in stability over the course of the 8 h test. Freeze–thaw stability studies for both the analytes demonstrated a percent change within 10%. These observations are well within the acceptance limit of ±15% denoting stability. The study on the influence of resident time in the autosampler maintained at 4°C demonstrated a change which was within 5% both at LQC and HQC levels for both the analytes up to 48 h. Long term stability studies at -80°C for a period of 360 days demonstrated a percent change within 7% at both LQC and HQC levels, for both the biomarkers in DBS and plasma, which is within the recommended limits of ±15%.
Table 2. Results of stability studies of 3-HIV and 3-HIC at various stability conditions.
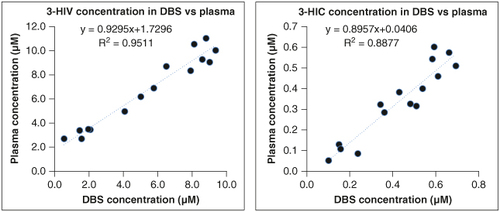
3.3. Evaluation of interconvertibility between the plasma & DBS assay
To elucidate the relationship between DBS and plasma concentrations, we employed the Pearson correlation coefficient and derived linear regression equations for both analytes (). The obtained equations and corresponding R2 values provide pivotal insights into the accuracy and reliability of translating DBS concentrations to their plasma counterparts. For 3-HIV, the regression equation y = 0.8374x – 0.0327 with an R2 value of 0.951 signifies a strong linear relationship between DBS and plasma concentrations. Similarly, the equation y = 1.1201x + 0.1417 with an R2 value of 0.887 for 3-HIC corroborate the robustness of the relationship between the two matrices. These findings highlight the vital role of the derived equations and correlation values in facilitating the interpretation and utilization of DBS data, affirming their utility in clinical and research settings. They serve as valuable tools for predicting plasma concentrations based on DBS measurements, thereby enhancing the efficiency and feasibility of utilizing DBS as a surrogate matrix for plasma analysis.
Figure 6. Linear regression analysis of concentration in DBS versus plasma of 3-HIV and 3-HIC.
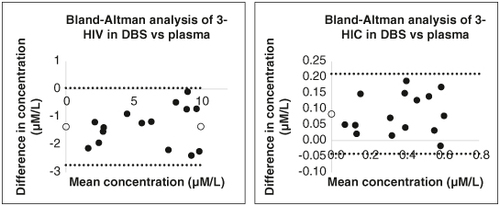
Bland-Altman analysis of the results of DBS and plasma methods showed mean ± SD values of 5.3814 ± 3.1943 and 0.3362 ± 0.1827 μM in DBS compared with 6.7317 ± 3.0446 and 0.4206 ± 0.1922 μM in plasma for 3-HIV and 3-HIC, respectively. The analysis showed a mean bias of -1.35015 and 0.0844 for 3-HIV and 3-HIC, respectively. This means that the DBS concentrations were slightly underestimated for 3-HIV and slightly overestimated for 3-HIC. However, the bias was relatively small, and the 95% limits of agreement were narrow, indicating that the two methods are well-aligned. The Bland-Altman analysis plots for 3-HIV and 3-HIC are illustrated in . Overall, the data suggests that DBS and plasma results are interconvertible. This is significant because it provides a new, minimally invasive blood collection option for populations where venous blood collection is difficult or impossible, as in neonates.
Figure 7. Bland-Altman difference plot between DBS and plasma method for 3-HIV and 3-HIC.
3.4. Determination of reference ranges for the biomarkers in population of Udupi district of South India
The reference range is the range between the upper and lower values, at which the biomarker level is normal. It is obtained from distribution of results obtained from a sample of the population. The reference interval represents the value found in 95% of individuals of a population and has utmost significance in the accurate understanding of a patient's clinical condition. It is a fact that the reference ranges of analytes vary significantly in different geographical regions [Citation47,Citation48]. This study established reference ranges for the biomarkers of biotin deficiency in the population of Udupi, a coastal district of South India. DBS samples collected from 350 neonates were analyzed. A total of 51.14% of the study population were male and 48.86% were females. The reference ranges for 3-HIV and 3-HIC were found to be 0.06–18.59 μM and 0.01–0.49 μM, respectively. The analyzed data is shown in the Supplementary Table S2. An Italian study has also reported the reference range for 3-HIC in the neonatal DBS as 0.00–0.40 μM [Citation49]. The reference range for 3-HIV in neonatal urine has been reported to be <0.5 μM in a Japanese study [Citation50] and <0.4 μM in an Italian study [Citation51]. However, there are no published reports on the reference range of 3-HIV in neonatal blood.
3.5. Greenness of analytical method
The evaluation of the developed method using the AGREE analytical greenness metrics approach revealed a greenness matrix score of 0.62, indicating its eco-friendliness and alignment with green chemistry principles. Pictogram representing the greenness of the analytical method is depicted in . Unlike other methods, the developed method demonstrated several environmentally favorable characteristics. Notably, it did not require the use of any acid in the mobile phase, reducing the potential for hazardous waste generation. Additionally, the method exhibited low electrical power requirements and maintenance costs, further contributing to its eco-friendliness. The analytical greenness report sheet, available in the Supplementary Materials, provides a comprehensive overview of the method's environmental performance across the assessed criteria. Overall, the results indicate that the developed method is greener and more environmentally sustainable compared with alternative approaches, highlighting its potential for reducing environmental impact in analytical chemistry practices.
Figure 8. Pictogram representing the greenness of the analytical method.
4. Conclusion
The validated DBS-based LCMS method for the determination of 3-HIV and 3-HIC involves no derivatization and has a simple method of sample preparation with short run time and is green, qualifying it to be a comprehensive method for newborn screening and confirmatory diagnosis of biotin deficiency. The method exhibited good linearity, consistency and sensitivity for the biomarkers with an LLOQ of 0.088 μM for 3-HIV and 0.040 μM for 3-HIC. The method linearity range is from 0.088 to 22.429 μM for 3-HIV and 0.040 to 10.141 μM for 3-HIC. Both analytes were stable in plasma and DBS matrices at all the tested stability conditions. The method was successfully applied to establish the reference ranges for these biomarkers in the population of Udupi, a coastal district of South India. This data on the population specific reference range will be valuable for accurate clinical understanding of the biotin deficiency. Substitution of DBS for plasma-based techniques, reduces the need for uncomfortable and invasive venipuncture blood samples in newborns. This comprehensive approach aims to enhance early detection and management of biotin deficiency, thereby reducing the risk of associated complications.
Author contributions
S Moorkoth and A Raveendran conceived the idea. A Raveendran collected the sample. A Raveendran and A Gupta wrote the original draft and performed sample analysis. S Moorkoth, LE Lewis, K Prabhu and A Raveendran analyzed the data. S Moorkoth, LE Lewis and K Prabhu reviewed and edited the manuscript. All authors read and agreed with the final manuscript.
Financial disclosure
This work is a part of Grand Challenges Canada funded project titled “Need and Viability of Newborn Screening Programme in India” with the funding ID: R-ST-POC-1707-07275, which was funded by the Government of Canada.
Writing disclosure
No writing assistance was utilized in the production of this manuscript.
Ethical conduct of research
The authors declare that this manuscript is original, has not been published before and is not currently being considered for publication elsewhere. For collection of dried blood samples, institutional ethics committee approval was obtained from Kasturba Medical College, Manipal (MUEC/010/2017 dated 08.05.2017, MAHE EC/Renewal-02/2018 dated 10.05.2018 and IEC 303/2019 dated 15.05.2019).
Supplementary Materials
Download Zip (386.5 KB)Acknowledgments
The authors are thankful to the department of biochemistry for permitting us to use the DBS punch. A Raveendran is thankful to Manipal Academy of Higher Education, Manipal for providing scholarship under the Dr TMA Pai fellowship scheme.
Supplemental material
Supplemental data for this article can be accessed at https://doi.org/10.1080/20565623.2024.2355038
Competing interests disclosure
The authors are thankful to the department of biochemistry for permitting us to use the DBS punch. A Raveendran is thankful to Manipal Academy of Higher Education, Manipal for providing scholarship under the Dr TMA Pai fellowship scheme.
Additional information
Funding
References
- Zempleni J, Hassan YI, Wijeratne SS. Biotin and biotinidase deficiency. Exp Rev Endocrinol Metab. 2008;3(6):715–724. doi:10.1586/17446651.3.6.715
- Jitrapakdee S, Wallace JC. Structure, function and regulation of pyruvate carboxylase. Biochem J. 1999;340(1):1–16. doi:10.1042/bj3400001
- Höschle B, Gnau V, Jendrossek D. Methylcrotonyl-CoA and geranyl-CoA carboxylases are involved in leucine/isovalerate utilization (Liu) and acyclic terpene utilization (Atu), and are encoded by liuB/liuD and atuC/atuF, in Pseudomonas aeruginosa. Microbiology. 2005;151(11):3649–3656. doi:10.1099/mic.0.28260-0
- Bi H, Zhu L, Jia J, Cronan JE. A biotin biosynthesis gene restricted to Helicobacter. Sci Rep. 2016;6(1):21162. doi:10.1038/srep21162
- Penberthy WT, Sadri M, Zempleni J. Chapter 17 – Biotin. In: Marriott BP, Birt DF, Stallings VA, Yates AA, editors. Present Knowledge in Nutrition (11th Edition). London (UK): Academic Press; 2020. p. 289–303. doi:10.1016/B978-0-323-66162-1.00017-2
- Ingaramo M, Beckett D. Distinct amino termini of two human HCS isoforms influence biotin acceptor substrate recognition. J Biol Chem. 2009;284(45):30862–30870. doi:10.1074/jbc.M109.046201
- Wolf B. Biotinidase deficiency and our champagne legacy. Gene. 2016;589(2):142–150. doi:10.1016/j.gene.2015.10.010
- Nyhan WL. Multiple carboxylase deficiency. Inter J Biochem. 1988;20(4):363–370. doi:10.1016/0020-711X(88)90202-9
- Carling RS, Turner C. Chapter 10 – Methods for assessment of biotin (Vitamin B7). In: Harrington D, editor. Laboratory Assessment of Vitamin Status. London (UK): Academic Press; 2019. p. 193–217. doi:10.1016/B978-0-12-813050-6.00010-3
- Mock DM. Adequate intake of biotin in pregnancy: why bother? J Nutr. 2014;144(12):1885–1886. doi:10.3945/jn.114.203356
- Mock DM, Dyken ME. Biotin catabolism is accelerated in adults receiving long-term therapy with anticonvulsants. Neurology. 1997;49(5):1444–1447. doi:10.1212/WNL.49.5.1444
- Baumgartner MR. Chapter 184 – Vitamin-responsive disorders: cobalamin, folate, biotin, vitamin B1 and E. In: Dulac O, Lassonde M, Sarnat HB, editors. Handbook of Clinical Neurology. London (UK): Elsevier; 2013. p. 1799–1810. doi:10.1016/B978-0-444-59565-2.00049-6
- Wolf B. The neurology of biotinidase deficiency. Mol Genet Metab. 2011;104(1):27–34. doi:10.1016/j.ymgme.2011.06.001
- Momper JD, Nigam SK. Developmental regulation of kidney and liver SLC and ABC drug transporters and drug metabolizing enzymes: the role of remote organ communication. Expert Opin Drug Metab Toxicol. 2018;14(6):561–570. doi:10.1080/17425255.2018.1473376
- van den Anker J, Reed MD, Allegaert K, Kearns GL. Developmental changes in pharmacokinetics and pharmacodynamics. J Clin Pharmacol. 2018;58:S10–S25.
- Strovel ET, Cowan TM, Scott AI, Wolf B. Laboratory diagnosis of biotinidase deficiency, 2017 update: a technical standard and guideline of the American College of Medical Genetics and Genomics. Genet Med. 2017;19(10):1079–1088. doi:10.1038/gim.2017.84
- Barry W. Biotinidase Deficiency – GeneReviews® – NCBI Bookshelf [Internet]. Available from: https://www.ncbi.nlm.nih.gov/books/NBK1322/
- Tuchman M, Berry SA, Thuy LP, Nyhan WL. Partial methylcrotonyl-coenzyme A carboxylase deficiency in an infant with failure to thrive, gastrointestinal dysfunction, and hypertonia. Pediatrics. 1993;91(3):664–666. doi:10.1542/peds.91.3.664
- Suormala T, Fowler B, Duran M, et al. Five patients with a biotin-responsive defect in holocarboxylase formation: evaluation of responsiveness to biotin therapy in vivo and comparative biochemical studies in Vi. Pediatr Res. 1997;41(5):666–673. doi:10.1203/00006450-199705000-00011
- Hymes J, Wolf B. Biotinidase and its roles in biotin metabolism. Clin Chim Acta 1996;255(1):1–11. doi:10.1016/0009-8981(96)06396-6
- Jakobs C, Sweetman L, Nyhan WL, Packman S. Stable isotope dilution analysis of 3-hydroxyisovaleric acid in amniotic fluid: contribution to the prenatal diagnosis of inherited disorders of leucine catabolism. J Inherit Metab Dis. 1984;7(1):15–20. doi:10.1007/BF01805614
- Mock DM, Stratton SL, Horvath TD, et al. Urinary excretion of 3-hydroxyisovaleric acid and 3-hydroxyisovaleryl carnitine increases in response to a leucine challenge in marginally biotin-deficient humans. J Nutr. 2011;141(11):1925–1930. doi:10.3945/jn.111.146126
- Stratton SL, Horvath TD, Bogusiewicz A, et al. Plasma concentration of 3-hydroxyisovaleryl carnitine is an early and sensitive indicator of marginal biotin deficiency in humans. Am J Clin Nutr. 2010;92(6):1399–1405. doi:10.3945/ajcn.110.002543
- Hagiwara SI, Kubota M, Nambu R, Kagimoto S. Screening of carnitine and biotin deficiencies on tandem mass spectrometry. Pediatrics Inter. 2017;59(4):458–461. doi:10.1111/ped.13167
- Maeda Y, Ito T, Ohmi H, et al. Determination of 3-hydroxyisovalerylcarnitine and other acylcarnitine levels using liquid chromatography-tandem mass spectrometry in serum and urine of a patient with multiple carboxylase deficiency. J Chromatogr B. 2008;870(2):154–159. doi:10.1016/j.jchromb.2007.11.037
- Mock DM, Henrich CL, Carnell N, Mock NI. Indicators of marginal biotin deficiency and repletion in humans: validation of 3-hydroxyisovaleric acid excretion and a leucine challenge 1,2,3. Am J Clin Nutr. 2002;76(5):1061–1068. doi:10.1093/ajcn/76.5.1061
- Altamimi IM, Choonara I, Sammons H. Invasiveness of pharmacokinetic studies in children: a systematic review | BMJ Open. Pharmacol Therap Res. 2016;6(7):e010484.
- Yeung EH, Louis GB, Lawrence D, et al. Eliciting parental support for the use of newborn blood spots for pediatric research. BMC Med Res Methodol. 2016;16(1):14. doi:10.1186/s12874-016-0120-8
- Barr DB, Kannan K, Cui Y, et al. The use of dried blood spots for characterizing children's exposure to organic environmental chemicals. Environ Res. 2021;195:110796. doi:10.1016/j.envres.2021.110796
- McDade TW, Williams S, Snodgrass JJ. What a drop can do: dried blood spots as a minimally invasive method for integrating biomarkers into population-based research | Demography | Duke University Press. Demography. 2007;44(4):899–925. doi:10.1353/dem.2007.0038
- Bertels RA, Semmekrot BA, Gerrits GP, Mouton JW. Serum concentrations of cefotaxime and its metabolite desacetyl-cefotaxime in infants and children during continuous infusion. Infection. 2008;36(5):415–420. doi:10.1007/s15010-008-7274-1
- Nyanza EC, Dewey D, Bernier F, Manyama M, Hatfield J, Martin JW. Validation of dried blood spots for maternal biomonitoring of nonessential elements in an artisanal and small-scale gold mining area of Tanzania. Environm Toxicol Chem. 2019;38(6):1285–1293. doi:10.1002/etc.4420
- Raju KS, Taneja I, Rashid M, Sonkar AK, Wahajuddin M, Singh SP. DBS-platform for biomonitoring and toxicokinetics of toxicants: proof of concept using LC-MS/MS analysis of fipronil and its metabolites in blood. Sci Rep. 2016;6:22447. doi:10.1038/srep22447
- Patel KB, Nicolau DP, Nightingale CH, Quintiliani R. Pharmacokinetics of cefotaxime in healthy volunteers and patients. Diagn Microbiol Infect Dis. 1995;22(1):49–55. doi:10.1016/0732-8893(95)00072-I
- EMA. ICH M10 on bioanalytical method validation – Scientific guideline [Internet]. European Medicines Agency 2019. Available from: https://www.ema.europa.eu/en/ich-m10-bioanalytical-method-validation-scientific-guideline
- Timmerman P, White S, Globig S, Lüdtke S, Brunet L, Smeraglia J. Contributors, other EBF member companies listed at end of article. EBF recommendation on the validation of bioanalytical methods for dried blood spots. Bioanalysis. 2011;3(14):1567–1575. doi:10.4155/bio.11.132
- FDA Guidance for Industry: Bioanalytical Method Validation, U.S. Department of Health and Human Services Food and Drug Administration, center for Drug Evaluation and Research [Internet]. https://www.fda.gov/regulatory-information/search-fda-guidance-documents/bioanalytical-method-validation-guidance-industry
- Jager NGL, Rosing H, Schellens JHM, Beijnen JH. Procedures and practices for the validation of bioanalytical methods using dried blood spots: a review. Bioanalysis. 2014;6(18):2481–2514. doi:10.4155/bio.14.185
- Matuszewski BK. Standard line slopes as a measure of a relative matrix effect in quantitative HPLC-MS bioanalysis. J Chromatogr B Analyt Technol Biomed Life Sci. 2006;830(2):293–300. doi:10.1016/j.jchromb.2005.11.009
- Jopling J, Henry E, Wiedmeier SE, Christensen RD. Reference ranges for hematocrit and blood hemoglobin concentration during the neonatal period: data from a multihospital health care system. Pediatrics. 2009;123(2):e333–e337. doi:10.1542/peds.2008-2654
- Chaudhari BB, Sridhar P, Moorkoth S, Lewis LE, Mallayasamy S. Validation of an HPLC method for estimation of cefotaxime from dried blood spot: alternative to plasma-based PK evaluation in neonates. Bioanalysis. 2021;13(16):1245–1258. doi:10.4155/bio-2021-0130
- Capiau S, Veenhof H, Koster RA, et al. Official International Association for therapeutic drug monitoring and clinical toxicology guideline: development and validation of dried blood spot-based methods for therapeutic drug monitoring. Ther Drug Monit. 2019;41(4):409–430. doi:10.1097/FTD.0000000000000643
- Koster RA, Alffenaar J-WC, Botma R, et al. What is the right blood hematocrit preparation procedure for standards and quality control samples for dried blood spot analysis? Bioanalysis. 2015;7(3):345–351. doi:10.4155/bio.14.298
- Moat SJ, Dibden C, Tetlow L, et al. Effect of blood volume on analytical bias in dried blood spots prepared for newborn screening external quality assurance. Bioanalysis. 2020;12(2):99–109. doi:10.4155/bio-2019-0201
- Pena-Pereira F, Wojnowski W, Tobiszewski M. AGREE-analytical GREEnness metric approach and software. Anal Chem. 2020;92(14):10076–10082. doi:10.1021/acs.analchem.0c01887
- Roelofsen-de Beer RJAC, van Zelst BD, Wardle R, Kooij PG, de Rijke YB. Simultaneous measurement of whole blood vitamin B1 and vitamin B6 using LC-ESI-MS/MS. J Chromatogr B Analyt Technol Biomed Life Sci. 2017;1063:67–73. doi:10.1016/j.jchromb.2017.08.011
- Ichihara K, Itoh Y, Min W-K, et al. Diagnostic and epidemiological implications of regional differences in serum concentrations of proteins observed in six Asian cities. Clin Chem Lab Med. 2004;42(7):800–809. doi:10.1515/CCLM.2004.133
- Ichihara K, Itoh Y, Lam CWK, et al. Sources of variation of commonly measured serum analytes in 6 Asian cities and consideration of common reference intervals. Clin Chem. 2008;54(2):356–365. doi:10.1373/clinchem.2007.091843
- Santarelli F, Cassanello M, Enea A, et al. A neonatal case of 3-hydroxy-3-methylglutaric-coenzyme A lyase deficiency. Italian J Pediatr. 2013;39(1):33. doi:10.1186/1824-7288-39-33
- Shigematsu Y, Yuasa M, Ishige N, Nakajima H, Tajima G. Development of second-tier liquid chromatography-tandem mass spectrometry analysis for expanded newborn screening in Japan. Int J Neonatal Screen. 2021;7(3):44. doi:10.3390/ijns7030044
- Scolamiero E, Cozzolino C, Albano L, et al. Targeted metabolomics in the expanded newborn screening for inborn errors of metabolism. Mol Biosyst. 2015;11(6):1525–1535. doi:10.1039/C4MB00729H