
IN A FORMER LIFE, before academia called, I was gainfully employed as an information architect in one of the largest cash processing businesses in the world. One big problem with this job was that there was lots of data – terabytes of the stuff but precious little information. In common with other analysts, how to use and interpret big data to guide business decision making was one of the biggest challenges.
Distributed processing and cloud computing allow advanced storage and analytical capabilities to be available to organisations of all sizes. Although such capabilities bring a welcome reduction in the capital costs of computing, the increased revenue expenditure that these changes bring necessitates an understanding of how big data from distributed storage can be translated into meaningful insights that can help the bottom line.
Although the large size of ‘Big Data’ sets is the dimension that stands out, as the clue is in the name, the defining characteristics could be said to be the six V’s, namely Volume (large), Velocity (rapidly accruing), Variety (different formats), Veracity (information reliability), Variability (complexity and structure) and Value (the data has low value density).
Although cloud solutions are able to assist with storage and on-demand computing power, understanding the data collected by revealing the structure of the information is the key to unlocking the value that is sparsely contained within. In order to extract value from Big Data it needs to be made smaller. This is where Cluster Analysis techniques can help to classify and group objects based on attributes.
Cluster analysis seeks to apply a common approach to grouping objects based on their relationships to each other by assessing the structure from a set of user selected characteristics. It is a generic name for a group of multivariate data analysis techniques that utilise a cluster variate, a mathematical representation that compares the similarity of objects. Cluster analysis also mimics a task that is an innate skill of the problem solver – pattern recognition. By recognising patterns in the data, analysts can overcome the mountains of data to reduce the number of observations needed and generate hypotheses about the structure of the problem that can be tested.
Cluster analysis is particularly useful in scenarios related to choosing between different business options, where the decision depends on the similarity (or difference between) groups
Cluster analysis is particularly useful in scenarios related to choosing between different business options, where the decision depends on the similarity (or difference between) groups. It can be applied to describing or producing a taxonomy of objects, for simplifying data where there are many observations, or for identifying relationships between objects.
Common business examples include customer segmentation, utility or power usage and customer behaviour profiling. Advanced clustering techniques are also employed in more technologically sophisticated applications like image, number plate or facial recognition systems, but the principle of classification based on a known or assumed cluster variate remains the same.
PROBLEM DEFINITION
Let me illustrate the usefulness of cluster analysis from my cash processing days. During processing, cash is counted and deposited to a customer account. The problem was how to produce the most accurate estimates of how much ‘effort’ was used to process a deposit. Previous pricing mechanisms were based solely on the cash value of the deposit, but this masked wide variation in the quality of the money presented. An algorithm was required that could evaluate this processing effort based on both the value and processes used, and clustering analysis was used to determine the parameters of the resulting algorithm.
The amount of labour employed in counting the deposits is the determining factor in selecting the pricing point at which the depositing bank is charged. When cash arrives at a depot, it is sorted and counted based on the way the cash is presented.
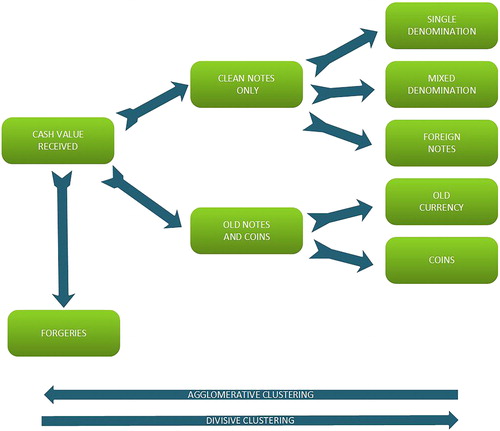
Deposits can be ‘clean’, in that they contain single denomination notes, mixed notes, and foreign notes. Mixed cash and coins, are said to be ‘semi-clean’. Large quantities of poor quality notes and large amounts of coin constitute ‘unclean’ deposits due to the increased manual processing required. Cash is also automatically screened for out of date notes, coins and forgeries, the presence of which automatically increases the amount of intervention that is required.
the sample chosen [should be] sufficient to capture a representation of all relevant small groups that may be within the population
The quality of the received deposits directly influences the methods used to process the cash, with large automated machines able to handle ‘clean’ deposits, semi-automatic methods are used to process ‘semi-clean’ deposits using desktop cash counters like you may see in a bank branch. Large amounts of ‘unclean’ coins need to be counted using specialist machines and tatty notes have to be manually withdrawn and replaced.
Prior analysis and understanding of the business process, data structures, and the aims of the project ensured that there was considerable consensus between the stakeholders about the way in which the clustering could be approached.
DESIGN ISSUES
The design of a cluster analysis for big data is aided by the fact that finding an adequate sample size is rarely a problem. What is more important is that the sample chosen [should be] sufficient to capture a representation of all relevant small groups that may be within the population. This is critical in the detection of outliers. In this case, it was important to ensure that the sample included sites at airports, so that processors capturing foreign currency could be evaluated.
Outliers can represent small legitimate groups like the amount of Turkish lira processed or may represent under-sampled groups, like £50 notes processed in poor areas that are legitimate but may be prevalent in more affluent areas. Non-legitimate presentations included seaside currency ‘joke’ notes that had to be excluded.
Depending on the purpose and method of clustering it is always necessary to screen the sample data for outliers to ensure the results capture, and are representative of, the whole population and are not unduly affected by outliers.

PATTERN OR PROXIMITY
Similarity matching is the process by which the correspondence of objects between each other can be assessed. The similarity is computed by comparing each observation to the grouping criteria specified by the analyst. A procedure then allocates all similar objects into the same cluster. Correlation procedures utilise correlation coefficients to assess how closely the profiles of objects resemble each other and match the criteria. In the example, the quality of a deposit was based on metric (value) and non-metric (quality) data, that is the cash value and make-up and, therefore, this was the method used to evaluate the data.
it is always necessary to screen the sample data for outliers to ensure the results capture, and are representative of, the whole population and are not unduly affected by outliers
Dependent upon the types of data being compared, distance measures may be a more appropriate measure of similarity, and methods to achieve cluster similarity may be based on the Euclidean (i.e. crow fly) distance between data points or the Manhattan distance (based on a grid network) between data points. Other distance measures are available to the analyst and can be utilised to represent the data patterns. Basing clusters solely on simple distance metrics of similarity determination like cash value that take into account only the magnitude of the values can disguise wide variations in other criteria like deposit quality.
When choosing a procedure for analysis, the analyst should be aware of whether pattern or proximity is the primary objective of cluster definition. Regardless of method used, the resulting clusters that are produced should exhibit high internal (within-cluster) homogeneity, and high external (between-cluster) heterogeneity.
STANDARDISATION
Different data sets may need a standardisation process and processing each variable (or distance) to a standardised score assists comparison of values when different scales are used for each variable type.
Standardisation of variables in time or date formats to a numeric format were used to assess how long operations took. In questionnaire scenarios the standardisation of responses within rows (case standardisation) can be of use to level respondent scores and mitigate response-style effects. Counting financial deposits is aided by the fact that cash in the UK is standardised to GBP. However, processing foreign deposits in a UK cash centre involves a currency conversion and adding exchange fees as part of the process.
ASSUMPTIONS
Unlike some other statistical inference techniques, clustering is a technique that does not require the data to be evenly represented across the scale used (normally distributed), or the values to have any relationship with each other (linearity). Checking input variables for multicollinearity, where the variables are so closely correlated that they essentially measure the same thing, was accomodated by using only the foreign currency values or the converted rates instead of both, because they represented the same values related by the exchange rate.
Alternative methods of dealing with highly correlated data include choosing a distance measure that compensates for correlation (e.g Malahanobis distance, which measures the number of standard deviations from a point to the mean of a distribution) to ensure that multicollinearity bias is not introduced into the analysis.
ALGORITHM SELECTION
The clustering itself is performed by partitioning the data based on the attributes of the data according to the similarity rules employed, in order to produce groups of data that are similar in pattern or proximity.
A hierarchical clustering algorithm was used to partition process data by using a divisive method that successively subdivided the sample into smaller groups based on attributes (see ) to form a tree like structure. This method was chosen because the patterns and taxonomy of the data were well known to the analysts involved.
Alternative methods of clustering use agglomerative methods that successively group the data ‘up’ from single observations based on the criteria. These algorithms are best suited to multiple criteria evaluation scenarios and where distance and proximity (as opposed to pattern) measures of grouping are used, and the choice of which algorithm to use is dependent upon the situation.
Figure 1 Results of a Hierarchical Clustering Algorithm
Other alternative algorithms involve non-hierarchical clustering, whereby clusters are seeded from initial values and observations are assigned to the clusters with the aim of maximising the similarity within clusters and maximising the distance between clusters. A family of algorithms known as K-means work by iteratively optimising and reassigning observations to the clusters.
Algorithm choice depends on the situation. Hierarchical methods offer the advantages of speed and simplicity. However, they are also biased by the presence of outliers, high storage requirements, and the potentially misleading effects of early selection combinations. Non-hierarchical methods can overcome some of these barriers, but work best when the seed points are already known or can be reasonably specified from prior practice or theory.
A blended approach of using a hierarchical algorithm, removing outliers, then re-clustering using a non-hierarchical algorithm can help to compensate for the weaknesses of both approaches.
STOPPING RULES
The analyst should always be aware of how many resultant clusters are required, to give sufficient discrimination between groups whilst maintaining a useful and informative analysis. Single observation clusters need to be checked for validity, and removed or regrouped to ensure that the number of clusters created is manageable. Many software programs contain stopping rules that set limits on the number of heterogeneous clusters that can be created. These stopping rules determine that the clusters arrived at are sufficiently distinct from each other, in terms of percentage, variance or statistical difference.
If the output is to be used to inform a change to a system or process, then the number of clusters arrived at must be intuitive and of manageable size.
INTERPRETATION
When the clustering process is completed, it is possible to interpret the clusters and to assign labels to them according to the entities they represent. In the example, the clusters can be further subdivided based on the quality and process used, so were assigned labels such as ‘Clean-Auto’, ‘Mixed-Manual’. Labelling means that it is immediately obvious to other users what the grouping represents, and is especially useful when communicating the results of the analysis to others, creating a common vocabulary of understanding.
VALIDATING AND PROFILING
Validation involves ensuring that an optimal solution has been arrived at and that it is representative and generalisable. This is achieved by using the cluster analysis on several different samples in order to cross validate the results that were obtained. This ensures that rare observations and edge cases are captured and classified correctly and that the proposed classifications are stable.
Profiling using new or unseen observations ensured the predictive classification of the criteria used and to help prepare the operationalisation of the solution.
SUMMARY

This example shows how clustering techniques were used to establish the classification criteria for a new Activity Based Costing (ABC) solution utilising big data obtained from a distributed, multi system processing capability, bringing clarity, unity and added value to the pricing systems of a core business process.
The process, as always, was aided by close collaboration between the users that know the meaning of the process and the administrators of the systems that aid the understanding of the data. It’s possible that Clustering, Collaboration and Co-operation could well be the three C’s of leveraging the six V’s of big data into insights and innovation.
Collecting and curating large data sets is a by-product of modern digital environments. If your organisation is one of those that is concerned about how to leverage large data sets to gain value then cluster analysis may be a step towards enhancing your insight capability.
Duncan Greaves is a PhD researcher at Coventry University studying Cybersecurity Management, with a focus on how businesses can influence trust formation in digital environments. Although his writing is that of a self identified data geek his first love is the study of sedimentary geology and fossils.
FOR FURTHER READING
- Hair, J.F., W.C. Black, B.J. Babin and R.E. Anderson (2010). Multivariate Data Analysis: A Global Perspective. Pearson.