

USE OF MOBILE DATA IS SOARING. By 2017, there were over 7.6 billion mobile connections worldwide. With 4G widely available and 5G emerging, mobile communications put huge demands on the limited radio bandwidth available. As a result, eyes are being cast on the wavelengths allocated to television. It’s hard enough choosing which TV channel to watch – but rearranging US TV stations to release parts of the broadcast spectrum for mobile data provides a whole different level of challenge.
RESHUFFLING THE US AIRWAVES
The Federal Communications Commission (FCC), regulator for US communications, took on the challenge of reshuffling frequency allocations to TV stations, freeing up space for mobiles. The specific focus was the top end of the 600 MHz TV band, ideal for data networks as it is contiguous with existing mobile bands and has excellent range and ability to penetrate walls. As Gary Epstein, former chair of the FCC’s taskforce put it, this is ‘prime beachfront property for mobile broadband services.’
A team from the FCC and a number of US and Canadian universities took on the challenge, supported by the Smith Institute – a mathematical decision support consultancy based at Harwell in Oxfordshire, experts in spectrum assignment. For Smith Institute CTO Robert Leese and his colleagues, the challenge was to ensure the mechanism freed up bandwidth at the least cost, while verifying the optimisation tools used to enable broadcasters to continue their business, avoiding interference between stations.
Leese has a degree in mathematics and a PhD in physics. His experience of O.R. began at the Smith Institute: ‘My involvement with O.R. developed through becoming involved in resource allocation problems for radio spectrum, in particular what is generally called the channel assignment problem. This was in the days before spectrum auctions were common, when spectrum management was almost entirely an engineering problem. I realised that the branch of mathematics known as graph theory was highly relevant, and this led to a fruitful line of research. O.R. techniques are now used routinely in channel assignment.’
GOING, GOING GONE
The main vehicle used by the FCC was an auction. It’s easy to think of auctions as simple marketplaces, but they perform a more sophisticated role. An auction provides information on price sensitivity: it tells us what individuals or companies are prepared to pay. This is why auctions provide an effective means to divide up the airwaves, bringing in large amounts of cash for governments. But the FCC’s requirement added in the complexity of channel assignment. The auction process had to both manage the supply of channels, enabling TV companies to operate, and distribute the freed-up bandwidth to mobile networks.
This ‘Broadcast Incentive Auction’ process was iterative, with two components. First came a so-called reverse auction, which determined how much TV stations would accept to relinquish one or more channels. In effect, it involved TV stations playing a game of chicken. The FCC initially set prices to give up a channel. Leese: ‘Initial levels were set taking into account the coverage areas and coverage populations of each TV station. So, stations covering large areas of urban population would see high initial prices in the reverse auction. Another consideration was to set the prices at levels which would be sufficiently attractive to encourage high participation levels from the broadcasters’. During each round of bidding, the prices offered dropped. Stations could either accept or reject the offer. If they rejected it, they dropped out of the auction and were assigned a channel in the newly established band. If they accepted, they stayed in the auction and the amount offered continued to decrease. At the point there was no longer a channel available for a bidder, the amount offered was the amount the station would be awarded – provided there was funding to cover this.
sophisticated algorithms were used to assess the ability to rearrange the broadcast spectrum and optimise it, ensuring that stations did not interfere with each other
During this stage, sophisticated algorithms were used to assess the ability to rearrange the broadcast spectrum and optimise it, ensuring that stations did not interfere with each other. This could include both stations within the US and across the border in Canada.
With sufficient bandwidth freed up, the second part of the process was reached: a ‘forward’ auction amongst mobile networks. Here, prices went up each round until demand dropped off. At this point, the income raised by the forward auction was compared with the funding required to access TV channels. If the bidding was too low, the whole stage was repeated with lower targets for the amount of bandwidth to be released. This process was reiterated until a successful outcome was reached.
THE OPTIMISATION PROBLEM
The most complex aspect of the process was optimising the rearrangement of the spectrum to identify whether there were sufficient channels available for the bidding TV stations. Many optimisation problems are so complex that all we can hope for is a good solution, rather than the best. A familiar example is the ‘travelling salesman’ problem – optimising the route between a number of destinations on a journey. For anything other than a trivial situation, optimisation of this kind of problem can be too complex to complete in a feasible timescale. Thankfully, techniques have been developed to approximate quickly to the best solution.
The FCC’s aim was to provide a new, non-interfering channel for each TV station that wanted one, while freeing up some bandwidth. TV stations which did not want to lose a channel had to be offered one which was in the same frequency band as the one they previously held – the US TV spectrum is divided into three bands of 6 MHz channels: UHF (channel 14 and above), High-VHF (channels 7–13) and Low-VHF (channels 2–6). Of course, it was possible that no station would want to give up their channels, but in the US, broadcast TV viewership is small compared with cable and satellite, suggesting (as proved to be the case) that TV companies would relinquish bandwidth for financial incentives.
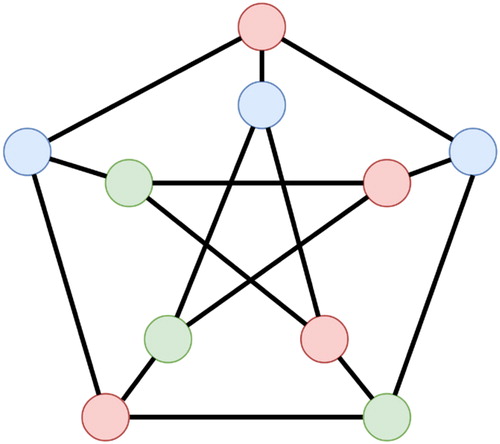
The algorithm to make safe channel assignments used the structures mathematicians call graphs – a network of points known as nodes connected by lines called edges, as illustrated in . Here, the graph consisted of a node for each TV station, connected by edges which indicate which stations would interfere should they be given the same channel. The problem then became to colour in the nodes in such a way that no directly connected nodes had the same colour, while minimising the number of colours used. The more colours required, the more channels that had to be assigned.
Figure 1 Illustrating the graph colouring problem: Pairs of nodes joined by an edge must receive different colours
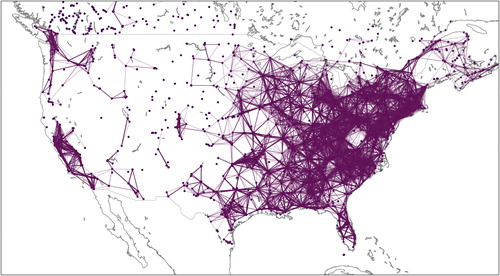
Like the traveling salesman, this problem can be impossible to truly optimise. It doesn’t help that radio can cause interference over significant distances, depending on the power of the transmitter and the terrain. In the US, the maximum distance between a pair of potentially interfering stations is a remarkable 420 km. There are also a huge number of nodes – 2900 for the US and Canada, with on average 34 edges connecting them to other nodes, as can be seen in . Things get particularly difficult in dense urban areas where there tend to be more stations and it was recognised that some TV channels would have to edge into the mobile band.
Figure 2 Pairwise constraints required between stations in the us and canada to protect them from interference
As is usual in optimisation, the algorithm had to deal with two types of requirement, constraints and objective functions. Constraints are unbreakable requirements, where objective functions are nice to haves. Imagine, for example, that you are trying to get the best possible car for your money – a decision most of us would like to optimise. Constraints might be that the car has to be available, affordable, safe and legal. Objective functions might relate to the car’s comfort, performance, prestige and appearance.
JUGGLING THE POSSIBILITIES
Over and above the constraints of minimising interference and an upper limit on channels – initially 50 were available – a number of objective functions were included in the model, reflecting FCC policies and goals. To prioritise these, objective functions were successively converted to constraints between optimisations, ensuring that the most important goals were achieved. The priority order was to protect existing coverage, then deal with border issues, support requests from broadcasters (for example staying in a band), stay within the amount of interference acceptable to the mobile bands and minimising the need to relocate stations to new channels (changes usually require new broadcasting equipment or the replacement of antennas).
It is one thing to say that optimisation involves colouring nodes on a graph – another to establish what form that graph should take. The structure was derived from an FCC model that divided the US into around 2.5 million 2-km square cells, then predicted the signal strength of each station in cells within its range, determining potential for interference. There was also a objective function to ensure, as much as possible, that anyone who received a particular station could continue to do so.
Not surprisingly, the optimisations made during the auction process were at the limit of practicality for a timescale to fit the auction process. Over 100,000 feasibility checks were required at each step. The best off-the-shelf solutions dealt with 80 per cent of the problems required in 100s – too slow to be effective. A bespoke piece of software known as SATFC was developed at the University of British Columbia, tasked with rapidly finding a feasible solution (should there be one). This used machine learning to home in on the best solving approaches, managing around 95 per cent of test problems in less than 10s.
One key feature of the auction design was that participation for the broadcasters should be as easy as possible
A SUCCESSFUL OUTCOME
Despite its complexity, the auction was successfully completed by February 2017. One essential here was getting stakeholder buy-in. Leese explains: ‘The network operators generally had prior experience of participating in spectrum auctions, and the mechanism in the Broadcast Incentive Auction for them was not very different to what they were already familiar with. The TV broadcasters were in a completely different situation, and the FCC spent a great deal of time with them to make sure that they understood the process and that all their concerns were addressed. One key feature of the auction design was that participation for the broadcasters should be as easy as possible. They were never asked to select from more than three options at a time. Another key feature was that broadcasters were free to drop out of the process at any time (or not to participate in the first place), safe in the knowledge that they would not end up in a materially worse situation with regard to interference than their situation before the auction.’
the start date for the auction had been set well in advance, so no slippage in timescale was possible and there was no room for things not to work perfectly first time
Thanks to the sophisticated optimisation model, up to six rounds a day were completed as the auction neared completion. This was essential, as the whole process was predicated on having a tight schedule. Leese again: ‘If I could pick two biggest challenges, they would be (a) the recognition right at the outset that the start date for the auction had been set well in advance, so no slippage in timescale was possible and (b) that there was no room for things not to work perfectly first time.’
As Karla Hoffman of George Mason University, part of the optimisation team at the FCC, put it: ‘The O.R. techniques used were essential to the design and implementation of the auction. This coordination with Canada and Mexico ensured that all of North America now has a uniform 600-MHz band… The auction repurposed 84 megahertz of spectrum and generated gross revenue of nearly $20 billion, providing more than $10 billion in capital for the broadcast television industry and over $7 billion for federal deficit reduction. And the FCC is now looking at how the O.R. techniques developed here and how the two-sided auction design used for the Incentive Auction can be applied to other spectrum bands to ensure that they are being used efficiently.’
the FCC is now looking at how the O.R. techniques developed here and how the two-sided auction design used for the Incentive Auction can be applied to other spectrum bands to ensure that they are being used efficiently
This approach is also being considered by regulators around the globe. Such was its success that it won the 2018 Franz Edelman Award for Achievement in Advanced Analytics, Operations Research and Management Science and the 2018 OR Society’s President’s Medal. It was no secret that the broadcast and mobile data industries doubted that the FCC was capable of pulling this off – but thanks to sophisticated O.R. techniques, the project proved a remarkable success.
Additional information
Notes on contributors
Brian Clegg
Brian Clegg is a science journalist and author and who runs the www.popularscience.co.uk and his own www.brianclegg.net websites. After graduating with a Lancaster University MA in Operational Research in 1977, Brian joined the O.R. Department at British Airways. He left BA in 1994 to set up a creativity training business. He is now primarily a science writer: his latest title is Professor Maxwell’s Duplicitous Demon, a scientific biography of James Clerk Maxwell.