
DECISION-MAKERS NEED TO UNDERSTAND CAUSE AND EFFECT, and predict the future. Others analyse and provide the information that helps good decisions to be made. Either way, they will use mathematical models of the world, based on some previously collected data. If the calculations are sound, but the communication poor, there may be misunderstandings, or the decision-maker, finding it confusing and onerous, will simply revert to their prejudices.
Visualising those models created by analysts, the data that go in, and the predictions that come out, is one of the most powerful tools for effective communication
Visualising those models created by analysts, the data that go in, and the predictions that come out, is one of the most powerful tools for effective communication. Not only do visual representations of the findings capture attention and interest, they are also more quickly absorbed than a dry table of numbers, and, if done correctly, the message they carry will be remembered and shared.
For the analyst too, visualisations can help them see when their model is providing accurate representations of the world and acceptably accurate predictions, and when it is failing. Knowing this allows them to revisit and refine the model, and get better results. There may be undetected problems with the input data, which have to be accounted for in the model. A model that works well in most situations but fails in some specific circumstances suggests that more complexity needs to be added. To find these model or data problems, we may have to scan millions of observations over thousands of variables. Unusual patterns might not be obvious from summary statistics or from graphs of one variable at a time.
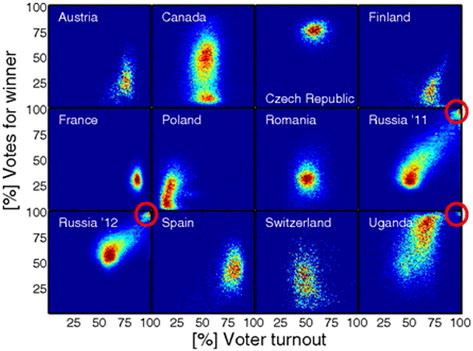
The only efficient way to scan the data on this large scale is to do so visually. shows election data from 12 national general elections, where each dot represents a polling station, and higher densities of polling stations are shown as colours moving towards red. Suggested irregularities are circled in red, where certain stations reported 100% of the electorate voting and 100% voting for the winner, unlike the majority of polling stations. In the Ugandan and the two Russian elections, there is a group of stations at, or close, to this perfect turnout and winner-support. Notably, there is then a gap between this and the bulk of the country. The authors of the paper identified this as implausible. Given the huge number of polling stations involved in each part of this figure, it would have been almost impossible to detect peculiar patterns by examining a table of data. Our brains are excellent tools, fine-tuned over millions of years, to spot things that don’t fit in with their surroundings, so we should use them!
FIGURE 1 ELECTION DATA FROM 12 NATIONAL GENERAL ELECTIONS
From ‘Statistical Detection of Systematic Election Irregularities’ by Peter Klimek, Yuri Yegorov, Rudolf Hanel and Stefan Thurner. Reproduced under open access licence from the Proceedings of the National Academy of Sciences.
There are some generic tips that I think are crucial for innovative, effective visualisation:
produce lots of sketches and user-test them;
use metaphor, grounded in context (time spent in traffic jams is more impactful than a rate ratio, for example);
use annotation, but sparingly;
use natural frequencies rather than percentages and rates wherever possible;
show uncertainty in statistical estimates;
keep familiar ‘landmark’ variables, such as location and time, to the fore.
INTERACTIVE VISUALISATION
One of the most significant developments in data visualisation has been interactive content, delivered in the web browser. This is typically constructed with some programming in JavaScript, the language that gives instructions to web browsers such as Chrome, Safari or Firefox. However, recently there has been a welcome addition of packages that translate output from general-purpose analytical software such as R, Python or Stata into JavaScript. Tableau, Google Sheets and Mapbox are also excellent starting points for generating basic interactive output, and all are free in their basic versions.
It is possible to use interactive graphics to great effect for understanding the analysis as well as communicating the results
It is possible to use interactive graphics to great effect for understanding the analysis as well as communicating the results. It is even possible to let the user re-run analyses and simulations under their own what-if scenarios through the browser. Two choices here are to run the analysis on a server (which keeps data confidential but requires some investment in infrastructure and maintenance) or on the user's computer (‘client-side’). The latter can provide a smoother and more flexible experience but relies on fast internet connections, up-to-date browsers and of course hands over at least some of the data to the user.
The interaction via the web browser can take many forms:
Pop up more information when the mouse pointer hovers over a region;
Click on a region and more information appears in an adjacent part of the screen;
Click to have the visualisation show only data from that region;
Click and drag to zoom in on the selected rectangle;
Scroll down to change the images and text to the next layer of detail, or step in the story;
Move sliders and click on tick boxes to control some aspects of the visualisation;
Toggle between showing or hiding some aspect;
Animate the content unless the user pauses it and moves back manually;
Move through layers/steps as arrow buttons are pressed;
Scroll around and zoom in on a map or a virtual globe.
This has brought a new mindset to data analysts: the concept of giving the audience not just a static report, but a tool they can use. It could be conceived of as a graphical user interface (GUI), webapp or application programmable interface (API). Although it is seen in the web browser, it need not be stored remotely and delivered via the internet, an important consideration where the data that are being processed are sensitive or confidential. A team will need programming and design skills in addition to mathematical modelling or computing or statistics, if they are to deliver this kind of output. Some ability to program in JavaScript will be essential, although packages like D3 and Leaflet save the developer a lot of time reinventing the wheel.
Even more than with static images, user-testing is essential. Analysts are often so familiar with the data, models and conclusions that it becomes very hard to say what is understandable to the audience; the only way to really find out is to convene a small group of people who can give you honest feedback. This is one of the most important resources that an organisation or team can have if they intend to communicate quantitative findings.
INTERPRETABILITY AND EMERGING TECHNIQUES
‘Interpretability’ has become a hot topic in the world of machine learning in recent years, following a concern that methods such as neural networks can give reasonably good results but without human users understanding why that is the case – the problem of the so-called black box. Visualisation is clearly a powerful tool when seeking interpretation. Not only is there a legal obligation through GDPR to be able to explain to a court how a decision was arrived at, but interpretable predictions are more likely to influence decision-makers, and can be more robust to hacking.
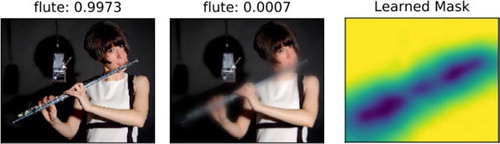
Two very promising new ways of thinking have emerged from efforts to boost interpretability. Firstly, adversarial approaches perturb part of the input data and monitor the impact this has on conclusions. When a large impact is observed, we can conclude that the model places considerable emphasis on those values. is a depiction of a complex model (convolutional neural network) detecting the presence of a flute with 99.73% certainty in the left image. The computer is tasked with finding regions that, when blurred, alter the prediction. The centre image shows a good match, reducing flute-certainty to 0.07%, and this ‘mask’ is shown in the right image. This assures us humans that the model is indeed responding to flutes and not some other artefact that happens to appear in the flute photographs it was trained on (for an example of such artefacts causing problems, read John Zech’s article ‘What are Radiological Deep Learning Models Actually Learning?’ at https://medium.com/@jrzech/what-are-radiological-deep-learning-models-actually-learning-f97a546c5b98).
FIGURE 2 DETECTING THE PRESENCE OF A FLUTE
From the open access pre-print paper ‘Interpretable Explanations of Black Boxes by Meaningful Perturbation’ by Ruth Fong and Andrea Vedaldi (arxiv.org/abs/1704.03296).
A more open-ended approach is that of the generative adversarial model (GAM), where one model generates data, which is in turn classified by another. The second, classifying, model has already been trained on real-life data. The first, generative, model is programmed to focus on configurations of data that produce incorrect classifications from the classifying model. In this way, the theory goes, we can find combinations of data that our classifying model gets wrong, and from this, we can learn how to make it more robust, as well as how to interpret what it is really detecting and responding to. GAMs are also responsible for the majority of eye-catching images where pairs of neural networks, by trying to trick each other, make uncanny images that look like dogs but not quite, or convert holiday snaps into the style of Van Gogh. It’s hard to imagine making sense of this if the data were simply massive arrays of numbers. By visualising them, us humans can keep up with the enormously complicated models at work.
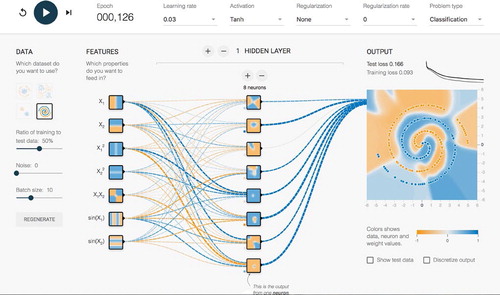
Secondly, researchers have had some success in communicating how these complex methods work by providing simple examples with an interactive front-end in the web browser (e.g., playground.tensorflow.org). The user can tweak the parameters of the model and watch it get trained on the data without any need for technical training, simply by moving sliders, ticking boxes and watching the visualisations evolve. This seems to be the realisation of a long-held ambition of O.R. and statistics people alike, to create engaging computer-based visual content that helps students learn about our more obscure techniques. shows a screenshot of the TensorFlow Playground, which is an interactive website demonstrating some simple neural networks and how they can predict very complex and challenging patterns in data.
FIGURE 3 A SCREENSHOT OF THE TENSORFLOW PLAYGROUND
By Daniel Smilkov, Shan Carter, Martin Wattenberg and Fernanda Viégas at Google, reproduced under the Apache 2.0 licence.
BIG DATA
When datasets become very large, visualisation is challenging because the page or screen will become one amorphous blob of colour. Making lines or points semi-transparent can help us to see areas of highest density, but patterns will be impossible to discern when there are too many lines or points.
One useful framework for approaching this problem is called “bin-summarise-smooth”, proposed by Hadley Wickham of RStudio [https://vita.had.co.nz/papers/bigvis.pdf]. Split the space in the plot into bins (a rectangular or hexagonal grid is most common), allocate observations to bins and accumulate a relevant statistic in each bin (counts and means are easy to program in this way, while medians and other quantiles turn out to be demanding). If desired, lumpy patterns can then be smoothed out using any acceptable method.
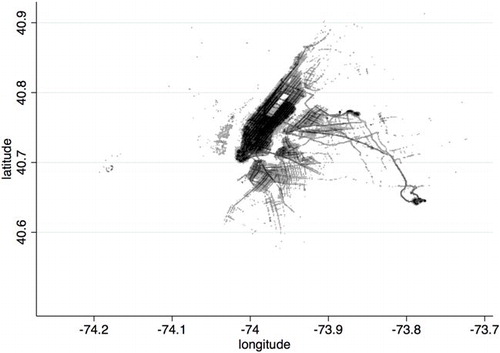
shows all 14 million yellow taxi journeys in New York in 2013. Because of the distinctive outline of the land, no background map is really necessary. This is a 1000-by-1000 pixel image, so there are one million bins, most of which are empty. The shade of each pixel is determined by the number of journeys that start there, according to GPS data, so the summary statistic is a simple count. There is no smoothing, allowing us to see the individual major roads.
FIGURE 4 14 MILLION YELLOW TAXI JOURNEYS IN NEW YORK IN 2013
The starting locations are counted into a 1000-by-1000 grid and shown as shading for each pixel.
A similar approach applies when data are arriving too quickly to be displayed in any comprehensive way, called windowing. Statistics are accumulated for consecutive time intervals or windows. It is helpful to have more than one of these series of windows, with edges offset so they partly overlap. This gives some scope for smoothing or zooming in and out after the data reduction has happened.
SHOWING UNCERTAINTY
One of the questions I am asked most often as a trainer is how best to show, not just the best prediction from a model, but also the uncertainty around that. This is something that statisticians like me deal with all the time – it’s perhaps our only trick – but we rarely think about how to show it, beyond putting those ubiquitous error bars on the charts. The trouble with adding more lines and shaded regions is that it clutters the chart quickly. Again, sketching and user-testing is vital to find what makes sense to the audience.
Whenever we use simulations and agent-based models to model the real world, we have a large number of potential outcomes, which we might then average or summarise in some way to get a bottom line. Those individual simulations are also a valuable resource for visualisation, because simply by showing them together, the uncertainty in the outputs are made evident. A lot of effort has been made in recent years with weather forecasting, especially for dangerous events like hurricanes. Multiple predictions can appear all together, perhaps with semi-transparent lines or points. This gives a simple interpretation: one of these lines will be the one the hurricane takes, but we don’t know which. Alternatively, they can be summarised by a boundary at a given level of probability (determined by methods like quantiles or convex hulls). The interpretation here is that there is only a x% chance of being hit by the hurricane if you live outside the boundary. Finally, we could also have a series of boundaries: effectively, contours in a probability surface for the prediction. shows three approaches to showing uncertainty around a trajectory (perhaps a hurricane path): multiple draws from the model, best estimate with a region of fixed probability, and multiple contours without a best estimate.
FIGURE 5 THREE APPROACHES TO SHOWING UNCERTAINTY AROUND A TRAJECTORY

CONCLUSION
Working with data visualisation requires a peculiar mixture of analytical skills and design thinking. It is increasingly in demand among public and private sector employers. The open-ended nature of the challenge, with no right or wrong answer, makes it stimulating and a source of constant learning. It is also helping us to tackle some of the most resistant problems in modelling and prediction: poor data quality, black box models, communication to a non-technical audience and assisting decision-makers.
Additional information
Notes on contributors
Robert Grant
Robert Grant of Bayes Camp Ltd, UK ( [email protected] ) is a freelance trainer and coach for people working in data analysis, Bayesian models and data visualisation. His background is in medical statistics and he is the author of ‘Data Visualization: charts, maps and interactive graphics’, published by CRC Press and the American Statistical Association.