

THE 19TH CENTURY AMERICAN DEPARTMENT store owner John Wanamaker is credited with the remark ‘Half the money I spend on advertising is wasted; the trouble is, I don’t know which half.’ It’s a problem that remains to this day, though there are now many more channels for advertising than Wanamaker had available. The choice of how to spread an advertising budget across TV, print and online poses distinct problems, never more so than in the product launch of a new car.
QUANTIFYING PRODUCT LAUNCHES
Producing the optimum advertising budget split was the challenge taken on by Marc Fischer of the University of Cologne and University of Technology, Sydney, helping Mercedes-Benz with campaigns for new car models. Mercedes was particularly concerned with product launches as it greatly expanded its introduction of new models, following stagnating sales in the 1990s. This revived the brand but meant that major sums were being spent on repeated launch campaigns – typically spending several million euros per car – making it essential that the budget was effectively deployed.
Fischer puts his interest in O.R. and quantitative measures in marketing down to the need to show evidence for decision-making: ‘Many practical problems require that you compare several decision options. It is not sufficient to evaluate them with gut feeling. O.R. helps with getting to the fundamentals and provides a fact base that is transparent. It increases your credibility in the company a lot when you suggest solutions backed up by sound quantitative analysis.’
Because sales usually don’t pick up significantly until well after a launch campaign, something had to be used as a measure to stand in for sales figures. The best indicators available proved to be those around recognition – how much the advertising penetrates the awareness of potential customers. Fischer notes: ‘TNS (a subsidiary of the British multinational market research agency Kantar) and I did some modelling for another automotive client. We found a very powerful relationship between recognition and future car sales. There is other research that has been published in our top marketing journals that provides further support for this relationship and for other mind-set metrics such as consideration, likability, etcetera.’
Fischer developed a mathematical model, a so-called advertising production function, linking advertising spend to level of recognition and related indicators. The model works by taking data from previous campaigns on relationships between spend in different media and recognition among target customers; this information is used to predict these relationships in future campaigns. Feeding into this model is an online survey.
RECOGNITION, INVOLVEMENT AND MOTIVATION
In the initial implementation in 2012 and 2013, Mercedes used Fischer’s model in four campaigns bringing new cars to the German market. These were integrated campaigns across TV, newspapers and magazines, and online banner advertising, with a budget each time of several million euros. The advertisers had particular target customers in mind each time – for example, one campaign focussed on buyers in the 35 to 69 age range with a net monthly income of €3,000 and over.
Mercedes used Fischer’s model in four campaigns bringing new cars to the German market
The project used online surveys of potential customers, selected to match the target customers for the particular new model, aiming to measure three key performance indicators (KPIs): recognition, involvement and motivation, as illustrated in . Recognition reflects how well the survey participant recalls the advertisement; involvement measures how effective the participant thought the advertisement was; and motivation tries to uncover whether the advertisement made the brand relationship with the potential customer stronger. The data from the survey drove the allocation of budget to the different media, giving the decision makers the ability to see, for example, how many more target customers would be reached with a specific increase in budget, or how to modify the media mix to achieve the same result with a reduced budget.
FIGURE 1 MEASUREMENT OF AD KPIs - A HIERARCHY OF ADVERTISING EFFECTS (Illustrative numbers)
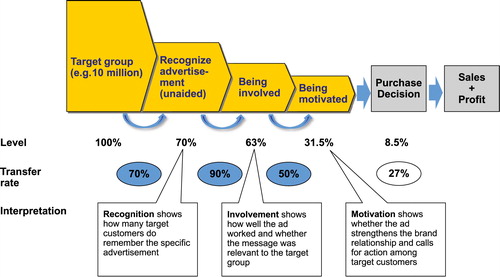
demonstrates how well the campaign performed with respect to these advertising KPIs. In the illustrative example, 7m target customers out of a total population of 10m correctly recognized the advertisement in one of the used media channels. From these 7m customers, 6.3m feel involved by the ad and 3.15m showed stronger relation to the brand. 0.85m target customers will eventually buy the advertised new car.
The approach taken was a ‘calibrated ordered logit model’. Fischer explains: ‘Assume you want to study how important preparation is for the performance of a marathon runner. Preparation can be measured in terms of number of runs, distances covered, elapsed time since the start of the preparation, etcetera. Performance is measured in time to cover the marathon distance. Assume now you don’t observe the time but only the top ten places. This is a ranking that tells you the winner was faster than the second place and the second place faster than the third, and so on. What we do not know is how much faster the runners were. It is very unlikely that the runners were evenly spaced in time. We call this ranking an ordered variable which needs different models to analyse it, because we can’t quantify the distances between the ranks.
‘For the Mercedes campaigns, the main objective was to improve the depth of knowledge about the new car among potential new buyers. Mercedes used three major channels: TV, print, and online advertisements, to deliver the message. Obviously, knowledge about the new product is deeper if a target customer remembers commercials both from TV and print. However, we cannot quantify exactly how much “deeper” this is. But what we can say is that it is deeper the more channels that were remembered.’
Compared with some optimisation models this is not a particularly complex approach, but there is considerable uncertainty in the data – the model is driven, after all, by indirect opinions from surveys, not measurable facts. The more complex a model when using uncertain data, the more that uncertainty can be driven up, so care had to be taken to avoid producing a GIGO (‘garbage in, garbage out’) scenario, hidden by the complexity of the model.
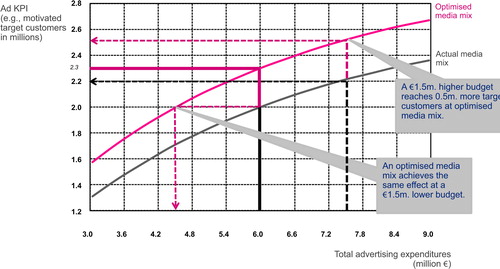
Management can use this curve to predict the increase in target customers by increasing the overall budget but without changing the media mix
FROM SURVEYS TO DATABASE
Accordingly, a significant amount of effort was put into data gathering and the quality of resultant database, which was built up over a range of campaigns. The underlying surveys were sent out by TNS. The aim was to have over 800 responses per campaign from a random sample, with the outcomes weighted to better represent the target customers.
If selected, a respondent was first asked what car they owned. (This was necessary to not repeat an infamous misuse of statistics, where a US car company claimed a huge percentage of the public liked their new car without pointing out that they only surveyed their existing customers.) Participants were then asked for their ‘sympathy’ with competitive car brands – effectively asking how close they feel to the different brands – to balance out any existing bias for or against Mercedes. This is a good example of the kind of question that has to be carefully handled, as many respondents may not feel close to such brands at all, so put in an arbitrary response which might not reflect reality.
To test recognition, participants were shown different adverts with the branding removed and asked which brand they were for. The subsidiary indicators of involvement and motivation were then brought in if the advertisement was recognised by asking yes/no questions. To finish off, responders were asked about their media consumption and demographic details.
One essential was to minimise the contribution of those who lost the will to contribute meaningfully. The average time to complete this survey was 40 minutes – a very significant commitment of time. While TNS ‘made sure that the survey was executed in a way that minimizes respondents’ fatigue’, it was inevitable that some would not give the questions sufficient consideration. As a result, data from anyone who spent less than 12 minutes on the survey was not used.
OPPORTUNITIES TO SEE
Inevitably there is a significant gap between the data gathered in the survey and reality. Ideally, the model would be driven by, for example, knowledge of exactly which adverts an individual watched. However, there is no practical way to discover this – particularly as consumers increasingly use technology such as personal video recorders and ad blockers which mean they don’t see adverts – so instead ‘opportunities to see’ (OTS) were calculated. For example, if someone said they watched a particular channel at a particular time twice every four weeks, during a period the advert was run over eight weeks, their OTS would be 2/4 × 8 = 4. This figure was modified with a probability adjustment depending on participants’ recall of the most recent equivalent period to try to counter potential bias in their memory.
A similar approach was taken to estimate OTS for newspaper and online advertising. In the case of newspapers, this was relatively simple, though with online banner adverts there was considerably more complexity because of the way that online advertising exposure is driven by complex search engine algorithms, so a Mercedes advert is not presented every time someone visits a page where it might appear.
Fischer used the model to derive a budget and media mix that achieved that target at the lowest possible cost
Starting with a target level for recognition and other indicators, Fischer used the model to derive a budget and media mix that achieved that target at the lowest possible cost, based on data from previous campaigns. As one output from the model, decision makers were given a table of predicted recognition, involvement and motivation given different budgets in €500,000 increments, with variants reflecting a campaign that is average, underperforming or overperforming. Towards the end of the campaign, there were sufficient new data to be able to, if necessary, modify the budget and media mix to reflect how the advertising was being received.
shows two curves that connect total campaign advertising expenditures with the predicted KPI level, measured in number of target customers. The lower curve reflects the chosen media mix. Management can use this curve to predict the increase in target customers by increasing the overall budget but without changing the media mix. The second curve is based on the optimal media mix. Management can use this curve in combination with the first one to answer various questions. For example (Example 1), assume the campaign budget is set at €6m, and the KPI target was set at 2m motivated target customers. By allocating the budget in an optimal way, there is a savings potential of €1.5m without affecting the KPI target.
FIGURE 2 EVALUATE ADVERTISING EFFECTIVENESS – PREDICT ADVERTISING KPIs (Illustrative example)
CUTTING COSTS
An important outcome of running the model was to help with the difficult decision of how to split the budget across the types of media. The expectation had been that TV ads would have become less significant compared with internet advertising. In practice, though, TV had not lost its appeal, if anything slightly growing, though budget was shifted from print to online. It’s easy to speculate about causes – that, for example, Mercedes customers tend to be older than most and are reading fewer newspapers than they once did – however, without the evidence provided by the survey this would be a gut feel approach, rather than data-driven.
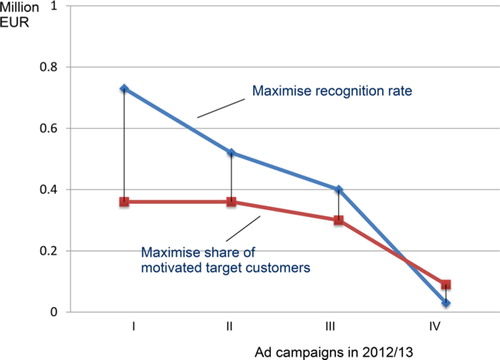
As shown in , over the four campaigns where the model was used in 2012/2013, there was a clear improvement in the way that the campaigns were set up, reflected in a reducing potential to save more by changing the mix of media used.
FIGURE 3 SAVING POTENTIAL FROM MEDIA MIX OPTIMISATION
Reflecting John Wanamaker’s dilemma, the most important contribution of the model would be if it could bring down the expenditure on advertising without reducing its impact. A senior executive, heavily involved in the project at Mercedes, estimated that they saved around €2m per campaign – 15 to 30% of the overall spend. While it wasn’t certain what would have been spent had the model not been used, data from 108 past launch campaigns were used to set a baseline. He also noted there was a ‘significant improvement of ad KPIs across campaigns from the recommended media shift’.
Fischer believes that his model has the potential to apply in other areas where brand is central to product launches
The model continued to be used in many more launches after the end of the initial project. Although specifically built for new car launches, Fischer believes that his model has the potential to apply in other areas where brand is central to product launches. There is no doubt that advertising remains something of a dark art, where it is difficult to quantify benefits. However, models such as Fischer’s are beginning to allow rationality to penetrate the darkness, providing guidance that improves outcomes and reduces costs.
Additional information
Notes on contributors
Brian Clegg
Brian Clegg is a science journalist and author and who runs the www.popularscience.co.uk and his own www.brianclegg.net websites. After graduating with a Lancaster University MA in Operational Research in 1977, Brian joined the O.R. Department at British Airways. He left BA in 1994 to set up a creativity training business. He is now primarily a science writer: his latest title Conundrum features 200 challenges in the form of puzzles and ciphers, requiring a combination of analytical and lateral thinking plus general knowledge.
FOR FURTHER READING
- Fischer, M. (2019). Managing Advertising Campaigns for New Product Launches: An Application at Mercedes-Benz. Marketing Science 38: 343–359.