

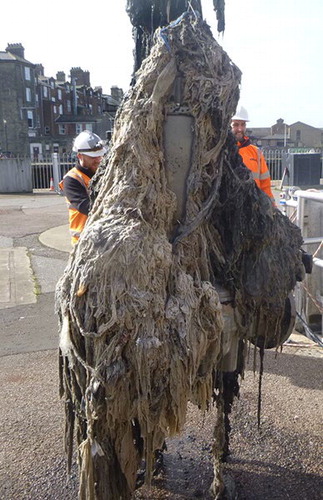
ANGLIAN WATER IS THE LARGEST WATER AND WASTEWATER COMPANY in England and Wales by geographic area. With the volume of waste received daily enough to fill over 300 Olympic sized swimming pools, travelling through 76,624km of sewers it is important to keep our sewers clear of blockages. Most blockages are caused by fats, oil and grease (FOG) or non-flushable items, so to combat this in 2010 we launched our Keep it Clear campaign, featuring the fatberg monster seen above.
Keep it Clear is our pioneering behavioural change programme focusing on key areas with high numbers of blockages across our region. We survey households, attend community events, work with schools and local food premise businesses with the aim of changing behaviours around what ends up in our sewers. Since the programme started in 2010 there has been an average reduction in blockages of 58% in 24 targeted areas.
THE CHALLENGE
Across our business we have a large amount of data and we use Excel to cleanse, manipulate and analyse data sets. This is fine if you are the person who has built the spreadsheet and understands the logic but most of the time it’s someone else trying to make a decision or drive an action from the insight produced. Using solutions such as Excel is a very manual process, with analysts spending time maintaining these processes rather than doing new value adding activities. It can also take a long time to process the data as Excel isn’t built for the large amounts of data we are trying to process daily.
The Keep it Clear team challenged us to do something different, create something which they could use to visualise, understand and share across their stakeholders to improve the impact data has on their campaign.
OUR COLLABORATIVE APPROACH
Often when you give a problem to a data analytics team they will take it, spend two weeks trying to solve it and then give you a result which is probably close to what you asked for but not quite right. At Anglian Water we are doing work with our Analytics Community to support analysts in working with their stakeholders to fully understand the problem and communicate progress. This improves the rate of work completed right first time and keeps the stakeholders engaged throughout the process.
This is the approach we used when building our Operations Dashboard solution and Survey123, both technologies provided by ESRI, the global market leader in Graphical Information Systems, which we had not used before. We worked with the Keep it Clear team each step along the way, firstly understanding what insight helps them drive decisions, building the dashboard or survey and then reviewing progress regularly. This approach helped the Keep it Clear team achieve the end result they wanted as well as giving them an understanding of the tools and how they have been configured and therefore how to use them. The collaborative approach between the teams was a success and is something we will look to recreate on future projects.
OPERATIONS DASHBOARD SOLUTION
is an example of the Operations Dashboard solution. At first glance it is easy to identify whether blockages are more or less than last month with the indicator in the top right-hand corner being either green or red. The dashboard is interactive, with the map being the main feature. You can search the areas or different sewer types and interact with the dashboard graphs which in turn changes the view on the map. This tool allows the users to work with the data in a visual manner and understand the data.
Figure 1 THE OPERATIONS DASHBOARD
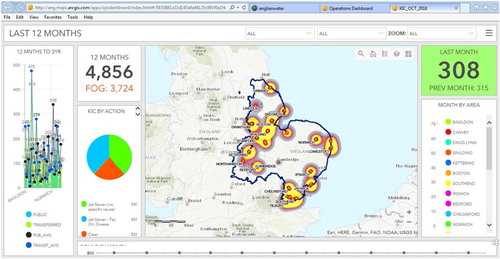
The Operations Dashboard... allows the users to work with the data in a visual manner and understand the data
SURVEY123 SOLUTION
is an example of Survey123, another ESRI product which has allowed us to digitise our survey solution. Previously our employees were having to attend with a laptop using SurveyMonkey and Google maps with paper as a backup in case they didn’t have signal. Then once they got back to the office they would update their spreadsheet. The Survey123 solution allows the user to complete the whole task using one app and has offline functionality. You can login to the app when you are back at the office to see the results and download them in an accessible format. We survey people multiple times to understand if there are changes to their behaviours following the campaign being in their area.
Figure 2 SURVEY 123
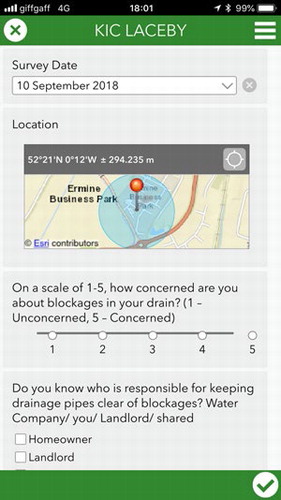
Rachel Dyson, Programme Manager Anglian Water Services Limited, said that “Survey123, which can easily be downloaded on to mobile phones, doesn’t require Wi-fi connectivity when out and about undertaking door knock interventions in hotspot blockage streets, meaning that behavioural and attitudinal survey responses can still be recorded on mobile phones and then downloaded direct to Excel when back in full Wi-fi connectivity. Previously the team would have to rely on pen and paper as a back-up and carrying bulky I-pads around”.
BUSINESS VALUE
The Keep it Clear programme has achieved reduced call outs, reduced blockages and therefore reduced disruptions to customers in the areas it has been targeting. The Operations Dashboard solution has enabled engagement with local stakeholders and supports informed decision making within the Keep it Clear team.
The solutions have also benefited the data analysts – increasing the amount of time they have to complete value adding activities rather than maintaining current processes and cleansing data
The solutions have also benefited the data analysts – increasing the amount of time they have to complete value adding activities rather than maintaining current processes and cleansing data.
Survey123 and the KIC dashboard has greatly improved the efficiency of the Keep it Clear team, as well as better targeting and analysis of hot spot blockage areas
Rachel Dyson sums it up: “Survey123 and the KIC dashboard has greatly improved the efficiency of the Keep it Clear team, as well as better targeting and analysis of hot spot blockage areas. Using the dashboard to visually engage local stakeholders and influencers on the local issues helps their understanding of underlying causes, which in turn helps these influencers communicate the local problems to residents and engage residents in helping prevent blockages, flooding and pollutions caused by fats, oils and grease (FOG) and unflushables such as wipes”.
Over the next five years we will be looking to target new areas across our region to keep driving down blockages. We will also look for new opportunities to use or data analytics skills to improve processes across out business.
Additional information
Notes on contributors
Lauren Knight
With a background in IT, Lauren Knight has worked in Strategy and Commercial focusing on strategy for Operational Technology for Anglian Water. When responsible for the GIS and Performance Data team, Lauren brought added insight to the organisation through the power of analytics. In her new role as Digital Partner, with her experience in both IT and data, she is supporting the business in its drive to become more digitally focussed.