

IN THE AUTOMOTIVE INDUSTRY, prototype vehicle production is an essential step within the product development process. Before production ramp-up and launch of any new car model, many prototype vehicles are required, mostly for testing but also for internal and external presentations.
For the Volkswagen brand (VW), approximately 3000 of those prototype vehicles are manufactured annually by 1200 employees of the Volkswagen Pre-Production Center (VPC). Due to shortages in manufacturing capacity, a large portion of production orders of VW prototype vehicles is outsourced to external manufacturing service providers every year. The shortages are mainly driven by an increasing product variety along with more extensive tests of functionality and an increase in electric vehicle components.
Since outsourcing of orders is very costly, increasing the internal manufacturing volume is a reasonable option to cut manufacturing costs substantially. Therefore, the planning task of capacity scheduling – the allocation of vehicle orders to manufacturing capacity – can be considered an important lever to improve resource utilisation, given the limited internal manufacturing capacity.
In close cooperation between academia and industry, we evaluated Operational Research solutions for the VPC’s capacity scheduling problem, which had previously been solved manually. Firstly, we developed and implemented a prototype for capacity scheduling based on binary integer programming. The prototype revealed a substantial potential to increase manufacturing volume by generating optimised plans. For that reason, we subsequently developed a spreadsheet-based decision support system for everyday planning. The tool was validated in a pilot test, revealing the cost savings of improved utilisation of internal resources to lie in the six-digit euro range per annum. In the following, we detail the characteristics of the capacity scheduling problem at the VPC and specify the critical factors to the success of our collaboration.
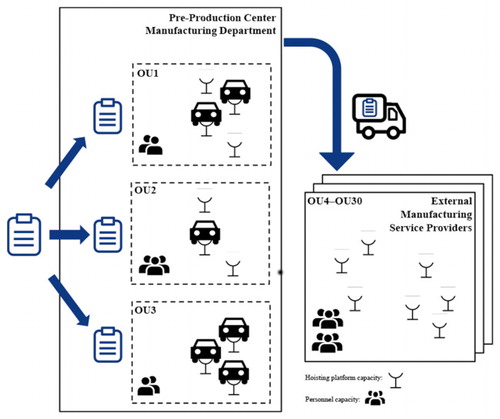
The organisational structure of the Volkswagen Pre-Production Center’s manufacturing department is subdivided into organisational units (OUs). One master craftsperson leads each OU, and the associated personnel are responsible for the timely completion of the orders centrally assigned to the OU. The centralised function of capacity scheduling decides on the executing OU and the assembly period of each order. Decisions on internal and external manufacturing and scheduling have to follow the aim of maximising the internal manufacturing volume to reduce the costs spent on external manufacturing of orders.
Within the planning period, compliance with the internal and external capacity restrictions has to be ensured for each OU. Two capacity constraints restrict the production volume. First, sufficient capacity of power-driven hoisting platforms is required. These are stationary devices to lift vehicles by their frames, and each prototype vehicle requires one hoisting platform throughout its assembly. Second, each OU has a prespecified number of skilled workers, providing a predetermined personnel capacity which must not be exceeded. The planning process is further restricted by release and due dates of each order, the availability of parts and components, and the clarification of the vehicles’ technical specification. Approximately 500 orders have to be allocated among 30 OUs within a planning period of 60 days. Therefore, the VPC faces a tremendous number of possible order allocations in their capacity scheduling and requires decision support on this problem. A general illustration of the planning problem is given in .
FIGURE 1 THE PLANNING PROBLEM OF THE VOLKSWAGEN PRE-PRODUCTION CENTRE. COPYRIGHT: INFORMS. FIGURE REPRINTED WITH PERMISSION
As a first step, we developed a binary integer programming (BIP) model to compare the results of the current (manual) planning procedure with the results from mathematical programming. The BIP maximises the internal manufacturing volume. Constraints are introduced to ensure that each order is assigned to one OU and during a feasible assembly period. Moreover, it is guaranteed that the capacity of personnel and hoisting platforms is not exceeded in any OU and period. Orders already started are not allowed to be reallocated. We assume each period to comprise one day in a real-world setting.
We compared the plans obtained by the BIP with the manually generated plans. On average, we found the total manufacturing volume to increase by 38.7% using our plans rather than the manually generated ones. This is mainly due to better utilisation of the personnel capacity with an increase of about 36%. The average hoisting platform utilisation, though, remained on its former level. In the majority of cases, the hoisting platforms are operated at their capacity limits. Regarding the orders’ characteristics, on average, more orders (+10%) with a longer duration of the assembly activity (+12%) as well as more hours of assembly per order (+32%) are selected by the BIP for internal assembly compared with the manual planning.
Therefore, we came up with the idea of introducing a general planning rule to decide on the allocation and schedule of orders. Choosing orders with an unusually long duration yields no consistently beneficial solution – the rule aims at utilising hoisting platforms over time but neglects the personnel capacity. Choosing orders with many hours of assembly per order aims to utilise the personnel – this rule neglects the hoisting platform capacity over time. Therefore, we considered the trade-off between the two resource types as essential and suggested selecting those orders that have a high ratio of hours of assembly to its duration. Utilising this planning rule, orders generating as much manufacturing volume (hours) as possible per unit of hoisting platform capacity and time unit should be chosen. Using the BIP, we were able to generate sound insights into the potential of increasing the manufacturing volume. The implementation, however, raised some drawbacks, particularly since additional commercial software was required and it did not comprise a comfortable user interface. The VPC maintains preference toward spreadsheet-based solutions because planners are familiar with their functionality, and the spreadsheet software package is available in the corporation. To exploit some of the potentials we decided to develop a tool for everyday planning and implemented a decision support system (DSS) in Microsoft Excel and utilised Visual Basic for the algorithm.
We faced two major challenges: determining the structure and interface of the spreadsheet model and developing a suitable planning algorithm. First, we introduced the main sheet comprising all relevant information on orders, mainly information imported from a data warehouse (). Input data are automatically read and illustrated in white-shaded cells. This information, extracted from Enterprise Resource Planning (ERP), serves as parameters for the capacity scheduling problem. All planning functionality is based on Visual Basic and called using the blue buttons at the top of the spreadsheet. Data illustrated are generated arbitrarily for confidentiality reasons.
FIGURE 2 MAIN SHEET OF THE DECISION SUPPORT SYSTEM (DSS). USED WITH PERMISSION FROM MICROSOFT. COPYRIGHT: INFORMS. FIGURE REPRINTED WITH PERMISSION
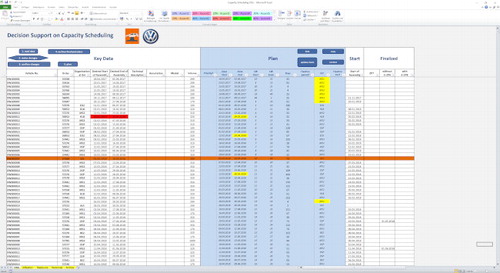
The sheet additionally serves to control the automated functions such as data synchronisation and launch of the planning algorithm. We paid particular attention to developing a user-friendly interface that allows for hands-on interaction and improves the system’s acceptance among the users. We opted to use colours to indicate different events in the planning tool consistently throughout the DSS. For example, we indicate whether data can be manipulated manually, such as planning results given in blue-shaded cells, or may not be manipulated manually, such as external information shown in white-shaded cells. Furthermore, we highlight updated information visually after the data synchronisation using orange-shaded cells. Additionally, a feasibility check of data from the data warehouse is implemented to indicate inconsistent data sets using red-shaded cells. Differences between the ERP data and the results of the planning algorithm are highlighted in yellow-shaded cells. The resulting quality of the plan generated by the algorithm is reported visually, subdivided by OU. Here, personnel and hoisting platform utilisation is of particular importance.
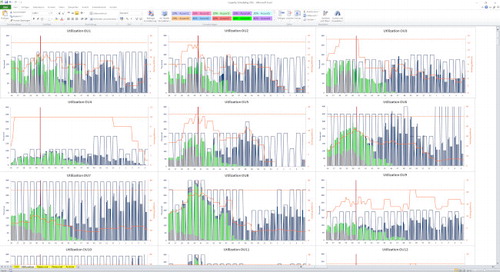
The utilisation of personnel and hoisting platforms is reported using utilisation diagrams individually for the different organisational units in the DSS (). Colours are used to differentiate between the resource types. Available and utilised hoisting platform capacity is illustrated on the right-side scale in orange. Personnel utilisation is illustrated on the left-side scale differentiated by completed orders (grey), started orders (green), and planned orders (blue). Diagrams are generated using Visual Basic functionality. Data illustrated are generated arbitrarily for confidentiality reasons.
FIGURE 3 UTILISATION DIAGRAMS REPORTING THE UTILISATION OF PERSONNEL AND HOISTING PLATFORMS. USED WITH PERMISSION FROM MICROSOFT. COPYRIGHT: INFORMS. FIGURE REPRINTED WITH PERMISSION
Regarding the planning algorithm, we decided to follow a heuristic approach that integrates three components: initialisation, constructive method, and improvement method. While during initialisation ERP data on the manufacturing orders is fed into the DSS, the constructive method ensures that orders are assigned to the OUs and assembly periods according to the planning rule derived from the BIP results. The generated plans may, however, violate capacity restrictions. Overcoming these violations by outsourcing orders is the aim of the improvement method.
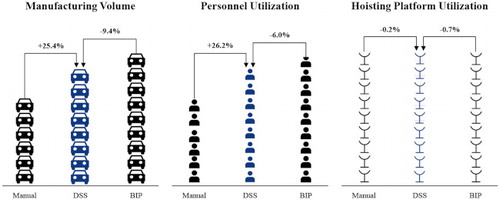
The performance of the DSS in comparison with the manual planning approach and the BIP in terms of internal manufacturing volume as well as the utilisation of available capacity (personnel and hoisting platforms) is reported in in terms of obtained mean values for internal manufacturing volume, personnel utilisation, and hoisting platform utilisation. Levels are scaled arbitrarily for confidentiality reasons. On average, the algorithm increases the internal manufacturing volume and personnel utilisation by around 25% when compared with manual planning results, whereas the hoisting platform utilisation remained almost the same. For the DSS, we had to introduce additional constraints from the real-world problem which are unconsidered in the BIP. Therefore, the BIP results overestimate the real potential.
FIGURE 4 COMPARISON OF THE RESULTS OF OUR DSS WITH MANUAL PLANNING AND THE RESULTS OF OUR PROTOTYPE BASED ON BIP. COPYRIGHT: INFORMS. FIGURE REPRINTED WITH PERMISSION
During a two-month pilot test, we held regular meetings to validate the generated schedules and give tutorials on how to use the DSS. As most of the logic of the DSS is implemented in Visual Basic and works invisibly in the background, we invested much time in explaining the theory behind the model, the underlying assumptions, and the implemented planning rules. This helped to build trust in the tool for the members of the VPC. At the end of the pilot test, our tool was implemented for capacity scheduling in everyday planning. As expected, the generated plans exhibited excellent quality and significantly increased the utilisation of personnel and the internal manufacturing volume. The VPC estimated the cost savings to lie in the six-digit euro range per annum, attributed to the reduced amount of outsourcing activities. A further substantial benefit resulted from a decreased internal planning effort, which gives the VPC more time to concentrate on the continuous improvement of their planning processes. This resulted in considerably improved data management and data transparency, making the application of the DSS even more valuable. Since we based the planning on ERP data, higher data transparency and improved data control mechanisms were established. Using the tool, planners perceive what their data are used for and how bad data negatively influence the planning quality.
Several critical factors made our collaboration successful. Firstly, the relationship between academic and industrial partners is of mutual trust, which was built during a series of workshops before the actual collaboration. Secondly, we gained the valuable support of the management of the VPC, facilitating a successful composition of the project team and the deployment of effective project management. The fruitful cooperation between the planning department, the IT department, and academia were of utmost importance for the project’s success. It would not have been possible without the full support of the management. Further, we decided to utilise an agile procedure following the Scrum framework well known from software development projects. Intensive communication was supported among all team members about the project status, the need for modifications, and the next steps.
Additional information
Notes on contributors
Christian Weckenborg
Christian Weckenborg leads the research field on Digitization at the Institute of Automotive Management and Industrial Production at Technische Universität Braunschweig, Germany.
Karsten Kieckhäfer
Karsten Kieckhäfer is Professor of Production and Logistics Management at FernUniversität in Hagen, Germany.
Thomas S. Spengler
Thomas S. Spengler is Professor of Production and Logistics Management and Head of the Institute of Automotive Management and Industrial Production at Technische Universität Braunschweig, Germany.
Patricia Bernstein
Patricia Bernstein is the former Head of the manufacturing department of the Pre-Production Center of Volkswagen in Wolfsburg, Germany.
Marko Hahn
Marko Hahn took her place and is currently the Head of the manufacturing department.
FOR FURTHER READING
- Weckenborg, C. , K. Kieckhäfer , T.S. Spengler and P. Bernstein (2020). The Volkswagen Pre-Production Center Applies Operations Research to Optimize Capacity Scheduling.. INFORMS Journal on Applied Analytics 50 , 119–136.