
Abstract
Background: Vitamin D deficiency is fast emerging as a global pandemic. In South Africa few studies have been conducted to determine the vitamin D status of the healthy population.
Methods: This prospective study with an analytical component investigated vitamin D status of healthy undergraduate students at two time points (winter and summer) at Stellenbosch University. Serum 25(OH)D was determined, anthropometric measurements taken and dietary vitamin D intake estimated (food-frequency questionnaire). Skin tone was determined (Fitzpatrick skin type classification), and a skin reflectometry device used to measure dermal melanin content.
Results: Results of 242 students indicated a mean serum 25(OH)D of 63.80 ± 41.35 ng/ml and a high prevalence of vitamin D sufficiency (88%). Significantly more females experienced suboptimal vitamin D levels than males (18 vs. 5%; p < 0.01). Participants with lighter skin tones had higher levels of 25(OH)D than those with darker skin tones (chi-square = 24.02; p = 0.02). The majority (60.74%) had a normal BMI, although there was no significant relationship between BMI and serum 25(OH)D (Spearman’s r = –0.11; p = 0.09). Total mean dietary vitamin D intake was 7.99 ± 13.81 mcg, with 87.2% having inadequate intake (< 15 mcg). The relationship between total vitamin D intake and serum 25(OH)D was found to be significant in winter (p < 0.001) and summer (p = 0.01). Serum vitamin D levels were significantly higher in the winter phase (p < 0.001).
Conclusions: A low prevalence of vitamin D deficiency was found amongst healthy young adults, despite low dietary vitamin D intakes. Significant relationships were found between serum 25(OH)D and gender, skin tone and vitamin D intake. Further studies need to be conducted, especially in high-risk groups, before results are applied to the greater South African public.
Introduction
Vitamin D, which is well known for its key role in intestinal calcium absorption and bone health, has recently gained renewed interest with new evidence pointing towards its important role in a multitude of other non-skeletal functions in the body.Citation1–3 Several association studies have related vitamin D deficiency and living at higher latitudes to increased risk for many chronic diseases including autoimmune disease, some cancers, cardiovascular disease, infectious disease, schizophrenia and type 2 diabetes.Citation4
Several factors may affect the vitamin D status of an individual, including seasonal variations,Citation5 residing in areas with lower ultraviolet (UV) intensity, ageing, gender and increased vitamin D requirements during pregnancy and lactation.Citation6 Other vitamin D reducing factors include obesity, lack of physical activity, darker skin tone,Citation5 as well as the amount of melanin pigment present in the skin.Citation7 Prevalence studies pertaining to the global vitamin D status of healthy individuals indicate a poor vitamin D status and a high prevalence of vitamin D deficiency in many countries;Citation8,Citation9 however, African countries close to the equator appear to have sufficient, or even above sufficient serum levels.Citation8,Citation9
In the South African context, there have been studies conducted to investigate vitamin D status, but most of these have focused either on children or on the effect of vitamin D status during infectious and chronic diseases, such as tuberculosis, HIV and diabetes. The studies do, however, mimic the global patterns of the skin tone–serum 25(OH)D relationship. A darker skin tone was associated with a higher prevalence of vitamin D deficiency in tuberculosis patients (Cape Town),Citation10 and a higher risk for vitamin D deficiency and insufficiency in urban school children (Johannesburg).Citation11 The latter study also found that seasonal variations in 25(OH)D levels had a greater effect on lighter skinned children than their darker skinned counterparts.Citation11 Minimal studies have been conducted to investigate the vitamin D status of the general healthy adult population of South Africa (SA), which will assist in the formulation of up-to-date and relevant recommendations regarding vitamin D testing in at-risk groups, vitamin D intake, supplementation, and possible food fortification programmes in an attempt to optimise the health status of all South Africans.
This study therefore aimed to determine the serum 25(OH)D levels of healthy adults in the Western Cape province of SA at two time points (end of winter and end of summer), as well as to determine its relationship to several factors, including skin tone, gender, dietary vitamin D intake, certain anthropometric measurements and lifestyle factors.
Methodology
Study population
A prospective, longitudinal study with an analytical component was undertaken as a single-centre study in Cape Town, South Africa (latitude: 33°55′33″ S, altitude: 42 m) in two phases: baseline (winter: six weeks post-solstice) and follow-up (summer: six weeks post-solstice). Participants were enrolled from the Faculty of Medicine and Health Sciences (FMHS) of Stellenbosch University (SU) and represented a diverse group including both genders and various ethnicities/skin tones. Participants were enrolled into the study during August 2016 and were included if they were undergraduate students > 18 years of age, English and/or Afrikaans speaking and considered themselves to be healthy. Participants were excluded if they were final-year undergraduate students or postgraduate students, suffering from a chronic illness and/or disease that may impact vitamin D status, taking medications that may interfere with vitamin D metabolism, and also pregnant and/or lactating.
A multi-stage sampling strategy was employed, including a screening phase and a final selection phase. Sample size was determined using a power calculation with 90% power for one-way analysis of variance for continuous variables. Based on an RMSSE of 0.35, the minimum population size required for each group (based on the main stratum: skin tone) was 100 participants (thus 200 participants in total). Students were screened prior to study enrolment according to inclusion/exclusion criteria. Those meeting inclusion criteria were stratified for skin tone and gender. Screening continued until all strata were oversampled. During the final selection phase, simple random sampling was performed within these strata to ensure equal representation of skin tone and gender in each stratum, as well as to prevent selection bias. To compensate for loss to follow-up, the initial sample in the first data collection phase (baseline phase) was oversampled by 20% (thus the researchers aimed to recruit 240 participants in total). Participants participated in both data collection phases (winter and summer) and acted as their own controls.
Data collection
Participants who were selected to take part in the final selection phase were contacted for their approval, and given a suitable date and time to attend for data collection. During this phase, the researchers and data collectors again explained the study and its aims to the participants, explained the concepts of voluntary participation and confidentiality, and answered any questions or concerns the participants had. A consent form was completed during the winter phase and a copy was given to the participant for their records. A total of three questionnaires were completed by the participants: sociodemographic questionnaire, sun exposure questionnaire and skin tone questionnaire, and food frequency questionnaire. In addition, anthropometry was done and a serum sample to determine 25(OH)D levels was collected for each participant. Each participant spent between 25 and 50 minutes completing all phases of data collection.
Questionnaires
Two questionnaires were developed for completion by the participant, namely: (a) sociodemographics, health status, lifestyle factors, and (b) skin type (Fitzpatrick skin phototype classification) (FST)Citation12 and level of sun exposure. The third questionnaire was an interviewer-administered food frequency questionnaire (FFQ) with a focus on dietary sources of vitamin D (especially those found in South Africa) and supplement use. The FFQ was validated for both content and face validity, and comments incorporated into the final questionnaire. Food models were used by the researchers to help the participants visualise a medium portion, and how much they ate in relation to this portion. All data collectors involved in this section of data collection were trained on standardisation and how to accurately and consistently complete the FFQ. The FFQ took approximately 10–15 minutes to complete. The data collected from this questionnaire were analysed using a validated software programme that details how much vitamin D each food item contains per serving (MRC FoodFinder 3; https://mrc-foodfinder.software.informer.com/3.0/).
Anthropometry
Basic anthropometric measurements (weight [Seca 874 flat scale; Seca GmbH, Hamburg, Germany], height [stadiometer] and waist circumference [non-stretch tape measure]) were taken at both winter and summer phases (height obtained only during the winter visit). The average of three measurements was taken. Body mass index (BMI) and waist circumference were interpreted using the World Health Organization (WHO) reference values.Citation13 A trained dietitian was responsible for all measurements according to standardised procedures.Citation14 Relevant anthropometric equipment was calibrated daily during data collection.
Skin reflectometry
Skin reflectometry of all participants, expressed as erythema index (EI) and melanin index (MI), was measured using a portable reflectometry device (DSM II ColorMeter; Cortex Technology, Brisbane, Australia). Measurements were taken on healthy, intact skin. Constitutive pigmentation was measured on the upper inner arm site, and facultative pigmentation measured on the forehead. Three independent measurements were taken from each site, and the mean calculated. The colorimeter was calibrated daily, using the supplied calibration technology.
Biochemistry
Blood samples (5 ml) were drawn by venepuncture by a registered phlebotomist. Samples were transported under correct storage conditions to the laboratory of the National Health Laboratory Services (NHLS), situated at Tygerberg Hospital. The blood samples were clotted for a minimum of 20 minutes, followed by centrifuge and aliquoting and stored in Eppendorf tubes at −20°C until analysed. Analysis of biochemical samples was performed only after each phase of the data collection was completed. Serum 25-hydroxyvitamin D was measured by a chemiluminescent assay using DiaSorin Liaison kits (DiaSorin, Stillwater, MN, USA). All the samples were run in duplicate and analysis was performed by the MRC/Wits Developmental Pathways for Health Research Unit (DPHRU) laboratory. Serum values (ng/ml) were interpreted according to optimal ranges (ng/ml) for 25-hydroxyvitamin D [25(OH)D] ().Citation15,Citation16
Table 1: Interpretation of serum 25-hydroxyvitamin D (25(OH)D) levels
Pilot study
A pilot study was conducted to test the face validity of both the screening and the data collection questionnaires prior to study commencement. Data obtained during the pilot study were not included in the main study and pilot study participants did not participate in the main study. For content validity, two experts in the field of diet methodology were asked to assess questionnaires (including the FFQ) and to provide suggestions for improvement.
Ethics approval
The study was approved by the Health Research Ethics Committee of Stellenbosch University (N16/01/013), and institutional approval was obtained from SU (Institutional Research and Planning Division). Written informed consent was obtained at two time points (screening and start of the main study) after explaining the purpose of the study in sufficient detail, with participants having the opportunity to ask questions to clarify any issues. Privacy of participants for the duration of the study was ensured by making use of a confidential approach. Participants who requested their vitamin D serum results provided consent enabling them to be identified through their data. All data were, however, de-identified once data analysis began.
Statistical analysis
The data were entered using MS Excel 2010 (Microsoft Corp, Redmond, WA, USA) and statistical analyses were performed using STATISTICA version 13 ([2015], Dell Inc, Round Rock, TX, USA). Summary statistics were used to describe data. Results were expressed as mean ± standard deviation. For variables measured repeatedly over time, repeated measures ANOVAs were done with the compound symmetry assumption on the correlation structure over time. Data were weighted where necessary to ensure appropriate conclusions could be drawn. A p-value of p < 0.05 represented statistical significance in hypothesis testing and 95% confidence intervals were used to describe the estimation of unknown parameters.
Results
Demographics
A total of 242 participants took part in the study during the initial winter data collection period in 2016 (121 males and 121 females). The median age was 20.0 years (mean age: 20.4 ± 2.3 years). The race distribution of the study population was predominantly white, mixed race and African, with Asian and Indian races accounting for only 2.5% and 5.4% respectively. More than half of the participants came from the Western Cape (59.1%), followed by KwaZulu-Natal (11.9%) and the Eastern Cape (9.5%). The demographics of the study population can be seen in .
Table 2: Participant demographics and descriptive statistics: winter phase
Serum vitamin D levels
The results from the winter period showed a mean serum 25(OH)D of 63.8 ± 41.4 ng/ml (). Using the Endocrine Society (ES) interpretation of serum 25(OH)D, almost three-quarters of the participants (73%) had sufficient or above sufficient levels of 25(OH)D in their blood. When using the Institute of Medicine (IOM) interpretation, however, this level rose to 88% (n = 214). Toxicity was experienced by 8% (n = 19) of participants (ES) and increased to 54% (n = 127) when using the IOM interpretation. Insufficiency and deficiency only accounted for 12% (n = 28) of the total population when the IOM reference values were used.
Males had significantly higher mean serum 25(OH)D levels than females (69.0 ± 38.3 ng/ml and 58.6 ± 43.7 ng/ml respectively) (p < 0.01). More females experienced suboptimal vitamin D levels compared with males (18% vs. 5%).
Skin tone
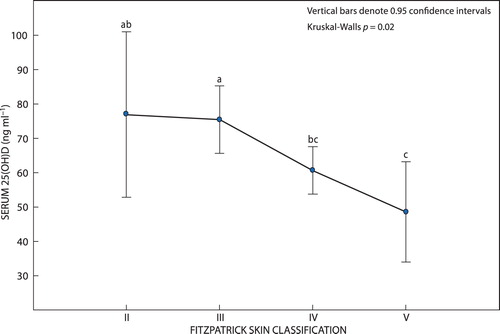
Scores from the self-administered FST questionnaire show that more than half of the participants (55%; n = 133) placed themselves in the type IV skin tone group (light brown skin). Some 28% (n = 67) identified themselves as type III (dark white skin), 12% (n = 30) identified themselves as type V (brown skin), while 5% (n = 11) identified themselves as type II (fair skin). No participants identified themselves as type I (pale white skin) and only one participant identified as type VI (dark brown skin). Participants with lighter skin tones (II and III) had significantly higher levels of 25(OH)D than those with darker skin tones (IV and V) (p = 0.02) (). (The ANOVA test and LSD multiple comparisons were confirmed by the corresponding Kruskal–Wallis non-parametric test).
Figure 1: Serum 25(OH)D and Fitzpatrick skin type classifications. Participants with lighter skin tones (II and III) had significantly higher 25(OH)D levels than those with darker skin tones (IV and V) (p = 0.02).
Anthropometry
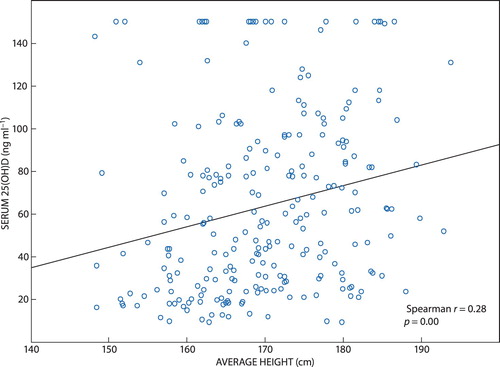
The majority of participants had a normal BMI (60.7%, n = 147) and just over a quarter (26.0%; n = 63) were classified as overweight. The mean BMI for the total population was 24.5 ± 4.0 kg/m2, with very little difference in mean BMI between the genders. Even though the relationship between BMI and serum 25(OH)D was not found to be significant (r = −0.11; p = 0.09), the relationship between height and serum 25(OH)D was, with taller participants having higher serum 25(OH)D levels (r = 0.28; p < 0.001) (). In total, 80% of participants (n = 194) had a normal waist circumference. While the relationship was not significant, those with higher WC measurements were more likely to have an insufficient vitamin D status (Kruskal–Wallis: p = 0.15).
Figure 2: Serum 25(OH)D and height.
Dietary vitamin D levels
Total mean dietary vitamin D intake was 8.0 ± 13.8 mcg, with 87.2% of participants consuming less than the recommended daily intake of vitamin D (15 mcg). The most commonly consumed vitamin D rich food groups were milk and milk products, fish and seafood, and vegetables. More vitamin D came from the diet (63%) than from supplemental sources (37%). Males consumed more vitamin D than females (9.6 ± 9.5 mcg and 6.3 ± 16.9 mcg respectively) (p < 0.01). The relationship between total vitamin D intake and serum 25(OH)D was found to be weak, but statistically significant (Spearman correlation: r = 0.14; p = 0.03).
Lifestyle factors
In general, sun exposure and lifestyle factors were not found to have an effect on serum 25(OH)D levels in this study. While tobacco use did not have a significant effect on serum 25(OH)D levels (Mann–Whitney U; p = 0.48), it was observed that the participants who used tobacco had lower serum 25(OH)D levels than those who did not. Higher mean 25(OH)D levels were observed in those who used alcohol, although this relationship was not statistically significant. The relationship between exercise and serum 25(OH)D was not significant (Mann–Whitney U; p = 0.15), but those who partook in physical activity had higher 25(OH)D levels than those who did not. Altogether, 91% of participants used sunscreen to some degree, with only 10% of participants applying sunscreen all the time. The relationship between the duration of sun exposure and vitamin D status was not found to be significant (chi-square = 10.04; p > 0.05). There was also no significant relationship between serum 25(OH)D levels and frequency of sunscreen application or actual SPF used.
Seasonal variation
Of the initial 242 respondents entered into phase 1 (winter) of the study, 88.0% (n = 213) returned for phase 2 (summer). highlights the changes (VEPAC paired analysis) between winter and summer data. Significant changes between average values for winter and summer were found for WC, FH EI, UIA MI, total EI, total MI, and serum 25(OH)D levels. This was confirmed by the Wilcoxon matched pairs test (n = 213 vs. 213).
Table 3: VEPAC paired analysis of participants who returned for phase 2 of study
Serum vitamin D levels were significantly higher in the winter phase (64.1 ± 41.2 vs 53.4 ± 32.3, p < 0.001). No significant difference was found in the classification of serum vitamin D status based on the IOM classification system. Males once again had significantly higher mean serum 25(OH)D levels than females (winter: 69.0 ± 38.3 ng/ml vs. 58.6 ± 43.7 ng/ml, p < 0.01; summer: 56.6 ± 3.1 vs. 50.1 ± 3.2, p = 0.03).
The relationship between total vitamin D intake (i.e. from dietary and supplemental sources) and serum 25(OH)D levels was statistically significant in the second phase (i.e. summer phase) of the study (Spearman correlation r = 0.170; p = 0.01).
The mean serum 25(OH)D level was lowest for the Indian population (winter: 38.4 ± 22.5 ng/ml, summer: 28.6 ± 8.6 ng/ml) and highest for the white population (winter: 79.9 ± 42.5 ng/ml, summer: 64.2 ± 3.4 ng/ml) (p < 0.01, Mann–Whitney for winter and summer).
Discussion
Vitamin D status
The high prevalence of vitamin D deficiency worldwide is a global concern.Citation9,Citation17 The results of this study, however, show a high prevalence of vitamin D sufficiency in young healthy adults living in the Western Cape. Some South African studies have found a high prevalence of vitamin D deficiency,Citation10,Citation18 while others support the results of this study of adequate vitamin D status.Citation11,Citation19 Martineau et al. (2011) showed a high prevalence of vitamin D deficiency in black Africans in a study conducted in Cape Town, South Africa, whereby 62.7% of the study population were found to have deficient levels of the nutrient. This deficiency was also linked to an increased susceptibility to active TB development (HIV-infected and non-HIV infected).Citation10 Conversely, in a prospective study conducted in Johannesburg, South Africa, amongst young children, results showed that vitamin D deficiency (7%) and insufficiency (19%) were not common in the study population (n = 385).Citation11 Lategan et al. (2016) conducted a study on an urban black population in Mangaung, South Africa, and found that 96% of the study population (n = 339) had adequate levels of vitamin D.Citation19
The first phase of the study was conducted at the end of winter (six weeks post winter solstice), a season when many global studies have reported a strong tendency towards vitamin D deficiency.Citation20–22 Studies in children and adolescents in Turkey and Algeria indicate lower levels of serum 25(OH)D in autumn/end of winter.Citation23,Citation24 Similarly, a study in adults in Sao Paulo found that hypovitaminosis D was more prevalent at the end of winter.Citation25 In many studies varying cut-offs and interpretations of vitamin D deficiency and insufficiency are used that further complicate comparison between studies. Bearing in mind the findings of these studies, as well as the time of data collection, it was expected that a higher prevalence of hypovitaminosis D would be found in this study.
In the winter of 2016, however, Cape Town experienced low levels of rain and unseasonably high temperatures and UVB indexes as a result of El Niño, which affected the country’s natural rainfall patterns.Citation26 Increases in surface sea temperature in the oceans surrounding South Africa have led to changes in the wind patterns of some coastal towns and cities.Citation27 These changes have been exacerbated by El Niño events and have led to changes in the Cape Town weather pattern. Previously experiencing extreme rains during the winter season, Cape Town has in the last few years experienced much dryer winters. These changes in the South African climate have not only altered the seasonal rainfall patterns, but have also affected seasonal temperatures, making the weather warmer and milder in seasons when it has been traditionally colder. Meteorological predictions for South Africa have forecast temperature increases of up to 4°C before the dawning of the next century.Citation28 These changes in seasonal weather patterns could have encouraged participants to venture outside, increasing their exposure to natural UVB radiation.
The results of this study were also unexpected as Cape Town has a low latitude. Latitude has been found to have a significant effect on vitamin D3 synthesis.Citation29 UVB intensity is linked to latitude, with those people living closer to the equator often experiencing sufficient levels of 25(OH)D.Citation30,Citation31 Many studies have found that those living at low latitudes have lower levels of 25(OH)D when compared with those living at higher latitudes.Citation32,Citation33 While the winter data collection period took place almost directly after the university’s mid-year break, allowing those in residence to return to their home provinces with higher latitudes than Cape Town, it is unlikely to have had a major effect on serum 25(OH)D levels.
Seasonal variation
Results depicting differences in seasonal variation of serum vitamin D levels were surprising. The literature often supports increased serum levels during the summer period followed by lower levels in winter.Citation5,Citation34–36 The results of this study, however, were contradictory, with significantly higher levels found during the winter phase. Possible reasons for this unusual finding include an increased sensitivity to the study outcomes (i.e. greater sunscreen use, use of a sunscreen with a higher SPF, remaining indoors or covering up during peak sun exposure times due to raised awareness during the winter phase due to knowledge gained during the study) and the climate changes and associated behaviour as described previously.
Gender and 25(OH)D
Males in this study had significantly higher levels of 25(OH)D than females. These results are in agreement with some South African and global studies.Citation19,Citation35,Citation37–39 Not all studies support lower serum 25(OH)D in females, however.Citation40 Additionally, Hovsepian et al. studied vitamin D deficiency in Iran and concluded that women in that region experience more severe vitamin D deficiency than men only because of the clothing restrictions imposed upon them.Citation37 As there were few female participants in this study who reported that they were required to cover all parts of their body, cultural and religious clothing restrictions were unlikely to have influenced the serum 25(OH)D results. Additional reasons for increased 25(OH)D in males could be due to higher testosterone levels,Citation41 as well as increased vitamin D requirements and intake.Citation42 Conclusions based on the gender results of this study need to be made with caution, as the relationship between gender and serum 25(OH)D is rarely studied in isolation.
Skin tone
In this study we found that participants with lighter skin tones had higher (sometimes toxic) levels of 25(OH)D than those with darker skin tones (e.g. Indian participants), who are often more likely to experience low serum 25(OH)D levels. Participants from the Indian population had the lowest 25(OH)D levels. This finding was similar to studies conducted in both South AfricaCitation18,Citation43,Citation44 and India,Citation45 which showed a high prevalence of vitamin D deficiency and/or risk of deficiency amongst this population. Low dietary calcium intake, phytate-rich diets, cultural and religious clothing choices, and limited exposure to sunlight are all thought to be contributing factors to the high prevalence of vitamin D deficiency in this group.Citation43,Citation45
Lighter skinned people may therefore require less UVB exposure to synthesise vitamin D3 than their darker skinned counterparts. While those who have darker skin tones often have lower 25(OH)D levels, some researchers have argued that serum 25(OH)D may be more bioavailable in people with darker skin tones, and darker skin toned people are not necessarily more at risk for poor bone health.Citation46–49 The lower levels of 25(OH)D found in those with darker skin tones is thought to be a protective, evolutionary development related to the climate one is exposed to, preventing those who are exposed to extended natural UVB radiation from developing undesirable side effects.Citation6
Based on the above, it may be prudent to have different recommendations for different skin types when it comes to sun exposure. Exposure to UVB radiation, however, is controversial, with many cancer organisations encouraging people to avoid sunlight at certain times of the day to decrease their risk of developing skin cancers.
Anthropometry
The majority of this study population was classified as having a healthy bodyweight, with very few participants classified as obese. While no statistical significance in the relationship between anthropometric measurements and serum 25(OH)D was found, there was a trend observed showing that those participants with higher BMIs and waist circumferences were more likely to be classified as vitamin D insufficient. Previous literature has also linked excessive anthropometric measurements with vitamin D deficiency.Citation35,Citation40,Citation50–52 Not all research supports the results found in this study, however, which links to the hypothesis of needing additional body fat to absorb and store vitamin D, a fat-soluble vitamin.Citation53
Additionally, taller participants were found to have higher serum 25(OH)D levels. This finding has been echoed in some studies conducted amongst young femalesCitation54 and adolescent girls.Citation55 Given the role of vitamin D in skeletal development, it would therefore be interesting to explore whether a prolonged vitamin D deficiency could possibly lead to a reduced height measurement, or even stunting, even without clinical presentation of rickets.Citation56
Diet
Oral intake of vitamin D, via food sources or supplementation, is one of the main ways, other than epidermal UVB exposure, that vitamin D is absorbed into the body.Citation57 In this study, the vast majority of participants consumed insufficient daily vitamin D to meet the recommendation of 15 mcg/day. These findings were expected as, first, vitamin D foods are not regularly eaten by all South Africans, and food preparation methods, such as frying, may further decrease the vitamin D content of these foods (especially as many participants in this study did not prepare their own food)Citation57 and, second, South Africa does not currently have any formal vitamin D food fortification programmes, nor does it prioritise vitamin D supplementation at a provincial or national level. In lieu of fortification, supplementation is another avenue used to increase serum 25(OH)D levels. This has been shown to improve serum 25(OH)D levels as compared with non-supplemented individuals.Citation58
Study strengths included the use of validated tools, a sample size that carried statistical power, sampling techniques that reduced selection bias, and the use of an accredited laboratory which used accepted methods for testing serum 25(OH)D. Limitations included no accepted reference values for the melanin index readings, as well as recall bias during the completion of the food frequency and sun exposure questionnaires.
Recommendations for future studies include investigation into vitamin D levels in different population groups and age brackets (including high-risk groups, e.g. pregnant women, children, the elderly, the institutionalised, those with absorption disorders, and those on certain medications, such as antiretrovirals), other areas in South Africa that have alternative latitudes and differing levels of exercise. There is also a need to further investigate optimal reference values for MI using skin reflectometry, to allow for improved comparison across studies. Furthermore, the vast array of cut-offs used to define vitamin D deficiency and insufficiency also complicate comparison between studies, and as such international consensus will greatly aid interpretation of future studies.
Conclusion
There is currently a great need to quantify and diversify sun exposure recommendations for the general population, in order to ensure optimal vitamin D levels. The delicate balance between the sun exposure required for good health and the exposure that results in undesirable side effects is still unclear in the literature. The vague, one-size-fits-all recommendations that are often disseminated to the public might not be sufficient to ensure that people of all skin tones experience enough exposure to natural UVB radiation to produce the levels of vitamin D required for good health. In this study, a low prevalence of vitamin D deficiency was found amongst healthy young adults, despite low dietary vitamin D intakes. Further studies need to be conducted, especially in high-risk groups, before results are applied to the greater South African public.
Acknowledgements
The authors acknowledge the study participants for their participation in the project, as well as CANSA for their funding of this study.
Disclosure statement
No potential conflict of interest was reported by the authors.
ORCID
J Visser http://orcid.org/0000-0002-4844-9275
DG Nel http://orcid.org/0000-0003-0998-3405
R Blaauw http://orcid.org/0000-0001-7413-5918
Additional information
Funding
Related Research Data
References
- Christakos S, Hewison M, Gardner DG, et al. Vitamin D: beyond bone. Ann N Y Acad Sci. 2013;1287(1):45–58.
- Moreno LA, Valtuena J, Perez-Lopez F, et al. Health effects related to low vitamin D concentrations: beyond bone metabolism. Ann Nutr Metab. 2011;59(1):22–27.
- Miller J, Gallo RL. Vitamin D and innate immunity. Dermato Ther. 2010;23(1):13–22.
- Wacker M, Holick MF. Vitamin D – effects on skeletal and extra-skeletal health and the need for supplementation. Nutrients. 2013;5:111–148. doi:10.3390/nu5010111.
- Coussens AK, Naude CE, Goliath R, et al. High-dose vitamin D3 reduces deficiency caused by low UVB exposure and limits HIV-1 replication in urban Southern Africans. Proc Natl Acad Sci U S A. 2015;112(26):8052–8057.
- Jablonski NG, Chaplin G. The evolution of human skin coloration. J Hum Evol. 2000;39(1):57–106.
- Reid IR, Bolland MJ. Role of vitamin D deficiency in cardiovascular disease. Heart. 2012;98(8):609–614.
- Hilger J, Friedel A, Herr R, et al. A systematic review of vitamin D status in populations worldwide. Br J Nutr. 2014;111(1):23–45.
- van Schoor NM, Lips P. Worldwide vitamin D status. Best Pract Res Clin Endocr Metab. 2011;25(4):671–680.
- Martineau AR, Nhamoyebonde S, Oni T, et al. Reciprocal seasonal variation in vitamin D status and tuberculosis notifications in Cape Town, South Africa. Proc Natl Acad Sci U S A. 2011;108(47):19013–19017.
- Poopedi MA, Norris SA, Pettifor JM. Factors influencing the vitamin D status of 10-year-old urban South African children. Public Health Nutr. 2011;14(2):334–339.
- Roberts WE. Skin type classification systems old and new. Dermatol Clin. 2009;27(4):529–533.
- World Health Organization. BMI classification. Available: http://www.euro.who.int/en/health-topics/disease-prevention/nutrition/a-healthy-lifestyle/body-mass-index-bmi Last accessed 25 October 2018.
- Lee RD, Nieman DC. Nutritional Assessment. 3rd ed. New York: McGraw Hill; 2003.
- Holick MF, Binkley NC, Bischoff-Ferrari HA, et al. Evaluation, treatment, and prevention of vitamin D deficiency: an Endocrine Society clinical practice guideline. J Clin Endocrinol Metab. 2011;96(7):1911–1930.
- Institute of Medicine, Food and Nutrition Board. Dietary reference intakes for calcium and vitamin D. Washington (DC): National Academy Press; 2010.
- Cashman KD, Dowling KG, Škrabáková Z, et al. Vitamin D deficiency in Europe: pandemic? Am J Clin Nutr. 2016;103(4):1033–1044.
- Roberg K. No Title. A Surv Vitam D status a North suburbs Pract Johannesburg, South Africa. 2014.
- Lategan R, Van den Berg VL, Walsh CM, et al. Vitamin D status, hypertension and body mass index in an urban black community in Mangaung, South Africa. African J Prim Heal Care Fam Med. 2016;8(1):1–5.
- Klingberg E, Oleröd G, Konar J, et al. Seasonal variations in serum 25-hydroxy vitamin D levels in a Swedish cohort. Endocrine. 2015;49(3):800–808.
- Maeda SS, Saraiva GL, Hayashi LF, et al. Seasonal variation in the serum 25-hydroxyvitamin D levels of young and elderly active and inactive adults in Sao Paulo, Brazil: The Sao PAulo vitamin D Evaluation study (SPADES). Dermatoendocrinol. 2013;5(1):211–217.
- Macdonald HM, Mavroeidi A, Fraser WD, et al. Sunlight and dietary contributions to the seasonal vitamin D status of cohorts of healthy postmenopausal women living at northerly latitudes: a major cause for concern? Osteoporos Int. 2011;22(9):2461–2472.
- Karaguzel G, Dilber B, Can G, et al. Seasonal vitamin D status of healthy schoolchildren and predictors of low vitamin D status. J Pediatr Gastroenterol Nutr. 2014;58(5):654–660.
- Djennane M, Lebbah S, Roux C, et al. Vitamin D status of schoolchildren in Northern Algeria, seasonal variations and determinants of vitamin D deficiency. Osteoporos Int. 2014;25(5):1493–1502.
- Alvares CA, Stape JL, Sentelhas PC, et al. Köppen’s climate classification map for Brazil. Meteorol Zeitschrift. 2014;22(6):711–728.
- Baudoin M-A, Vogel C, Nortje K, et al. Living with drought in South Africa: Lessons learnt from the recent El Niño drought period. Int J Disaster Risk Reduct. 2017;23:128–137.
- Rouault M, Pohl B, Penven P. Coastal oceanic climate change and variability from 1982 to 2009 around South Africa. African J Mar Sci. 2010;32(2):237–246.
- Fitchett JM, Grant B, Hoogendoorn G. Climate change threats to two low-lying South African coastal towns: Risks and perceptions. S Afr J Sci. 2016;112(5-6):1–9.
- Pettifor JM, Moodley GP, Hough FS, et al. The effect of season and latitude on in vitro vitamin D formation by sunlight in South Africa. S Afr Med J. 1996;86(10):1270–1272.
- Garland FC. Do sunlight and vitamin D reduce the likelihood of colon cancer? Int J Epidemiol. 2006;35(2):217–220.
- Grigalavicius M, Moan J, Dahlback A, et al. Daily, seasonal, and latitudinal variations in solar ultraviolet A and B radiation in relation to vitamin D production and risk for skin cancer. Int J Dermatol. 2016;55(1):e23–e28.
- Lucas RM, Ponsonby A-L, Dear K, et al. Vitamin D status: multifactorial contribution of environment, genes and other factors in healthy Australian adults across a latitude gradient. J Steroid Biochem Mol Biol. 2013;136:300–308.
- Hamilton SA, McNeil R, Hollis BW, et al. Profound vitamin D deficiency in a diverse group of women during pregnancy living in a Sun-rich Environment at latitude 32 degrees N. Int J Endocrinol. 2010;2010:917428.
- Lee JE, Li H, Chan AT, et al. Circulating levels of vitamin D and colon and rectal cancer: the Physicians’ health study and a meta-analysis of prospective studies. Cancer Prev Res (Phila). 2011;4(5):735–743.
- Daly RM, Gagnon C, Lu ZX, et al. Prevalence of vitamin D deficiency and its determinants in Australian adults aged 25 years and older: a national, population-based study. Clin Endocrinol (Oxf). 2012;77(1):26–35.
- Luxwolda MF, Kuipers RS, Kema IP, et al. Traditionally living populations in East Africa have a mean serum 25-hydroxyvitamin D concentration of 115 nmol/l. Br J Nutr. 2012;108(9):1557–1561.
- Hovsepian S, Amini M, Aminorroaya A, et al. Prevalence of vitamin D deficiency among adult population of Isfahan City, Iran. J Health Popul Nutr. 2011;29(2):149–155.
- Touvier M, Deschasaux M, Montourcy M, et al. Determinants of vitamin D status in Caucasian adults: influence of sun exposure, dietary intake, sociodemographic, lifestyle, anthropometric, and genetic factors. J Invest Dermatol. 2015;135(2):378–388.
- Verdoia M, Schaffer A, Barbieri L, et al. Impact of gender difference on vitamin D status and its relationship with the extent of coronary artery disease. Nutr Metab Cardiovasc Dis. 2015;25(5):464–470.
- Forrest KYZ, Stuhldreher WL. Prevalence and correlates of vitamin D deficiency in US adults. Nutr Res. 2011;31(1):48–54.
- Rafiq R, van Schoor NM, Sohl E, et al. Associations of vitamin D status and vitamin D-related polymorphisms with sex hormones in older men. J Steroid Biochem Mol Biol. 2016;164:11–17.
- Mahan LK, Raymond JL. Krause’s food & the Nutrition Care Process. St Louis, Mo. Elsevier/Saunders. 14th ed. 2017.
- George JA, Norris SA, van Deventer HE, et al. Effect of adiposity, season, diet and calcium or vitamin D supplementation on the vitamin D status of healthy urban African and Asian-Indian adults. Br J Nutr. 2014;112(4):590–599.
- George JA, Norris SA, van Deventer HE, et al. The association of 25 hydroxyvitamin D and parathyroid hormone with metabolic syndrome in two ethnic groups in South Africa. PLoS One. 2013;8(4):e61282.
- Harinarayan C V, Ramalakshmi T, Prasad U V, et al. High prevalence of low dietary calcium, high phytate consumption, and vitamin D deficiency in healthy south Indians. Am J Clin Nutr. 2007;85(4):1062–1067.
- Barrett JA, Baron JA, Karagas MR, et al. Fracture risk in the U.S. medicare population. J Clin Epidemiol. 1999;52(3):243–249.
- Bohannon AD, Hanlon JT, Landerman R, et al. Association of race and other potential risk factors with nonvertebral fractures in community-dwellin elderly women. Am J Epidemiol. 1999;149:1002–1009.
- Barrett-Connor E, Siris ES, Wehren LE, et al. Osteoporosis and fracture risk in women of different ethnic groups. J Bone Miner Res. 2005;20(2):185–194.
- Cauley JA, Lui LY, Ensrud KE, et al. Bone mineral density and the risk of incident nonspinal fractures in black and white women. JAMA. 2005;293(17):2102–2108.
- Pereira-Santos M, Costa PRF, Assis AMO, et al. Obesity and vitamin D deficiency: a systematic review and meta-analysis. Obes Rev. 2015;16(4):341–349.
- Sohl E, de Jongh RT, Heymans MW, et al. Thresholds for serum 25 (OH) D concentrations with respect to different outcomes. J Clin Endocrinol Metab. 2015;100(6):2480–2488.
- Sanghera DK, Sapkota BR, Aston CE, et al. Vitamin D status, gender differences, and Cardiometabolic health Disparities. Ann Nutr Metab. 2017;70(2):79–87.
- Datta P, Philipsen PA, Olsen P, et al. The half-life of 25 (OH) D after UVB exposure depends on gender and vitamin D receptor polymorphism but mainly on the start level. Photochem Photobiol Sci. 2017;16(6):985–995.
- Kremer R, Campbell PP, Reinhardt T, et al. Vitamin D status and its relationship to body fat, final height and peak bone mass in young women. J Clin Endocrinol Metab. 2009;94(1):67–73.
- Hatun S, Islam O, Cizmecioglu F, et al. Subclinical vitamin D deficiency is increased in adolescent girls who wear concealing clothing. J Nutr. 2005;135:218–222.
- Pettifor JM. Vitamin D deficiency and nutritional rickets in children. In: Feldman DPW, Glorieux FH, editor. Vitamin D. 2nd ed. Boston: Elsevier Academic Press; 2005. p. 1065–1084.
- Lehmann B, Meurer M. Vitamin D metabolism. Dermatol Ther. 2010;23(1):2–12.
- Jolliffe DA, Hanifa Y, Witt KD, et al. Environmental and genetic determinants of vitamin D status among older adults in London, UK. J Steroid Biochem Mol Biol. 2016;164:30–35.