
ABSTRACT
Introduction: Obstructive sleep apnea (OSA) is associated with considerable morbidity and mortality. This study assessed the prevalence of high risk of OSA and investigated which anthropometric measure best predicts the OSA risk among patients attending a family practice clinic in a tertiary hospital.
Methods: We conducted a descriptive cross-sectional study of 362 consecutive patients (64% females; median age of 54 years). OSA risk was assessed by the Berlin Questionnaire and the patients were divided into two groups according to OSA risk: high and low risk. Anthropometric measurements were conducted as stated in the protocol established in the 3rd National Health and Nutrition Examination Survey.
Results: Out of 362 participants, 84 [23.2% (95% CI 19.0%, 28.0%)] had high risk of OSA. Subjects with a high risk of OSA had significantly higher body mass index, waist circumference, hip circumference, and waist-to-height ratio (24.9 vs 23.8, p = 0.002; 89.0 vs 84.0, p < 0.001; 95.0 vs 91.0, p < 0.001; 0.56 vs 0.52, p < 0.001, respectively). Body mass index, waist circumference, hip circumference, and waist-to-height ratio performed similarly in predicting high risk of OSA with Area Under the Curve (AUC) of 0.661, 95% CI (0.592,0.730); 0.659, 95% CI (0.596,0.723); 0.668, 95% CI (0.604,0.733); 0.659 95% CI (0.592,0.725) respectively. The AUCs were similar when the analysis was restricted to those who were overweight.
Conclusion: High risk of OSA is moderately prevalent in this population, with measures of central and abdominal adiposity equally predicting the risk.
1. Introduction
Obstructive sleep apnea (OSA) is a common respiratory disease that is characterized by repetitive collapse of the upper airway leading to a marked reduction or complete cessation of airflow during sleep, causing oxygen desaturation and frequent arousals [Citation1,Citation2].
The presence of OSA is associated with most debilitating medical conditions such as cardiovascular, cerebrovascular, neuro-cognitive, and metabolic diseases that significantly reduce the patients’ quality of life and increase mortality [Citation3].
Despite this huge impact, it is appreciably unrecognized and undiagnosed [Citation4]. Although the definitive diagnosis of OSA is made by polysomnography (PSG), it is widely unavailable and largely unaffordable. Since it is not practicable to subject all patients with risk of OSA to PSG, it is useful to define its determinants.
OSA has many determinants in literature with obesity as the most important [Citation5,Citation6]. The measures of obesity which have been used and shown to better predict OSA include body mass index (BMI), neck circumference (NC), waist circumference (WC), waist–hip ratio (WHR), neck–height ratio, and waist-to-height ratio (WHtR) [Citation7,Citation8]. However, results from studies on the relationship between these different anthropometric measures and OSA differed by age, gender, and ethnicity of the participants, as well as by environmental factors [Citation9]. Moreover, it is also well established that fat distribution rather than total body fat is a major determinant of cardiovascular risk [Citation10,Citation11]. Thus, there is mounting importance of the role of anthropometrics in predicting the risk of OSA. Previous studies in sub-Saharan Africa have focused on the risk of OSA among the general population [Citation12,Citation13], drivers [Citation14], among specific groups of patients with diseases [Citation15–Citation19]. However, no study has specifically examined which anthropometric measures predict the risk of OSA, although these can easily be measured by simple, inexpensive, validated, noninvasive instruments by trained health-care workers in clinical practice. Therefore, our main objective is to describe the prevalence of high-risk OSA and investigate which anthropometric measure predicts OSA risk after adjusting for some clinical factors.
2. Methods
2.1. Design and sample size calculation
This cross-sectional study was conducted at the family practice clinic of Obafemi Awolowo University Teaching Hospitals Complex, Ile-Ife, South-west Nigeria. The study population was patients over 18 years attending the clinic. A sample size of 354 was calculated using an appropriate statistical formula for estimating the minimum sample size in descriptive health studies [n = Z2p(1-p)/d2*Deff] [Citation20]. Where n is the required sample size, Z is the confidence level at 95% (standard value of 1.96), p is the estimated prevalence of OSA, which is 19% [Citation13] from previous study, d is the margin of error at 5% and Deff is the design effect of 1.5, which is a “correction factor” to account for non-probability sampling technique.
2.2. Participants
All consenting patients who came for follow-up-visit for medical ailments between August 2012 and November 2012 were consecutively recruited.
Demographic and clinical information obtained from the patients and their case records. The information collected included age, gender, tentative or final diagnosis, and, in particular, the presence of diabetes mellitus, and hypertension as well as current cigarette smoking and alcohol use. All questionnaires were interviewer-administered.
Excluded patients were those on sedative or anxiolytic drugs and those who had obvious craniofacial abnormalities. All participants gave verbal informed consent and permission to conduct the study was obtained from the Head of general outpatient clinic. All the completed questionnaires were anonymous, and no personal identifiers were collected.
2.3. Anthropometric measurements
Body height was measured with the subjects standing barefooted on a wall-mounted stadiometer and recorded to the nearest 0.5 cm. Body weight was measured to the nearest 0.1 kg with the participant wearing minimal clothing and from these measurements, BMI was calculated (weight/height 2, kg/m 2) [Citation21]. Waist and hip circumferences were measured with the participants in a standing position. Neck circumference (cm) was measured and recorded to the nearest 0.1 cm with the subject in the standing position at the level of the cricothyroid cartilage, inferior to the laryngeal prominence and perpendicular to the long axis of the neck, with the head in the Frankfurt horizontal plane. The measurement of the waist, hip, and neck circumference was obtained using a non-elastic tape; measurements were obtained in duplicate and then averaged using the protocol established in the 3rd National Health and Nutrition Examination Survey [Citation22]
All the measurements were taken by trained research staff and regularly supervised by the lead investigator to ensure quality control and adherence to the standardized protocols.
2.4. Assessment of OSA risk
The risk of OSA was evaluated using the Berlin Questionnaire. The Berlin Questionnaire has been validated and used expansively in clinical and epidemiologic research internationally and there is moderate to high consistency between results of the Berlin Questionnaire and parameters of polysomnography [Citation23]. It comprises 10 items structured in 3 categories. The first category assesses snoring and witnessed apnea (questions 1 to 5), the second category assesses daytime sleepiness (questions 6 to 9), while the third category evaluates the presence of either hypertension or a BMI ≥ 30 kg/m2. Inside each item, some “positive” answers are defined and these are assigned 1 point. The only item that is an exception is question 5, which receives 2 points for a positive answer. In category three, the answers that confirm the presence of hypertension or obesity are considered positive and also transform this category into a positive one. The risk for OSA is high if two or more categories are positive, and the risk is low if less than two categories are positive. The sensitivity of the Berlin Questionnaire ranges from 54% to 86% and the specificity from 43% to 87% [Citation24]
2.5. Statistical analysis
Statistical analysis was performed with IBM-SPSS software version 20 (IBM, Armonk, NY, USA). Categorical variables were described as numbers and proportions. The anthropometric measurements were not normally distributed and so, were expressed as median values with interquartile ranges (IQR). Normality was tested with Shapiro–Wilk test. Differences between the high risk and the low-risk group were tested with the Chi-square test or the Fisher exact test for categorical variables, and with unpaired Wilcoxon rank-sum test (Mann–Whitney U test) for the anthropometric variables. Further analyses were performed on the anthropometric variables that were found to be significantly different between the high risk and the low risk for OSA. To explore the association between OSA risk and various anthropometric measures, unconditional logistic regression analysis was performed using OSA risk as the dependent factor and age, gender, hypertension, and one anthropometric variable (BMI, HP, WC, or WHtR) at a time as independent covariates. For comparison of the indices, the regression-fitted values were used to plot receiver-operating characteristic (ROC) curves with sensitivity plotted on the y-axis against (1–specificity) on the x-axis, and comparing the area under the curve (AUC). The larger the AUC the more accurate the test; A p-value of <0.05 was considered significant and all the tests were two-tailed.
3. Results
Out of 362 participants, 84 were classified as having high-risk OSA giving a prevalence rate of 23% (95% CI 19%-28%)
shows the demographics, clinical and anthropometric characteristics of the participants. The median age (IQR) of the participants was 54.0 (44.0–65.0) years, there were more female (233/362; 64.4%) than male participants. About a quarter of them were hypertensive, eight (2.2%) were currently smoking, and twenty-two (6.1%) were taking alcohol.
Table 1. Demographics, anthropometrics, and clinical characteristics of the participants
Among the anthropometrics, the median BMI, median waist circumference, median hip circumference, and median waist/height ratio were significantly higher in the high risk of OSA group compared with the low-risk group. (24.9 vs. 23.8, p ≤ 0.002; 89.0 vs. 84.0, p < 0.001; 95.0 vs. 91.0, p < 0.001; 0.56 vs. 0.52, p < 0.001, respectively) There were no statistically significant differences in the risk of OSA between current smokers and nonsmokers, as well as those taking alcohol and those not taking.
After adjustment for age, sex, alcohol consumption, hypertension, and diabetes mellitus, logistic regression analysis indicated that BMI [OR 1.144; 95% CI (1.074–1.219) p < 0.001], WC [OR 1.046; 95% CI (1.021–1.071) p < 0.001], HC [OR 1.053; 95% CI (1.028–1.079) p < 0.001] and WHtR [OR 1.068; 95% CI (1.031–1.106) p < 0.001] were independently associated with higher odds of high risk for OSA, when they were used separately in the regression model, as shown in .
Table 2. Adjusted odds ratio for high risk of OSA
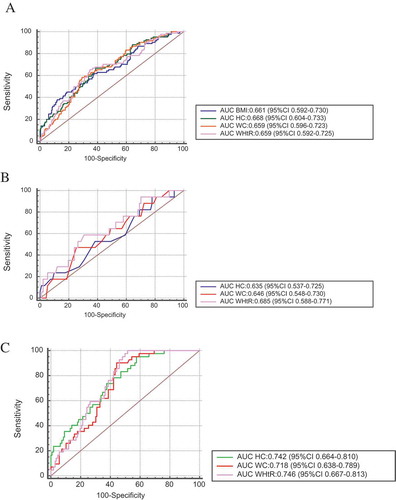
Using ROC curves ()) with AUC and 95% confidence intervals of the assessed anthropometric parameters such as BMI, WC, HC, and WHtR, prediction of high risk for OSA by the anthropometric measures was generally fair with HC predicting high risk for OSA most accurately (AUC of 0.668, 95% CI 0.604,0.733), followed by BMI (0.66I 95% CI 0.592,0.730), WC (0.659 95% CI 0.596,0.723) and WHtR (0.659 95% CI 0.592,0.725) (). However, there were no significant differences between the AUC areas among the anthropometric indices (). Restricting our analysis to those participants with BMI between 25 to 29.9 kg/m2, we got similar AUC ()); however, the AUC for participants with BMI≥25 was higher compared to the whole participants ()).
Table 3. The values of AUC and 95% CI of evaluated parameters for all participants
Table 4. Pairwise comparison of ROC curves for all the participants
Figure 1. ROC curves of anthropometric indicators for high risk of OSA. (a) For all the study participants (n = 362), (b) For BMI 25–29.9 only (n = 108), (c) For BMI ≥ 25 (n = 148), AUC: area under the curve, BMI: body mass index, WC: waist circumference, HC: hip circumference, WHtR: waist-to-height ratio
4. Discussion
The human, economic, and health burden associated with OSA is substantial. In this study, we found that the prevalence of high risk of OSA was modest and that measures of central obesity like waist circumference, hip circumference, and waist–height ratio were equally effective in predicting the risk of OSA when compared to BMI among the study population. Our prevalence of high risk of OSA among general outpatients was in consonance with several published articles [Citation12,Citation13,Citation18,Citation19] thus buttressing the fact that OSA is common, under-diagnosed, and requires regular screening.
Clinical predictors of high risk for OSA have been reported, including male gender, older age, alcohol consumption, and cigarette smoking [Citation25]. Our study showed that hypertension was the only significant clinical parameter in this cross-sectional study. We probably did not find any difference in other clinical parameters because of the small number of smokers, alcoholics, and Diabetes Mellitus patients that were seen in the general outpatient clinic during the study period and this may reduce the statistical power to detect a difference.
One unique aspect of our work was the assessment of several representative metrics of central obesity in estimating the risk of OSA. In this study, BMI, waist, and hip circumference with adjusted waist-to-height ratio were found to be significantly different between those who were at high risk of OSA compared to those who were not. The mechanisms by which general or central obesity contribute to OSA is not clear [Citation26]. However, there are many proposed factors, which are, airway compression from fatty distribution in the airway or peripharyngeal area of the neck; decreased upper airway muscle protective force due to fatty tissue deposits and abdominal fat causing cranial displacement of the diaphragm decreasing longitudinal tracheal traction on the upper airway, leading to increased tendency of upper airway collapse. Other factors include lower arousal threshold, ventilatory control instability with reduced lung volume tethering [Citation27]. It may also be related to leptin, ghrelin, and orexin and other hormone levels secreted by the fat cells [Citation28].
Although BMI is frequently used to determine general obesity, it does not provide accurate information on body fat distribution. Also, studies have shown that central obesity is more strongly associated with several cardiovascular, metabolic, and all-cause mortality than peripheral obesity. New indicators that have been proposed to evaluate central obesity include WC, WHtR, HC, and NC. Our study showed that WC, HC, and WHtR equally predict OSA by evaluating AUC using the ROC analysis, this agrees with the study of Niţă and colleague which showed that WHtR was the best predictor for high risk of OSA, in their study of 254 patients, as compared to other parameters of anthropometrics [Citation29]. However, the reported AUC of 0.760 in their study may not be significantly different from the AUC of 0.747 and 0.738 reported for BMI and WC, respectively, as they did not document whether these AUCs were statistically different or not. Nevertheless, a metanalysis that involved 31 studies with over 300,000 participants recommended WHtR as the best screening tool over BMI and WC for general cardiovascular outcomes [Citation30]. Other studies have shown an association of these anthropometrics with polysomnography-based OSA diagnosis in adults and children. After adjusting for age, sex, alcohol consumption, and smoking, Hang et al. reported that waist circumference (OR, 1.114; p < 0.001) and body mass index (OR, 1.364; p < 0.001) were associated with OSA [Citation1]. de Sousa Caixêta and colleagues also demonstrated WHtR was able to differentiate OSA from primary snoring in obese children [Citation31].
Surprisingly, we did not find any difference in neck circumference and waist–hip ratio as measures of central obesity between those who had high risk of OSA and those who did not; the probable reason is not apparent from our study. It may arise from different populations studied and also neck circumference may not, in certain cases adequately correlate with pharyngeal fat deposition because of anatomical variations in the sizes of neck structures [Citation32]. Additionally, it has also been proposed that waist–hip ratio may not mirror the actual body fat distribution of weight and also that the value of this ratio may not incorporate or take account of large waist circumference [Citation29].
Another strength of our study is that in exploring the association between risk of OSA and anthropometrics, it adjusted for the common clinical predictors of OSA such as excessive day sleepiness, hypertension, smoking, and alcohol use. This further strengthens the use of these anthropometrics as predictors of high risk of OSA.
Our findings should be interpreted with caution, in light of some limitations. First, this study relied exclusively on the use of a screening questionnaire to determine the risk of OSA. OSA screening questionnaires tend to have high sensitivity but poor specificity thereby increasing the number of false-positive results. Furthermore, questionnaires can be susceptible to bias and snoring is not amenable to self-report, as OSA symptoms occur during sleep. Therefore, screening questionnaires alone are inadequate for confirming a diagnosis. Future research should reevaluate this relationship using home sleep apnea testing devices especially in those with high pretest probability. Second, the anthropometric measurement of fat distribution was indirect; however, more refined methods such as computed tomography (CT), magnetic resonance imaging (MRI), and Dual-energy X-ray absorptiometry (DEXA), for determination of fat mass distribution to detect an OSA risk, may not be practicable for studies in clinical settings due to their training expertise, higher costs, and radiation exposure [Citation33]. Third, this study was conducted among patients presenting in the general outpatient clinic of a tertiary hospital, hence our findings may not be generalizable to the general population. However, it is a nonspecialist clinic and patients are usually heterogeneous consisting of all strata of the community.
5. Conclusion
In conclusion, given the considerable importance of OSA as a reason for all-cause mortality and its associated multiple morbidity, this study has shown that indirect measures of central obesity and fat distribution, namely waist circumference, hip circumference, and waist-to-height ratio are easily performed screening tool that can be used, in busy clinical practices to determine high risk of OSA in adults. In addition, they are of equal performance when compared to BMI which is a commonly used predictor in clinical prediction questionnaires.
Acknowledgments
We thank all the patients in this study for their participation and time.
Disclosure statement
No potential conflict of interest was reported by the authors.
Additional information
Funding
Notes on contributors
Olayemi Fehintola Awopeju
Olayemi Fehintola Awopeju is a senior lecturer and a consultant chest physician.
Michael Bimbo Fawale
Michael Bimbo Fawale is a senior lecturer and a consultant neurologist.
Samuel Anu Olowookere
Samuel Anu Olowookere is a senior lecturer and a consultant family physician.
Oluwasina Titus Salami
Oluwasina Titus Salami is a medical officer in family practice clinic.
Olufemi Olanisun Adewole
Olufemi Olanisun Adewole is a professor of medicine and a consultant chest physician.
Gregory Efosa Erhabor
Gregory Efosa Erhabor is a professor of medicine and a consultant chest physician.
References
- Kang HH, Kang JY, Ha JH, et al. The associations between anthropometric indices and obstructive sleep apnea in a Korean population. PLoS One. 2014;9(12):e114463.
- Kim J, Yoon DW, Lee SK, et al. Concurrent presence of inflammation and obstructive sleep apnea exacerbates the risk of metabolic syndrome: a KoGES 6-year follow-up study. Medicine (Baltimore). 2017;96(7):e4488.
- Suárez M, Osorio J, Torres M, et al. Should the diagnosis and management of OSA move into general practice? Breathe (Sheff). 2016;12(3):243–247.
- Saleh AB, Ahmad MA, Awadalla NJ. Development of Arabic version of Berlin questionnaire to identify obstructive sleep apnea at risk patients. Ann Thorac Med. 2011;6(4):212–216.
- Seidell JC. Waist circumference and waist/hip ratio in relation to all-cause mortality, cancer and sleep apnea. Eur J Clin Nutr. 2010;64(1):35–41.
- Martins AB, Tufik S, Moura SM. Physiopathology of obstructive sleep apnea-hypopnea syndrome. J Bras Pneumol. 2007;33(1):93–100.
- Magalhães EI, Sant’Ana LF, Priore SE, et al. Waist circumference, waist/height ratio, and neck circumference as parameters of central obesity assessment in children. Rev Paul Pediatr. 2014;32(3):273–281.
- Cho JH, Choi JH, Suh JD, et al. Comparison of anthropometric data between Asian and Caucasian patients with obstructive sleep apnea: a meta-analysis. Clin Exp Otorhinolaryngol. 2016;9(1):1–7.
- Mabchour AEL, Delisle H, Vilgrain C, et al. Specific cut-off points for waist circumference and waist-to-height ratio as predictors of cardiometabolic risk in Black subjects: a cross-sectional study in Benin and Haiti. Diabetes Metab Syndr Obes. 2015;8:513–523.
- Okorodudu DO, Jumean MF, Montori VM, et al. Diagnostic performance of body mass index to identify obesity as defined by body adiposity: a systematic review and meta-analysis. Int J Obes. 2010;34(5):791–799.
- Ledoux S, Coupaye M, Essig M, et al. Traditional anthropometric parameters still predict metabolic disorders in women with severe obesity. Obesity. 2010;18(5):1026–1032.
- Akintunde AA, Salawu AA, Opadijo OG. Assessment of Snoring and obstructive sleep apnoea in a Nigerian university: association with cardiovascular risk factors. Niger Med J. 2014;55(6):469–473.
- Adewole OO, Hakeem A, Fola A, et al. Obstructive sleep apnea among adults in Nigeria. J Natl Med Assoc. 2009;101(7):720–725.
- Ozoh OB, Okubadejo NU, Akanbi MO, et al. High-risk of obstructive sleep apnea and excessive daytime sleepiness among commercial intra-city drivers in Lagos metropolis. Niger Med J. 2013;54(4):224–229.
- Obaseki DO, Kolawole BA, Gomerep SS, et al. Prevalence and predictors of obstructive sleep apnea syndrome in a sample of patients with type 2 diabetes mellitus in Nigeria. Niger Med J. 2014;55(1):24–28.
- Desalu O, Onyedum C, Sanya E, et al. Prevalence, awareness and reporting of symptoms of obstructive sleep apnoea among hospitalized adult patients in Nigeria: a multicentre study. Ethiop J Health Sci. 2016;26(4):321–330.
- Akintunde AA. Snoring and risk for obstructive sleep apnea among Nigerians with heart failure: prevalence and clinical correlates. Heart Views. 2013;14(1):17–21.
- Sogebi OA, Ogunwale A. Risk factors of obstructive sleep apnea among Nigerian outpatients. Braz J Otorhinolaryngol. 2012;78(6):27–33.
- Fawale MB, Ibigbami O, Ismail I, et al. Risk of obstructive sleep apnea, excessive daytime sleepiness and depressive symptoms in a Nigerian elderly population. Sleep Sci. 2016;9(2):106–111.
- Kish L. Survey sampling. New York, London: John Wiley & Sons; 1965.
- Nuttall FQ. Body mass index obesity, BMI, and health: a critical review. Nutr Today. 2015;50(3):117–128.
- National Health and Nutrition Examination Survey. Anthropometry procedures manual. cited [2018 Jul 18]. Available from: http://www.cdc.gov/nchs/data/nhanes/nhanes_07_08/manual_an.pdf.
- Wosu AC, Vélez JC, Barbosa C, et al. the relationship between high risk for obstructive sleep apnea and general and central obesity: findings from a sample of chilean college students. ISRN Obes. 2014;871681. DOI:10.1155/2014/871681.
- Netzer NC, Stoohs RA, Netzer CM, et al. Using the Berlin questionnaire to identify patients at risk for the sleep apnea syndrome. Ann Intern Med. 1999;131(7):485–491.
- Chen X, Pensuksan W, Lohsoonthorn V, et al. Obstructive sleep apnea and multiple anthropometric indices of general obesity and abdominal obesity among young adults. Int J Soc Sci Stud. 2014;2(3):89–99.
- Sperry SD, Scully ID, Granzow RH, et al. Sleep duration and waist circumference in adults: a meta-analysis. Sleep. 2015;38(8):1269–1276.
- Sharma SK, Katoch VM, Mohan A, et al. for Indian initiative on obstructive sleep apnoea (INOSA) Guidelines working group. Consensus & evidence-based INOSA guidelines 2014 (First edition). Indian J Med Res. 2014;140(3):451–468.
- Pillar G, Shehadeh N. Abdominal fat and sleep apnea: the chicken or the egg? Diabetes Care. 2008;31(Suppl 2):S303–S309.
- Niţă O, Graur LI, Popescu DS, et al. Anthropometric predictors of high risk of obstructive sleep apnea syndrome in a rural population. Rom J Diabetes Nutr Metab Dis. 2012;19(1):07–16.
- Ashwell M1, Gunn P, Gibson S. Waist-to-height ratio is a better screening tool than waist circumference and BMI for adult cardiometabolic risk factors: systematic review and meta-analysis. Obes Rev. 2012;13(3):275–286.
- de Sousa Caixêta JA, Saramago AM, de Cácia Pradella-hallinan ML, et al. Waist-to-height ratio distinguish obstructive sleep apnea from primary snoring in obese children. Sleep Breath. 2015;19(1):231–237.
- Schäfer H, Pauleit D, Sudhop T, et al. Body fat distribution, serum leptin, and cardiovascular risk factors in men with obstructive sleep apnea. Chest. 2002;122(3):829–839.
- Simpson L, Mukherjee S, Cooper MN, et al. Sex differences in the association of regional fat distribution with the severity of obstructive sleep apnea. Sleep. 2010;33(4):467–474.