
 ?Mathematical formulae have been encoded as MathML and are displayed in this HTML version using MathJax in order to improve their display. Uncheck the box to turn MathJax off. This feature requires Javascript. Click on a formula to zoom.
ABSTRACT
Background: Since identification of the first case on Feb. 14, Egypt had implemented several control measures. This research aimed at study the time trend of the transmissibility and mortality of COVID 19 in Egypt.
Methods: Published data on daily reported cases and deaths since the start of the epidemic till week 19 were used. We estimated the basic reproductive number (R0) during the early phase of the epidemic using the simple exponential growth method (SEG) and time dependent method (TD). Then we estimated time varying effective reproductive number (Re) after implementation of the control measures by applying the TD method. Moreover, the trend in the Case Fatality Rate (CFR) throughout the study period was studied.
Results: With SEG method, R0 was found to be 2.26 (2.15–2.38) and 2.58 (2.43–2.72) for infectious period of 8 and 10 days, respectively. While by the TD method, R0 was estimated to be 2.34 (95% CrI: 2.05–2.64) and 3.01 (95% CrI: 2.64–3.40) for mean ± SD of SI equals 5.8 ± 2.6 and 7.5 ± 3.4, respectively. With TD method, Re decreased from the initial value of R0 to reach 1.30 (95% crI: 1.17–1.45) in week 7. After that Re values fluctuated closely around 1. CFR reached its peak (7.7%) on April 12 then it decreased to its lowest value (3.4%) after two months before increasing slightly again to (4.1%) in the last days.
Conclusion and recommendation: The initial Basic reproductive number was high in Egypt. Effective reproductive number dropped after control measures till fluctuating around one. CFR also declined over time but slight increase in the last days was observed. After relaxation of the control measures, we recommend the instantaneous monitoring of the transmissibility and mortality in Egypt.
1. Background
In early December 2019, the outbreak of coronavirus disease 2019 (COVID-19) was firstly recognized as a cluster of pneumonia cases of unknown cause in Wuhan, China [Citation1]. The virus later was isolated and named, Severe Acute Respiratory Syndrome Corona Virus 2 (SARS-CoV2) [Citation2]. Then the virus rapidly spread all over the world and by March 11th, 2020 the World Health Organization (WHO) has declared the emerging outbreak as Pandemic [Citation3].
Figure 1. Daily cumulative number of COVID 19 cases in Egypt
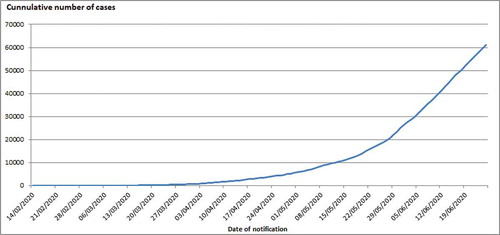
On February 14, Egypt reported its first confirmed case of COVID-19. Since identification of the first case, Egypt had implemented several control measures including isolating the reported cases, and testing and tracing the close contacts. Since March 15, Egypt had applied additional Public Health and social measures (PHSMs) in order to contain the spread of SARS-CoV2 comprising mainly: closure of schools, universities, governmental offices and some businesses, international air flight ban and partial curfew, . The first measure i.e schools and Universities closure was implemented when the number of cumulative cases reached over one hundred (N = 126). Subsequently, the two hard measures – international air flight ban and partial curfew- were taken upon around every doubling of the number of cumulative cases (256 and 456 cases on March 19 and 25, respectively). In spite of these early control measures, community transmission remains a challenge as demonstrated by the apparent increase in numbers of the reported cases and deaths following a period of slowdown Figures (Citation1 and Citation4). Later, wearing face masks became obligatory since May 30. Home isolation strategy for mild cases was implemented since 21 May.
Table 1. Public health and social measures (PHSMs) implemented in Egypt at early phase of COVID 19 epidemic
Recently, air traffic has been opened and high school exams started. Furthermore, Egypt braces for reopening of mosques, restaurants and places of worship, and lift curfew from June 27. The purpose of this research was to study the time trend in transmissibility and mortality of COVID 19 epidemic in Egypt.
2. Methods
2.1. Data collection plan
The data of COVID‐19 in this study were obtained from the national published daily reports on new and cumulative number of cases and deaths in Egypt from the beginning of the epidemic till the end of week 19.
We divided the data set into three parts; the first one starts from the beginning of the epidemic (on 14/2/2020) to four days (on 19/3/2020) after implementation of the first PHSM i.e. schools and Universities closure. This period was represented the date from day 1 to day 35 (throughout the first five weeks of the epidemic). We selected this transition point of four days based on an estimate of median incubation period for the COVID-19 [Citation4]. The second data part was corresponded to the transition period in which several PHSMs were implemented. It starts from five days after the first PHSM (on 20/3/2020) till 14 days after the implementation of the last measure i.e. partial curfew. This period lasts from week 6 through week 8. The last data portion is the data which is collected during the period of more than 14 days (starting on 9/4/2020 and onwards) after implementing the last measure. We would expect that the effects of the control measures will be appearing 2 weeks later [Citation5].
2.2. Estimation of basic reproductive number (R0) at the beginning of the epidemic
2.2.1. Calculation of doubling time and R0 using the simple exponential growth method
During the early phase of the epidemics, calculation of doubling time and R0 could be obtained from the growth rate of the cases. The assumption of this method is that at the beginning of the epidemic, and before implementation of any PHSMs, the cumulative number of the cases grows at an exponential rate. During this exponential phase of the epidemic, doubling time can be estimated based on the exponential growth rate and furthermore R0 is computed as a function of the growth rate and the duration of the infectivity period [Citation6,Citation7].
So, this approach involves the following steps: firstly fit the exponential curve for different data subsets, then estimate the growth rate, and finally estimate the doubling time of the infection and R0.
a- Fit the exponential curve for different data subsets
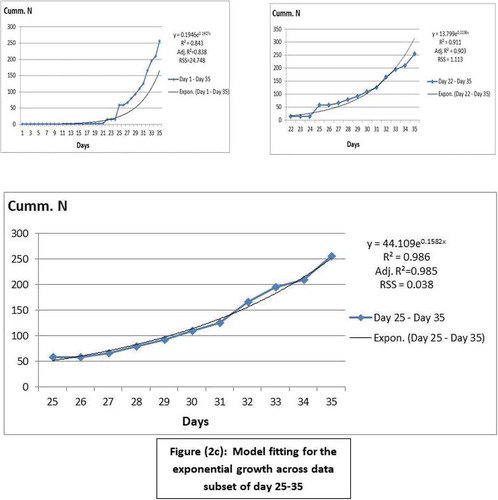
The first part of data (from day 1 to day 35) was examined to identify the subset that represents the best fit for the exponential growth. Values of R2, adjusted R2 and residual sum of squares (RSS) have been estimated using (IBM SPSS statistics for windows version 22, 2013, Armonk, NY, USA. IBM Corp.) to evaluate the model fit for each subset. Three data subsets were examined; data subset of day 1–35, day 22–35, and day 25–35. , b, and c, respectively). The cumulative number of the data subset of day 25–35 (from 9/3/2020 to 19/3/2020) was the closest to the exponential growth as it had the highest values of R2 and adjusted R2, and had the lowest RSS value, ). So, it was used for estimation of the growth rate, and subsequently the doubling time and R0.
Figure 2. Model fitting for the exponential growth across data subsets
b- Calculation of the epidemic doubling time (DT):
DT was calculated using the following equation [Citation6]
As In(2) is the natural logarithm of the number two which equals 0.693 and λ represents the exponential growth rate (GR). In the simple exponential equation, , λ is the slope of the exponential curve [Citation8]. Upper and lower limits of the slope, i.e. GR, estimated using (GraphPad Prism 6, 2012) were applied to calculate the 95% confidence interval (95% CI) of the DT.
c- Calculation of R0:
R0 value has been calculated using the formula below [Citation7,Citation8]
As λ is the GR as mentioned before and D is the mean infectious duration. The infectious period of COVID 19 was assumed to be 8 or 10 days as suggested by [Citation9,Citation10]. Moreover, the 95% CI of the GR was applied to equation (2) to suggest an upper and a lower limit of R0 for the two selected infectivity periods.
2.2.2. R0 estimation using the time-dependent (TD) method
As a comparison method, during the exponential phase of the epidemic, we estimated R0 using another method, namely time-dependent (TD) method. The reproductive number derived from this method is called instantaneous reproductive number. The initial instantaneous reproductive number can be considered as the basic reproductive number as suggested by Zhuang et al., [Citation11]. The TD method employs a Bayesian statistical framework in which real-time reproduction number is calculated by averaging overall transmission networks that are compatible with the observed epidemic curve [Citation12]. We estimated R0 value for day 35 assuming a window period of 11 days starting from day 25. With this method, the Serial Interval (SI) is required. The SI is measured by the time interval between onset of primary and secondary cases. We assumed that the mean SI for COVID 19 was 5.8 days and its standard deviation (SD) was 2.6 days as suggested in previous researches [Citation9, Citation13, Citation14]. Another value of SI (mean ±SD = 7.5 ± 3.4 days) was used in the estimation of R0 as provided by another research [Citation15].
2.3. Estimation of the time-varying effective Reproductive number Re(t)
During the transition period and the period of more than 14 days following the implementation of last PHSM, Re(t) was estimated using the TD method based on the two assumptions for mean ± SD of SI as applied in the estimation of R0 [Citation9,Citation13,Citation14,& Citation15]. We calculated the instantaneous Re(t) on daily basis assuming a window period of 7 days to eliminate statistical noise and provide smoothing of the Re values [Citation12]. A Microsoft Excel spreadsheet (available online at http://tools.epidemiology.net/EpiEstim.xls) was applied to estimate R0 and Re(t) using the TD method mentioned above [Citation12]. R Values were presented as median and 95% credible interval (95% CrI).
2.4. Estimation of Case Fatality Rate
Case fatality rate (CFR %) was estimated as a ratio of daily cumulative deaths to daily cumulative cases. Three-days moving average was added in order to demonstrate the trend of CFR line curve.
3. Results
3.1. Transmissibility
3.1.1. The initial GR, DT and R0
By using the simple exponential growth method, for the period from day 25 to day 35, the initial GR was estimated to be 0.158 per day (95% CI: 0.143–0.172). Accordingly, the initial doubling time of the epidemic was 4.39 days (95% CI: 4.02–4.84). After applying equation [Citation2], our estimation of R0 was found to be 2.26 (2.15–2.38) and 2.58 (2.43–2.72) for infectious period of 8 and 10 days, respectively. While by the TD method, R0 was estimated to be 2.34 (95% CrI: 2.05–2.64) and 3.01 (95% CrI: 2.64–3.40) for mean ± SD of SI equals 5.8 ± 2.6 and 7.5 ± 3.4, respectively, .
Table 2. R0 in the early phase of COVID 19 epidemic in Egypt by the two methods of estimation
3.1.2. Effective Reproductive number
During the transition period and period of two weeks after implementation of last PHSM, although demonstrates the trend in Re values over time using the two assumptions of SI, we will explore the results of Re by applying 5.8 ± 2.6 as mean ± SD value for SI.
Figure 3. Daily number of new confirmed COVID 19 cases and Daily Re (t) in Egypt. In method 1 and 2, two values of mean ± SD for SI were assumed (5.8 ± 2.6 and 7.5 ± 3.4, respectively)
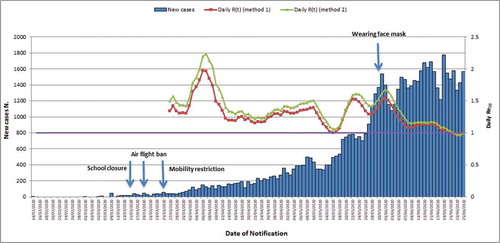
3.1.3. During the transition period (from week 6-8)
We decided to initiate Re estimation on the first day of week 7 in order to eliminate the possible overlapping of Re values with the value of R0. Therefore, we found that Re value decreased from the initial median R0 value to an estimate of 1.34 (95% crI: 1.16–1.53) which represent 42.7% reduction when compared to the pre-intervention R0 value. Then the value declined to reach 1.30 (95% crI: 1.17–1.45) close to the end of the same week (2/4/2020), but near the end of the transition period (after the middle of week 8), it increased again to reach 1.97 (95% crI: 1.83–2.11). This increase corresponds with increase occurrence of cases (149 new reported cases on 6/4), .
3.1.4. Two weeks after implementation of last PHSM measure (week 9 and onwards)
During this stage, the Re decreased again to 1.15 (95% crI: 1.09–1.22) one day before the end of week 10. Then, the estimate increased steadily to 1.39 (95% crI: 1.34–1.44) near the middle of week 13. At the beginning of week 14, it declined again to reach 1.00 (95% crI: 0.96–1.03). Re Estimates after that peaked at 1.53 (95% crI: 1.49–1.58) and 1.54 (95% crI: 1.51–1.58) in the beginning of week 15 and in the middle of week 16, respectively. These 2 peaks coincide with the increase reporting of cases (783 and 1536 new cases on 22/5 and 31/5, respectively). Then estimates decreased again with Re values fluctuating closely around 1, .
3.2. Mortality
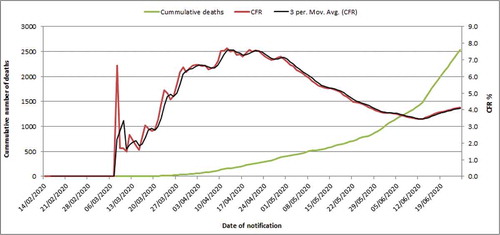
CFR reached its peak (7.7%) on 12/4/2020 then it decreased to its lowest value (3.4%) after two months on 12/6/2020 before increasing slightly again to (4.1%) in the last days, .
Figure 4. Daily cumulative deaths and case fatality rate of COVID 19 in Egypt
4. Discussion
Basic reproductive number (R0) is important for deciding the PHSMs to control over the epidemic providing the public health authorities with information about timing and severity of the epidemic [Citation16]. The R0 is the expected number of secondary cases from a primary case assuming a population where everyone is susceptible. During ongoing epidemic, and after implementation of control measures the estimation of instantaneous effective Reproductive number Re(t) is more appropriate to monitor the transmissibility of the epidemic [Citation13]. Monitoring mortality during epidemic is important to provide proper care to patients. It is considered as an indicator of the quality of clinical care and the treatment protocol applied. Also, some authors suggest the importance of monitoring the impact of COVID 19 spread on communities through CFR [Citation17]. The current study appears to be the first study to investigate the time trend in the transmissibility and mortality of COVID 19 epidemic in Egypt. The key strength of this study is that it provided an estimation of R values in a simple way and easy to apply by field epidemiologists and public health practitioners as we avoided the most complicated theoretical models for calculating R values. Therefore, we hope this article encourage them to use their own surveillance data in estimating R values in order to monitor the epidemic transmission through its course.
This study has three major limitations. First, the count of cases may not reflect the actual epidemic size. But it is necessary to point out that the TD method can deal with under-reporting. Core et al., [Citation12] stated that R estimates from the reported cases only are closely similar to those obtained from all cases and under-reporting does not seem to affect the median estimates of R but it may affect the precision of those estimates leading to wider credible intervals. Moreover, in our estimation of R values we have depended on the date of notification instead of the date of onset as it is difficult to be obtained. In the same way, Yuan et al [Citation13] used date of notification in calculating R(t) by using TD method in order to monitor the transmissibility of COVID 19 in some European countries. Furthermore, the TD method for estimation of R values depends mainly on serial interval. The estimated R may be lower if the assumed serial interval is shorter. However, reports from China stated that persons with COVID 19 can be infectious for a long duration and a mean serial interval shorter than 6 days is unlikely especially during the early phase of the epidemic [Citation9].
At the beginning of the epidemic, our R0 estimates from the two methods were comparable; the difference could be due to the difference in the method of calculation. Our estimation of R0 was generally above 2 which reflect the high transmissibility of the epidemic during its early phase and support the governmental decision for the implemented control measures.
Our estimation of R0 was comparable with another estimate for R0 in Egypt, as Zhao et al. [Citation18] reported R0 value of 2.29 by using Susceptible-Exposed-infectious-Removed (SEIR) model. Also, in the same study R0 from other African countries namely South Africa, Algeria, Nigeria, Senegal and Kenya was more than 2. R0 of COVID-19 has been initially estimated to range between 1.4 and 2.5 as reported by WHO [Citation19]. As well, the reported value of R0 across several countries ranges from 1.4 to 6.5 as reviewed by Liu et al., [Citation20]. On the other hand, our R0 was lower than in Yuan et al., [Citation13] as they reported that the R value, estimated by TD method, for March 9 ranged from 3.10 (95% CI 2.21–4.11) for Italy to 6.56 (95% CI 2.04–12.26) for France. Likewise, Mean R0 for 27 European countries was 4.62 ± 1.32 as estimated by Linka et al., [Citation21]. We consider our results may slightly underestimate the actual R0 values due to under-reporting.
The decreasing trend in Re may reflect the decrease in the transmissibility of COVID 19 in Egypt after control measures. The sudden decline of Re to one at the beginning of week 14 might be due to strict case definition applied by the government leading to under reporting of cases as well as rigid national diagnostic and treatment protocol. Nevertheless, the trend included 2 peaks in week 15 and 16. This increase in Re suggests increasing transmissibility which in turn denotes real increase in new cases. This might be attributed to loose measures applied in Ramadan together with usual crowding during Ramadan however, this is followed by strict quarantine measures during feast. Although, Re value was fluctuating closely around 1 in the last days we suggest that it should be continuously sustained below one all over the country areas for a long period before starting any relaxation in the control measures. In China, Zhao and Chen [Citation22] reported that after January 30, all regions had R value < 1, indicating that the control measures were effective in preventing the spread of the epidemic. On the other hand, in South Korea after control measures R(e) value was below 1 for the whole country but after repeating the analysis at the subnational level it still above one in all country areas except two places [Citation23]. This findings implicate the importance of monitoring the change in R(e) at subnational level.
The current study revealed that CFR reached its peak (7.7%) on mid-April this increase may be related to increasing in case incidence in the preceding week. Then the CFR decreased to its lowest value (3.4%) after two months before increasing slightly again to (4.1%) in the last days. CFRs may differ significantly over time and between countries. The difference in CFR can be attributed to the variation in the testing capacity, and the difference in the underlying age structure and distribution of comorbidities amongst different populaces [Citation17]. CFR ranges from 0.4% in whole China and 3.6% in Hubei Province to 31.4% in the northwest region of Italy [Citation24]. The policy of herd’s immunity to SARS-CoV-2 relies on allowing a large portion of the population to become infected. Therefore, the spread of SARS-CoV-2 will rapidly destroy health care systems. Depletion in healthcare resources will not only increase the death rate due to COVID-19 but also increase the total deaths [Citation17]. The threshold for herd immunity needed for disease decay could be calculated as 1–1/R0 [Citation17,Citation25]. At our estimation of R0, this threshold will be about 50%. The total population in Egypt is estimated at the beginning of 2020 to be about 100,000,000 [Citation26]. This means that relaxing control measures could spread the infection within thousands of individuals in Egypt and subsequently increase number of deaths.
5. Conclusion and recommendations
The Basic reproductive number was high in our country at the beginning of the epidemic. This finding supports the governmental decision for the implemented control measures. Effective reproductive number dropped after the control measures till fluctuating around one including several peaks throughout the epidemic course. CFR also declined over time but slight increase in the last days was observed. After relaxation of the control measures, we recommend the instantaneous monitoring of the transmissibility and mortality in Egypt with emphasizing the importance of the analysis at the sub-national level.
Authors’ contributions
Mohamed Masoud: conceived the study design, searched the internet database, performed statistical analysis and shared in writing the manuscript.
Gihan Gewaifel: made a critical revision and gave the final approval.
Nahla Gamaleldin: shared in writing the manuscript, gave the final editing of the manuscript, and submitted the manuscript.
Disclosure statement
No potential conflict of interest was reported by the authors.
Additional information
Notes on contributors
Mohamed Masoud
Mohamed Masoud is a Associate professor of Public heath department, Faculty of Medicine at Fayoum University.
Gihan Gewaifel
Gihan Gewaifel is a Associate professor of Preventive and Social Medicine, Community Medicine Department, Faculty of Medicine, Alexandria University.
Nahla Gamaleldin
Nahla Gamaleldin is a Lecturer of Preventive and Social Medicine, Community Medicine Department, Faculty of Medicine, Alexandria University.
- Huang C, Wang Y, Li X, et al. Clinical features of patients infected with 2019 novel coronavirus in Wuhan, China. Lancet. 2020;395(10223):497–506.
- Wu F, Zhao S, Yu B, et al. A new coronavirus associated with human respiratory disease in China. Nature. 2020;579(7798):265–269.
- World Health Organization Director-General’s Opening Remarks at the Media Briefifing on COVID-19–11 March 2020. [cited 2020 Jun 15]. Available from: https://www.who.int/dg/speeches/detail/who-director-general-s-openingremarks-atthe-media-briefifing-on-covid-19—11-march-2020
- Lauer SA, Grantz KH, Bi Q, et al. The incubation period of coronavirus disease 2019 (COVID-19) from publicly reported confirmed cases: estimation and application. Ann Intern Med. 2020;172(9):577–582. Epub 10 Mar 2020.
- WHO. Strengthening and adjusting public health measures throughout the COVID-19 transition phases, Policy considerations for the WHO European Region. 2020 April 24. Denmark: WHO Regional Offce for Europe.
- Britton T. Basic estimation-prediction techniques for Covid-19, and a prediction for Stockholm. medRxiv. 2020; 04.15.20066050. DOI:10.1101/2020.04.15.20066050
- Wallinga J, Lipsitch M. How generation intervals shape the relationship between growth rates and reproductive numbers. Proc Biol Sci. 2007;274(1609):599‐604.
- Viboud C, Simonsen L, Chowell G. A generalized-growth model to characterize the early ascending phase of infectious disease outbreaks. Epidemics. 2016;15:27–37.
- Sanche S, Lin YT, Xu C, et al. High contagiousness and rapid spread of severe acute respiratory syndrome coronavirus 2. Emerg Infect Dis. 2020;26(7):1470–1477. Jul [date cited]. https://doi.org/10.3201/eid2607.200282
- He X, Lau EHY, Wu P, et al. Temporal dynamics in viral shedding and transmissibility of COVID-19. Nat Med. 2020;26(5):672–675.
- Zhuang Z, Zhao S, Lin Q, et al. Preliminary estimates of the reproduction number of the coronavirus disease (COVID-19) outbreak in Republic of Korea and Italy by 5 March 2020. Int J Infect Dis. 2020;95:308–310.
- Cori A, Ferguson NM, Fraser C, et al. A new framework and software to estimate time-varying reproduction numbers during epidemics. Am J Epidemiol. 2013;178(9):1505‐1512.
- Yuan J, Li M, Lv G, et al. Monitoring transmissibility and mortality of COVID-19 in Europe [published online ahead of print, 2020 Mar 28]. Int J Infect Dis. 2020;95:311‐315.
- Du Z, Xu X, Wu Y, et al. Serial interval of COVID-19 among publicly reported confirmed cases. Emerg Infect Dis. 2020;26(6):1341–1343.
- Li Q, Guan X, Wu P, et al. Early transmission dynamics in Wuhan, China, of novel coronavirus-infected pneumonia. N Engl J Med. 2020;382(13):1199–1207.
- Ridenhour B, Kowalik JM, Shay DK. Unraveling R0: considerations for public health applications. Am J Public Health. 2014;104(2):e32–e41.
- Randolph HE, Barreiro LB. Herd immunity: understanding COVID-19. Immunity. 2020;52(5):737–741.
- Zhao Z, Li X, Liu F, et al. Prediction of the COVID-19 spread in African countries and implications for prevention and control: A case study in South Africa, Egypt, Algeria, Nigeria, Senegal and Kenya. SciTotal Environ. 2020;729:138959.
- Statement on the meeting of the International Health Regulations. Emergency Committee regarding the outbreak of novel coronavirus 2019 (n- CoV) on 23 January 2020; 2005. [accessed: 2020 June 21]. Available from: https://www.who.int/news-room/detail/23-01-2020-statement-on-themeeting-of-the-international-healthregulations-(2005)-emergency-committee-regarding-the-outbreak-of-novelcoronavirus-(2019-ncov)
- Liu Y, Gayle AA, Wilder-Smith A, et al. The reproductive number of COVID-19 is higher compared to SARS coronavirus. J Travel Med. 2020;27(2). DOI:10.1093/jtm/taaa021
- Linka K, Peirlinck M, Costaba FS, et al. Outbreak dynamics of COVID-19 in Europe and the effect of travel. Comput Methods Biomech Biomed Engin. 2020;23(11):710–717.
- Zhao S, Chen H. Modeling the epidemic dynamics and control of COVID-19 outbreak in China. Quant Biol. 2020;8(1):11–19.
- Hwang J, Park H, Kim SH, et al. Basic and effective reproduction numbers of COVID-19 cases in South Korea excluding Sincheonji cases. Medrxiv. 2020. DOI:10.1101/2020.03.19.20039347
- Abdollahi E, Champredon D, Langley JM, et al. Temporal estimates of case-fatality rate for COVID-19 outbreaks in Canada and the United States. CMAJ. 2020;192(25):E666–E670.
- Nikbakht R, Baneshi MR, Bahrampour A, et al. Comparison of methods to estimate basic reproduction number (R0) of influenza, using Canada 2009 and 2017-18 A (H1N1) data. J Res Med Sci. 2019;241:67. Published 2019 Jul 24.
- Central Agency for Public Mobilization and Statistics (CAPMAS). Egypt in Figures; Population 2020 . [accessed 2020 June 21]. available online on https://www.capmas.gov.eg/Pages/StaticPages.aspx?page_id=5035