
ABSTRACT
Background
Obesity is a major health problem with increasing prevalence and directly contributes to the development of cardiovascular disease (CVD). Selenoprotein P (Se P) is a novel hepatokine that affects glucose metabolism, lipid metabolism, and correlating with insulin resistance, inflammation, and atherosclerosis. Plasma Se P level is one of the promising biomarkers for predictions or diagnoses/prognoses of the diseases.
Objective
Evaluating the serum level of Selenoprotein P in overweight, obese, and lean individuals and its relation to insulin resistance and cardiometabolic parameters.
Subjects and Methods
A cross-sectional study was conducted in the Outpatient Endocrinology Clinics, Internal Medicine Department, Menoufia University Hospitals on 90 individuals that were divided into two groups: (group I) 50 overweight and obese individuals (with body mass index (BMI) in the range 25.0–29.9 kg/m2 and ≥30.0 kg/m2, respectively) and (group II) 40 lean individuals with BMI in the range (18.5–24.9) kg/m2. All subjects were subjected to detailed history taking, clinical examination, and laboratory investigations including fasting and 2 hours postprandial blood sugar, lipid profile, fasting serum insulin level, Homeostatic Model Assessment of Insulin Resistance (HOMA-IR), and serum Se P.
Results
Se P concentrations were significantly increased in overweight and obese group than lean group (p < 0.001). Se P concentration was related to various cardio-metabolic parameters. In overweight and obese group there was a significant positive correlation between serum Selenoprotein p level and waist circumference (WC) (r −0.453, p <0.001), hip circumference (HC) (r = 0.464, p < 0.001), waist-hip ratio (WHR) (r −0.506, p < 0.001), visceral adiposity index (VAI) (r = 0.323, p = 0.022), fasting serum insulin (r = 0.585, p < 0.001), and HOMA-IR (r = 0.570, p < 0.001).
Conclusion
Circulating Se P concentrations is elevated in obesity and related to insulin resistance, visceral adiposity, and atherogenic index of plasma.
1. Introduction
In recent years, there has been growing interest in clarifying the pathogenesis of some chronic diseases, such as obesity and type 2 diabetes mellitus (T2DM). Metabolic alterations in these diseases are characterized by chronic hyperglycemia and insulin resistance (IR) [Citation1]. Obesity is a crucial factor in the development of insulin resistance, and is strongly associated with impaired glucose metabolism [Citation2].
In the majority of the cases, the pathogenic mechanisms of insulin resistance are due to insulin signaling pathways defect, and adipose tissue dysfunction. The severity of obesity does not always correlate with the severity of insulin resistance [Citation3].
Selenium is an anti-inflammatory and antioxidant micronutrient essential for the activity of selenoproteins, such as glutathione peroxidase (GPx) and selenoprotein P. These enzymes are also involved in insulin regulation. Several studies have revealed selenium to be an insulin-mimetic, because it plays roles in the regulation of enzymes in the insulin signaling cascade, the expression of lipogenic enzymes, reduced concentrations of reactive oxygen species, and carbohydrate metabolism in the liver [Citation1].
Selenoprotein P is one of hepatokines family that are proteins produced by the liver and involved in regulating glucose and lipid metabolism [Citation4]. Selenoprotein P (Se encoded by SELENOP) is major selenium (Se)-containing protein in human plasma and the “P” denotes its presence in plasma. Se P is synthesized mainly in the liver and secreted to extracellular fluid [Citation5].
Recently, 25 Se-containing proteins, namely selenoproteins, have been discovered in humans, including 5 glutathione peroxidases (GPxs) and 3 thioredoxin reductases (TrxRs), which play a crucial role in antioxidative defense. Selenoprotein P is involved in regulating glucose and lipid metabolism. Recent studies indicate that Se P levels are increased in patients with type 2 diabetes. Furthermore, elevated levels of Se P disturb the function of pancreatic β cells and inhibit insulin secretion [Citation5].
Circulating Se P as a negative acute phase reactant is downregulated by inflammation. Therefore, their lower levels observed in individuals with the metabolic syndrome might be explained by their higher inflammatory state. Also, some studies have shown that high blood Se P concentration has been associated with an increased risk of type 2 diabetes, metabolic syndrome (MetS), adverse blood lipid profile, and increased mortality [Citation6].
Recently, more focus was paid to the working mechanisms of Se P in metabolic disorders. As being a member of hepatokines, Se P establishes the crosstalk between the liver, the muscle, and the adipose tissue [Citation7].
Although emerging studies have evaluated the relationships of Se P to obesity-related diseases, the interrelationships with the cardiometabolic parameters have not been studied in detail. Therefore, we aim to evaluate circulating Se P levels in correlation with cardiometabolic parameters in overweight and obese patients.
2. Subject and methods
2.1. Participants
An informed written consent was obtained from every subject participating in this study which was approved by the Ethical Committee of Medical Research, Faculty of Medicine, Menoufia University. This cross-sectional study was conducted on 90 individuals from the outpatient and inpatient Endocrinology Clinics, Internal Medicine Department, Menoufia University Hospitals.
Both sexes of age more than 16 years old were included. Exclusion criteria were significant medical conditions, medications known to affect glucose metabolism, energy metabolism, body weight, appetite, smoking cigarettes, or drinking >140 g of alcohol/week.
All Subjects underwent thorough medical history taking and full general and clinical examinations.
2.2. Measurement and calculations
Measurement of weight and height, waist circumference (WC), hip circumference (HC), in addition to the calculation of body mass index (BMI) as follows: weight in kilograms divided by the square of the height in meters [weight in kg/(height in m)2], waist – hip ratio (WHR) and waist – height ratio (WHtR). Homeostatic Model Assessment of Insulin Resistance (HOMA-IR); was also calculated as follows [HOMA-IR = fasting insulin (μg/mL) × fasting blood glucose (mg/dL)/405] [Citation8,Citation9].
Lipid accumulation product (LAP); was calculated as: LAP in men = (WC-65) × TG; LAP in women = (WC-58) × TG] [Citation10], visceral adiposity index (VAI); which was calculated as: Males: VAI = [WC/(39.68 + (1.88× BMI))] × [TG/1.03] × [1.31/HDL] and in Females: VAI = [WC/(36.58 + (1.89× BMI))] × [TG/0.81] × [1.52/HDL]. Where: VAI = visceral adiposity index, WC = waist circumference, BMI = body mass index, TG = triglycerides, HDL = high-density lipoproteins [Citation11]. Atherogenic index of plasma (AIP); was calculated as log TG/HDL-C [Citation12].
2.3. Sampling
Under complete aseptic conditions, 5 ml venous blood sample was collected from each participant after 8 hours of fasting, allowed to clot, then centrifuged for 15 minutes at 3000 rpm for separation of the serum to assess all serum biochemical tests including: Fasting blood sugar (FBS), lipid profile; serum cholesterol, serum triglycerides, High-density lipoprotein Cholesterol (HDL-C), low-density lipoprotein Cholesterol levels (LDL-C), and fasting serum insulin and serum selenoprotein P.
Another venous blood sample was taken after 2 hours post prandial for assessment of 2 hours postprandial blood glucose.
2.4. Laboratory methods
On (RANDOX Laboratories LTD, UK) biochemical tests for measurement of Fasting blood sugar (FBS), 2 hours postprandial blood sugar (2HPPBS) by glucose oxidase-peroxidase method. Lipid profile; total cholesterol and triglyceride were measured by cholesterol oxidase-peroxidase and glycerol phosphate kinase methods, respectively. HDL – Cholesterol was measured by the phosphotungstate precipitation method. LDL – Cholesterol was calculated using the Friedwald formula [Citation13].
2.5. Serum fasting insulin and selenoprotein p measurement
Assay of serum insulin and selenoprotein p was done separately by the Enzyme-Linked Immune Sorbent Assay (ELISA) method, using the kits supplied by Shanghai Sunred Biological Technology Co., Ltd. Catalog No. 201–12-1720. +e kit uses a double-antibody sandwich enzyme-linked immunosorbent assay (ELISA). Insulin and selenoprotein P were added to monoclonal antibodies enzyme well which were precoated with human insulin and selenoprotein monoclonal antibody incubation; then, insulin and selenoprotein antibodies labeled with biotin and combined with streptavidin-HRP were added to each other to form an immune complex; then for removal of the uncombined enzyme, incubation and washing again were done. The chromogen solutions A and B were added. The liquid color changes into blue, and finally, the color becomes yellow at the effect of acid. The chroma of color was positively correlated to the concentration of the Human Substance insulin and selenoprotein p in the sample
2.6. Statistical analysis
Results were tabulated and statistically analyzed by using a personal computer using MICROSOFT EXCEL 2016 and SPSS v. 20 Data were then imported into Statistical Package for the Social Sciences (SPSS Inc., Chicago, IL, USA. Statistical analysis was done using: Descriptive: e.g. percentage (%), mean and standard deviation. Analytical: that includes independent t-test, Chi-Squared (χ2), and receiver operating characteristic (ROC). A value of p less than 0.05 was considered statistically significant.
3. Results
3.1. Clinical and laboratory characteristics of the participants
The study groups were matched concerning age, sex, and height without any significant difference, but weight, BMI, waist and hip circumferences, WHpR and WHtR, BP, serum cholesterol, HDL-C, LAP, VAI and AIP were significantly higher among obese and overweight than lean individuals (p < 0.001) (), while FBS, serum insulin concentration, HOMA-IR, and serum selenoprotein P concentration were significantly higher among obese and overweight than lean individuals (p < 0.001) for all. Moreover, 100% of the obese and overweight individuals and 57.5% only of lean subjects were insulin resistant ( and ).
Table 1. Comparison between the two studied groups according to socio-demographic and anthropometric data
Table 2. Comparison between the two studied groups according to clinical and laboratory data
Table 3. Comparison between the two studied groups according to serum insulin level, insulin sensitivity, and serum selenoprotein P level
Figure 1. Comparison between the two studied groups according to serum selenoprotein P concentration
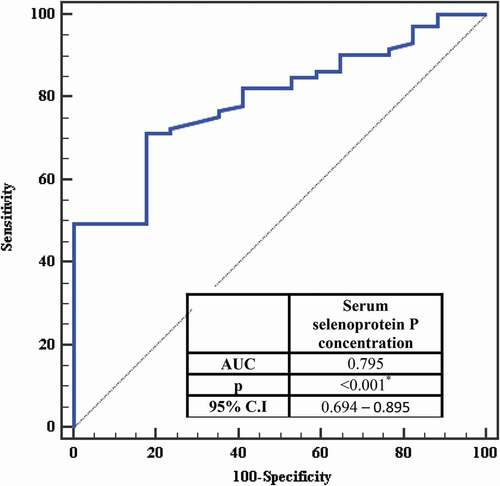
The receiver operating characteristic curve for serum selenoprotein P with insulin resistance showed that Area Under Curve was (0.795), Confidence Intervals (0.694 – 0.895) and (P <0.001) and the serum selenoprotein P is significant for the prediction of insulin resistance at a cut-off value > 5.3 with a sensitivity of 71.23% and specificity of 82.35% ( and ).
Table 4. Cut-off point for serum selenoprotein P concentration (mg/L) to predict insulin resistance in the total sample
Figure 2. ROC curve for Serum selenoprotein P concentration (mg/L) to predict insulin resistant in total sample
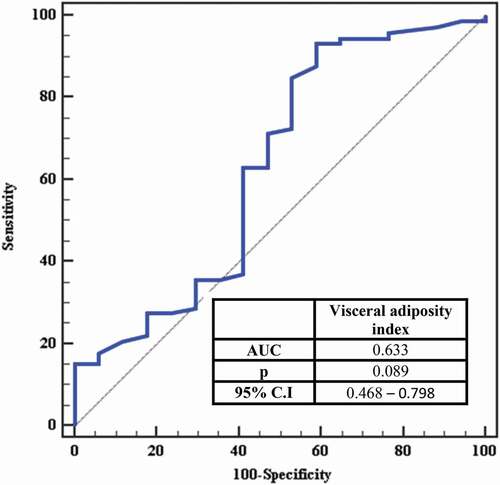
ROC curve for visceral adiposity index to predict insulin sensitivity showed that Area Under Curve was (0.633), Confidence Intervals (0.468 – 0.798) and (P =0.089 and VAI concentration >1.08 mg/L has a high ability to predict insulin resistance (AUC: 0.633) with sensitivity (93.15%) and specificity (41.18%) ( and ).
Table 5. Cut-off point for visceral adiposity index to predict insulin resistance in the total sample
Figure 3. ROC curve for visceral adiposity index to predict insulin resistant in total sample
3.2. Correlation between Se P level and cardiometabolic risk factors
In the current study, waist circumference (r −0.453, p = 0.001), hip circumference (r = 0.464, p = 0.001), waist-hip ratio (r −0.506, p < 0.001), serum insulin concentration (r = 0.585, p < 0.001), HOMA IR (r =0.570, p < 0.001) and visceral adiposity index (r = 0.323, p = 0.022) are significantly correlated with serum selenoprotein P in obese and overweight group but there is no correlation is found between Se P and these variables in lean group. There is no correlation between serum selenoprotein P and lipid profile among the two groups.
Table 6. Correlation between serum selenoprotein P concentration different parameters in each group
Regarding multivariate analysis, it is found that hip circumference and serum insulin concentration are the most independent factors affecting selenoprotein P in overweight and obese subjects (n = 50). Moreover, regarding univariate analysis, it is found that waist and hip circumferences, WHR, serum insulin concentration, HOMA IR, and VAI are the most independent factors affecting selenoprotein P in overweight and obese subjects ().
Table 7. Univariate and multivariate analysis for the parameters affecting Serum selenoprotein P concentration in overweight/obesity (n = 50)
4. Discussion
Obesity is one of the major health burdens as it contributes to the growing prevalence of its related comorbidities [Citation14]. It is associated with the development of insulin resistance, type 2 diabetes, cardiovascular diseases, and other health problems, which can lead to further morbidity and mortality [Citation15].
Se P is a member of hepatokines family that is involved in whole-body metabolic homeostasis and is believed to participate in the development of metabolic disease [Citation16]. It is a selenium supply protein, primarily expressed in the liver. Se P serves as a hepatokine that contributes to the onset of hyperglycemia in type 2 diabetes by imparting insulin signal transduction in the liver and skeletal muscle [Citation17].
In this regard, we evaluated circulating Se P levels in correlation with cardiometabolic parameters in overweight and obese patients. Our study reveals that the overweight and obese group has significantly higher body weight, BMI, WC, HC, WHpR, and WHtR than lean subjects.
Obesity is associated with higher blood pressure, Low-Density Lipoprotein cholesterol, triglycerides, blood glucose, and lower high-density lipoprotein (HDL) cholesterol [Citation18]. The overweight and obese group had significantly higher SBP and DBP values; higher prevalence of hypertension than lean subjects. This agreed with Du et al. [Citation19] who found that obese subject was higher than normal subjects in mean systolic and diastolic blood pressure (p < 0.001).
In our study, there is a significant elevation as regard serum cholesterol and HDL-C and a nonsignificant difference as regard serum TG and LDL-C. This disagreed with Chen et al. [Citation20] who found that obese/overweight subjects had increased LDL cholesterol and triglycerides. Also, Shen et al. [Citation21] had found that mean TG, TC, and LDL-C were higher in subjects with abdominal obesity compared to those with normal WC.
Szczygielska et al. [Citation22] had found that serum cholesterol and TG were higher in obese persons in comparison to normal-weight subjects while HDL-C was lower among them. Also, Shen SW et al. [Citation21] had found that mean TG, TC, and LDL-C were higher in subjects with abdominal obesity compared to those with normal WC.
BMI is widely used for classifying obesity but does not differentiate fat from lean mass. Excess visceral adipose tissue (VAT) is strongly linked with cardiovascular disease. LAP index, a recently developed biomarker of central fat accumulation, which is a precise indicator of the risk of insulin resistance, metabolic syndrome, type 2 diabetes, and cardiovascular disease [Citation23]. VAI estimates visceral fat distribution and substituted the necessity to take high-cost imaging studies, thereby making the prediction much more practical in daily clinical practice [Citation24]. Also, the atherogenic index of plasma (AIP) is a strong marker for the future risk of atherosclerosis and cardiovascular disease [Citation25].
Few studies have investigated the performance of different obesity indices in the association with selenoprotein with obesity. In our study, we confirmed that obese and overweight subjects had significant increased LAP and VAI, and AIP compared with lean subjects.
This agrees with Shen et al. [Citation21] who found that AIP level was indicative of abdominal obesity. They found that mean AIP, SBP, DBP, and FBG were higher in subjects with abdominal obesity compared to those with normal WC.
Pekgor et al. [Citation26] study revealed that HOMA-IR and VAI levels were higher in subjects with metabolic syndrome. The cutoff value of VAI in predicting MetS was found to be 2.205.
Ray et al. [Citation27] case–control study was conducted with cases of metabolic syndrome and control subjects. BMI, WC, and lipid accumulation product index were significantly higher in metabolic syndrome. Although all were independently associated with metabolic syndrome, the lipid accumulation product index had the highest prediction accuracy.
Se P caused cellular insulin resistance of hepatocytes and myocytes in vitro, detected by the suppression of IR autophosphorylation, reduction of the downstream AKT pathway responding to insulin, and a decline in insulin-evoked cellular glucose uptake. The molecular mechanisms underlying this Se P-induced acquisition of insulin-resistance vary among tissues/cells; Se P caused insulin-resistance through the suppression of the AMPK pathway at least in part in hepatocytes, whereas Se P induced the insulin-resistance of myocytes independently of the AMPK pathway. Furthermore, excess plasma Se P depletes insulin production by eliminating pancreatic β cells [Citation28].
We found that obese and overweight subjects had increased waist and hip circumferences, WHR, serum insulin concentration, HOMA-IR, and VAI compared with lean subjects. Circulating Se P concentrations appear to be correlated with cardiometabolic parameters.
Regarding multivariate analysis, it is found that hip circumference and serum insulin concentration are the most independent factors affecting selenoprotein P in overweight and obese subjects (n = 50). Moreover, as regarding univariate analysis is found that waist and hip circumferences, WHR, serum insulin concentration, HOMA IR, and VAI are the most independent factors affecting selenoprotein P in overweight and obese subjects.
Chen et al. [Citation20] who measure plasma Se P in individuals who are lean or overweight/obese and found that these values were increased in obese/overweight subjects. They examined the relationship between circulating Se P and markers of insulin resistance and found that Se P was higher in individuals who were overweight/obese and it was correlated negatively with BMI. Their study suggests that obesity, rather than insulin resistance, is central to the increase in Se P.
Yang et al. [Citation29] study of selenoprotein concentration in subjects with diverse glucose tolerance statuses showed that overweight and obese subjects had increased Se P levels compared with lean subjects.
We also performed an ROC curve analysis to evaluate the sensitivity and specificity of serum selenoprotein P to predict insulin sensitivity. Serum selenoprotein P concentration >5.3 mg/L has a high ability to predict insulin resistance (AUC: 0.795) with sensitivity (71.23%) and specificity (82.35%).
Also, we performed an ROC curve analysis to evaluate the sensitivity and specificity of visceral adiposity index to predict insulin sensitivity. VAI concentration >1.08 mg/L has a high ability to predict insulin resistance (AUC: 0.633) with sensitivity (93.15%) and specificity (41.18%).
5. Conclusions
We demonstrated a significant increase in circulating Se P levels in overweight, obese subjects, and those with visceral adiposity. Furthermore, Se P levels were independently associated with atherosclerosis as well as insulin resistance. Se P is specific and sensitive in detecting insulin resistance with sensitivity 71.23% and specificity 82.35%. These results suggest that the liver-derived secretory protein Se P may play an important role in insulin resistance-related disorders, including T2DM and atherosclerosis.
Disclosure statement
No potential conflict of interest was reported by the authors.
References
- Fontenelle LC, Feitosa MM, Morais JB, et al. The role of selenium in insulin resistance. Braz J Pharm Sci. 2018;54(1). https://doi.org/10.1590/s2175-97902018000100139.
- Graae AS, Hollensted M, Kloppenborg JT, et al. An adult-based insulin resistance genetic risk score associates with insulin resistance, metabolic traits and altered fat distribution in danish children and adolescents who are overweight or obese. Diabetologia. 2018;61(8):1769–1779.
- Bril F, Cusi K. Basic concepts in insulin resistance and diabetes treatment. In: Cohen Sabban E.,Puchulu F.,Cusi K. (eds). Dermatology and diabetes. Berlin: Springer; 2018. p. 19–35.
- Flisiak-Jackiewicz M, Bobrus-Chociej A, Wasilewska N, et al. Can hepatokines be regarded as novel non-invasive serum biomarkers of intrahepatic lipid content in obese children? Adv Med Sci. 2019;64(2):280–284. .
- Saito Y. Selenoprotein P as an in vivo redox regulator: disorders related to its deficiency and excess. J Clin Biochem Nutr. 2020;66(1):1–7.
- Di Giuseppe R, Koch M, Nöthlings U, et al. Metabolomics signature associated with circulating serum selenoprotein P levels. Endocrine. 2019;64(3):486–495. .
- Ke Y, Xu C, Lin J, et al. Role of hepatokines in non-alcoholic fatty liver disease. J Transl Int Med. 2019;7(4):143–148. .
- Thaker VV, Falkner B. Insulin Resistance and Other Mechanisms of Obesity Hypertension. In: Flynn J, Ingelfinger J, Redwine K, editors. Pediatric Hypertension. Springer, Cham; 2017;1–22
- Dilmen OK. Methods used to measure postoperative insulin resistance. Int Urol Nephrol. 2017;49(4):647.
- Kyrou I, Panagiotakos DB, Kouli GM, et al. Lipid accumulation product in relation to 10-year cardiovascular disease incidence in caucasian adults: the ATTICA study. Atherosclerosis. 2018;279:10–16.
- Gârgavu SR, Clenciu D, Roşu MM, et al. Visceral adiposity index (VAI) – a potential marker of cardiometabolic risk. Arch Balkan Medical Union. 2018;53(2):246–251. .
- Bo MS, Cheah WL, Lwin S, et al. Understanding the relationship between atherogenic index of plasma and cardiovascular disease risk factors among staff of an university in Malaysia. J Nutr Metab. 2018;2018:7027624.
- Friedwald WT, Levy RL, Fredrickson DS. Estimation of the concentration of low density lipoprotein Cholesterol in plasma without use of the preparative ultracentrifuge. Clin Chem. 1972;18(6):499.
- Zatterale F, Longo M, Naderi J, et al. Chronic adipose tissue inflammation linking obesity to insulin resistance and type 2 diabetes. Front Physiol. 2020;10:1607.
- Huang RL, Li CH, Du YF, et al. Discovery of a role of the novel hepatokine, hepassocin, in obesity. Biofactors. 2020 Jan;46(1):100–105.
- Ennequin G, Sirvent P, Whitham M. Role of exercise-induced hepatokines in metabolic disorders. Am J Physiol Endocrinol Metab. 2019;317(1):E11–E24.
- Chadani H, Usui S, Inoue O, et al. Endogenous selenoprotein P, a liver-derived secretory protein, mediates myocardial ischemia/reperfusion injury in mice. Int J Mol Sci. 2018 Mar 16;19(3). pii: E878.
- Callo Quinte G, Barros F, Gigante DP, et al. Overweight trajectory and cardio metabolic risk factors in young adults. BMC Pediatr. 2019;19(1):75.
- Du T, Yu X, Zhang J, et al. Lipid accumulation product and visceral adiposity index are effective markers for identifying the metabolically obese normal-weight phenotype. Acta Diabetol. 2015;52(5):855–863.
- Chen M, Liu B, Wilkinson D, et al. Selenoprotein P is elevated in individuals with obesity, but is not independently associated with insulin resistance. Obes Res Clin Pract. 2017 Mar;11(2):227–232.
- Shen SW, Lu Y, Li F, et al. Atherogenic index of plasma is an effective index for estimating abdominal obesity. Lipids Health Dis. 2018;17(1):11.
- Szczygielska A, Widomska S, Jaraszkiewicz M, et al. Blood lipids profile in obese or overweight patients. Ann Univ Mariae Curie Sklodowska Med. 2003;58(2):343–349.
- Mazidi M, Gao HK, Kengne AP. Lipid accumulation product and visceral adiposity index are associated with dietary patterns in adult Americans. Medicine (Baltimore). 2018;97(19):0322.
- Cardona-Alvarado MI, López-Moreno G, Aguilar H, et al. Relationship of visceral adiposity index with the metabolic phenotype and cardiovascular markers in non-diabetic subjects. Health Sci J. 2018;12(5):588.
- Choudhary MK, Eräranta A, Koskela J, et al. Atherogenic index of plasma is related to arterial stiffness but not to blood pressure in normotensive and never-treated hypertensive subjects. Blood Press. 2019;28(3):157–167. .
- Pekgor S, Duran C, Berberoglu U, et al. The role of visceral adiposity index levels in predicting the presence of metabolic syndrome and insulin resistance in overweight and obese patients. Metab Syndr Relat Disord. 2019 Jun;17(5):296–302.
- Ray L, Ravichandran K, Nanda SK. Comparison of lipid accumulation product index with body mass index and waist circumference as a predictor of metabolic syndrome in indian population. Metab Syndr Relat Disord. 2018 Jun;16(5):240–245.
- Tsutsumi R, Saito Y. Selenoprotein P; P for plasma, prognosis, prophylaxis, and more. Biol Pharm Bull. 2020;43(3):366–374.
- Yang SJ, Hwang SY, Choi HY, et al. Serum selenoprotein P levels in patients with type 2 diabetes and prediabetes: implications for insulin resistance, inflammation, and atherosclerosis. J Clin Endocrinol Metab. 2011;96(8):1325–1329.