
 ?Mathematical formulae have been encoded as MathML and are displayed in this HTML version using MathJax in order to improve their display. Uncheck the box to turn MathJax off. This feature requires Javascript. Click on a formula to zoom.
ABSTRACT
Introduction
The current study aimed to investigate whether the pattern of changes in lipid profile and fasting blood sugar (FBS) can predict the future risk of type 2 diabetes mellitus (T2DM) incidence in prediabetic people.
Methods
In a prospective cohort study, 1228 prediabetic patients were followed from 2003 until 2019 and longitudinal data on lipid indices (CHOL: cholesterol; HDL: high-density lipoprotein; LDL: low-density lipoprotein; TG: triglyceride) and fasting blood sugar (FBS) were recorded. The latent class growth model (LCGM) was used to estimate growth trajectories and to determine distinct subgroups (latent class) with a similar trajectory for lipid profile and FBS over time. The incidence of T2DM in extracted latent classes was compared.
Results
Finally, 946 people with complete data were included in statistical analysis. Two latent classes were identified based on the change in FBS including high-risk and low-risk classes (class size: 5.2% vs. 94.8%) with T2DM incidence rates 100% and 35.9%, respectively (P < 0.001). Two distinct subgroups were identified based on changes in lipid profile. Latent classes with abnormal TG, CHOL, HDL, and LDL included 18.8%, 21.8%, 38.8%, and 24% of study participants, respectively. The incidence rates of T2DM and remaining prediabetic in abnormal TG latent class were 57.2% and 30.8%, and in abnormal HDL latent class were 41.5% and 31.7% were significantly different from normal latent classes (P < 0.001). While in the extracted latent classes based on CHOL and LDL the incidence rates were not statistically significant differences (P > 0.05).
Conclusions
We identified two subgroups with high and low risk of future T2DM based on the changes in FBS and lipid profile by applying LCGM. The incidence of T2DM in extracted latent classes was significantly different. LCGM is a reliable approach for predicting the risk of T2DM incidence based on trajectories of risk factors.
1. Introduction
Type 2 diabetes mellitus (T2DM) was the seventh leading cause of death in 2016 and caused 1.6 million deaths in 2016. Approximately half of the deaths are attributed to T2DM, particularly in low- and middle-income countries, occur before age 70 [Citation1]. Various risk factors play key role in the development of T2DM like genetic factors, unhealthy lifestyle, and physiological disturbances (e.g. elevated serum lipids or free fatty acids). The onset of T2DM can be delayed through a healthy lifestyle or treatment of complications.
Dyslipidemia is one of the main comorbidities in patients with diabetes whilst it has been estimated that 79% and 90% of diabetic patients respectively in India and Jordan had abnormalities at least in one of the serum lipids [Citation2,Citation3]. Dyslipidemia is also overt in metabolic syndrome which suggests dyslipidemia might be more correlated with insulin resistance rather than hyperglycemia [Citation4]. Cumulative evidence indicates that dyslipidemia might not only be the consequence of insulin resistance but also the cause of it [Citation5]. Increased levels of triglyceride are associated with increased levels of free fatty acids which impair β-cell function and induce insulin resistance [Citation6–9].
The main feature of diabetic dyslipidemia is hypertriglyceridemia, decreased HDL-C and elevated levels of small dense LDL-C. Previous studies have evaluated the association of lipid levels with the future T2DM risk in various populations and with different statistical modeling approaches [Citation10–12]. However, it is not clear whether the pattern of changes in serum lipids and FBS over time can predict the risk of diabetes development. Therefore, in the current prospective cohort study, we used the latent class growth model (LCGM) to explore trajectories of blood lipids and fasting blood sugar in prediabetic subjects who are first degree relatives of T2DM patients over 16 years of follow-up and to classify these people into similar latent subpopulations (latent class) to determine which identified latent class based on the patterns of changes in aforementioned variables can be a better predictor for the onset of T2DM in future. LCGM can be useful for identifying individuals with similar pattern of changes based on studied characteristics over the time horizon and in line with its exploratory purposes helps to extract uncover hidden trajectories within the population.
2. Methods
2.1. Study design and subjects
Data from prediabetic participants of the Isfahan Diabetes Prevention Study (IDPS), a prospective cohort study, were used for the current secondary analysis. Details about the IDPS have been described elsewhere [Citation8,Citation9]. Briefly, the IDPS is an ongoing prospective cohort study established in 2003 to explore the role of lifestyle factors in the development of prediabetes and T2DM in future among first degree relative of T2DM patients. A total of 3483 participants, aged 30–70 years, were recruited from among the first-degree relatives of patients with T2DM who attended the clinics of Isfahan Endocrine and Metabolism Research Center, Isfahan, Iran and signed the informed consent form. The study was carried out in accordance with the Helsinki Declaration Principles. After excluding those either with normal blood sugar test or with T2DM, 1228 prediabetics cases remained to be included in the current secondary study and among them 946 people who had data on final status in terms of being normal or progression to T2DM and remaining prediabetes, were included in data analysis. Prediabetes is a condition in which serum glucose levels are higher than the normal threshold but not as higher as the threshold defined for diabetes. According to the American Diabetes Association (ADA) definition, prediabetes was determined using the following criteria: 100 ≤ FBS < 126 mg/dL or HbA1c (Hemoglobin A1c) ≥ 5.7–6.4% or 140 ≤ 2 h-OGTT (2- hour oral glucose tolerance test) < 200 mg/dL [Citation13].
2.2. Assessment of lipid profile and fasting blood sugar
To measure serum lipids including triglyceride (TG), total cholesterol (TC), HDL: high-density lipoprotein; LDL: low-density lipoprotein, and fasting blood sugar (FBS), a 10-h overnight fasting blood sample was drawn from each participant at baseline (2003) and repeated every year over the period of follow-up. Enzymatic colorimetric method (Pars Azmoon, Tehran, Iran) adapted to a Selectra-2 auto-analyzer (Vital Scientific, Spankeren, The Netherlands) was used to determine serum concentrations of TG, TC, HDL, LDL, and FBS. When serum TG levels were < 400 mg/dL, LDL-C levels were calculated using Friedewald formula [Citation14]; otherwise, it was measured directly. HbA1c levels were determined in the whole blood sample using the pink reagent kit on a DS5 analyzer. Abnormalities in lipid profile were defined according to the definition of the National Cholesterol Education Program (NCEP) expert panel’s criteria. Accordingly, hypertriglyceridemia, hypercholesterolemia, elevated LDL-C and low HDL-C were considered as TG>150 mg/dL, TC>200 mg/dL, LDL>130 mg/dL, and HDL<40 in men and <50 mg/dL in women, respectively [Citation15].
2.3. Other variables
Baseline examination to collect data about demographic, socioeconomic, and lifestyle factors were performed using a face-to-face interview by trained staff. Anthropometric and biochemical variables were measured using standard protocols. Bodyweight was measured to the nearest 0.1 kg and height was measured to the nearest 0.5 cm using a wall-fixed stadiometer while participants were barefoot and shoulders were in the normal position. All measurements were performed by trained examiners at baseline. Waist circumference (WC) was measured to the nearest 0.5 cm using a metal tape measure at the narrowest level between the lowest rib and iliac crest [Citation16]. Body mass index (BMI) was calculated by dividing body weight in kg by height in m2.
2.4. Statistical analysis
Continuous and categorical basic characteristics of the subjects were presented as mean± standard deviation (SD) and percentage and were compared between study groups using an analysis of variance (ANOVA) and Bonferroni post hoc test for pairwise compressions when ANOVA was statistically significant and Chi-squared tests, respectively. To provide a repeated measures data structure for using in our statistical modeling approach, i.e. latent class growth model (LCGM) three measurements including data at the beginning of cohort, the average measurements during follow up and the last measurement from each study participants was used. To evaluate the pattern of changes in fasting blood sugar and blood lipids (separately) over time, the LCGM was applied [Citation17].
The LCGM is a semiparametric model in the framework of the latent variables models that is used to analyze longitudinal data. Latent class growth model a multivariate application of structural equation model that examines how characteristics (outcome variable) of subjects change over time. In LCGM repeated measurement of observed variables are used as indicators of latent variables that represent different aspects of subjects’ change. LCGM attempts to model the heterogeneity evident in the population by identifying latent subgroups (i.e. classes), whereby subjects in each class demonstrate homogeneity (e.g. share certain characteristics or similar growth patterns). Therefore, all individual trajectories within each class are homogeneous and in different classes are heterogeneous.
The first step in the process of LCGM is the finding of the class number. Class enumeration allows researchers to determine the number of latent subgroups needed to best capture the heterogeneity evident in the population. It is recommended that the number of classes to be determined before adding any predictors to the model. The process begins by fitting a single class (i.e. unconditional) model and then adding classes to the model, examining fit statistics to determine whether the additional class improve the model fit or not. Fit statistics commonly used for latent class growth modeling include the Bayesian information criterion (BIC), Akaike information criterion (AIC), classification error rate, and entropy; a model has the best fit to data when the aforementioned indices are in the their lowest and the last one in its highest value [Citation18]. We fitted LGCM with one to four classes and finalized the number of classes by considering the optimal values of model fitting indices and interpretability of extracted latent classes. After the number of classes was determined, the covariates, including age, gender, physical activity, smoking habit, and educational status were added to the model as predictors of class membership.
The LCGM in the current study was used to identify latent classes from studied subjects based on trajectories of blood lipids and FBS (or classify subjects with similar trajectories). Each extracted latent class was interpreted based on mean values of serum lipids and FBS. A typical extracted latent class has been interpreted as high risk group when the mean values of TG, CHOL, LDL, FBS was high and HDL was low otherwise it was interpreted as low risk for future incidence of T2DM.Finally, the final status of each study subject at the end of cohort or last visit, i.e. diabetic, prediabetic, or normal was evaluated in each identified latent class (latent subpopulations) for examining the future risk. Data analysis was done by R free statistical software version 3.6.3.
3. Results
The study population consisted of 696 (73.6%) females and remaining males with a mean age ±SD of 44 ± 6.86 years. According to the final status of study participants (Normal, prediabetes, and type 2 diabetes), general characteristics of participants as well as the mean concentrations of biochemical markers at the beginning of the study (2003) and follow-up assessments (2003, 2019) are shown in [Citation10]. In comparison with individuals who remained prediabetes or progressed to T2DM at the end of the study, those who did not develop were younger and male however, in terms of other demographic and lifestyle variables, no significant difference was observed. Regarding biochemical variables, FBS, TG, CHOL, and LDL-C, in all three assessments (except for CHOL at time 1 and LDL-C at time 2), were significantly higher while HDL-C was lower in people with final status of diabetes in comparison with those who were normal. More details about the comparisons of depicts the LCGM model fit results. According to the relative goodness-of-fit measures, the values of both AIC and BIC for FBS and serum lipids were descending for the fitted models from the two-class to the four-class model. The error of classification was the minimum for the two-class model for all five study variables. Accordingly, the two-class model for FBS and lipid profile was the best identified fitted one.
Table 1. Basic demographic and clinical characteristics of study participants at the beginning of cohort across different categories of final status at the end of follow-up1
Table 2. Models fitting criteria for different extract classes by latent class growth trees analysis
and represent two identified latent classes in terms of mean trajectories of serum levels of FBS and lipid profile, the class size and the rate of being affected by T2DM, remaining prediabetes, and return to normal glucose tolerance. In class 1 (low-risk group), in all three time points, individuals had lower serum concentrations of FBS and TG, but higher serum levels of HDL-C compared with those who are in class 2 (high-risk group), accordingly the people in class 1 compared to class 2, had a lower risk for affecting by diabetes in future. Moreover, despite a considerable increase in the serum FBS of individuals in class 2 during the study follow up period, it just slightly changed in individuals who were classified in class 1. However, mean serum TC and LDL-C concentrations were higher in class 1 compared to class 2. In addition, compared with class 2, class 1 had a greater size for all 5 variables ranged from 61.19% for HDL-C to 94.84% for FBS. As shown in , in extracted class 2 (high risk class) based on FBS, TG, and HDL, 100%, 57.2%, and 41.5% of individuals, respectively, progressed to T2DM after 16 years of follow-up whereas the corresponding values for people in class 1 were 35.9%, 35.2%, and 35.1%, respectively (P < 0.001). The rate of remaining prediabetes at the end of follow-up, in extracted latent classes based on FBS, TG, and HDL-C, was 37.9%, 37.0%, and 40.2% in class 1, respectively compared with 0.0%, 30.8%, and 31.7% of participants in class 2 (P < 0.001). The distribution of final status of people in terms of progress to diabetes, remaining prediabetes, and return to normal glucose tolerance in identified latent classes based on trajectories of FBS, TG and HDL were significantly different in which the rate of progression to diabetes was significantly higher in high-risk class (class 2) in comparison with class 1(P < 0.001), while no significant difference was observed between extracted classes based on Cholesterol and LDL (P > 0.05).
Figure 1. The mean level of FBS and lipid indices over time in identified latent classes using LGCM.
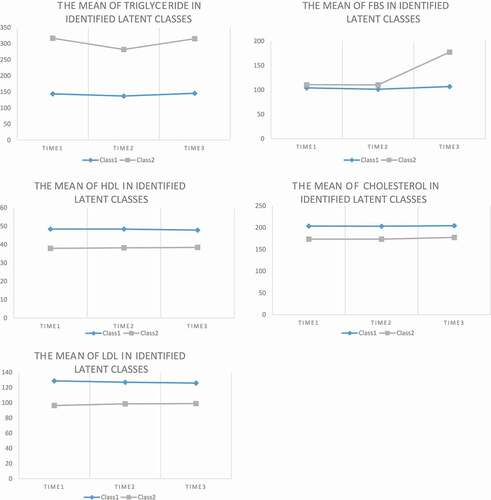
Table 3. The identified latent classes of subjects based on, the mean of FBS, TG, CHOL, HDL, and LDL resulted from latent class growth trees analysis
4. Discussion
The present study primarily aimed to determine the longitudinal association between the pattern of changes in FBS and lipid profile and the onset of T2DM in the prediabetic people who are first-degree relatives of family of patients with T2DM participated in the IDPS. During a follow-up of 16 years, we recognized that a two-class model is a best-fitted model based on the changes in lipid indices and FBS. In the examination of these classes concerning the development of T2DM, we identified a significant higher T2DM incidence for class 2 (consisted of people with higher mean of FBS, TG, and lower mean HDL) whereas we did not detect a significant difference between constructed classes based on TC and LDL-C in terms of risk of T2DM development.
For individuals in class 1, including 94.8% of participants, FBS was persistently slightly abnormal throughout 16 years of follow-up. The rate of T2DM incidence and remaining prediabetes was 35.9% and 37.9%, respectively. While in class 2, including people with abnormal elevated FBS level, 100% of participants progressed to T2DM. Similar patterns of changes were observed in extracted latent classes based on TG and the incidence of T2DM in class 1 was 35.2% vs. 57.2% in class 2 consisted of people with high elevated TG. Regarding HDL-C, the rate of remaining prediabetes was higher than progress to T2DM in those who were classified into class 1 whereas for individuals in class 2 the T2DM incidence rate was higher. Although rare studies evaluated the patterns of changes in blood sugar and lipid profile in association with the incidence of T2DM in prediabetic people, many studies investigated the risk of development of T2DM in persons who had dyslipidemia in other population such as general or pediatrics [Citation10–12,Citation19,Citation20]. Scarce previous studies investigated the patterns of changes in lipids and glucose indices in prediabetic people using other statistical modeling approaches; however, they did not evaluate the risk of T2DM in future in these people [Citation10,Citation21].
Earlier studies have suggested hypertriglyceridemia, low HDL-C, and small particles of LDL-C as typical dyslipidemia in insulin resistance. Consistently, our findings confirmed the relevance of hypertriglyceridemia and low serum levels of HDL-C in the development of T2DM [Citation22–25]. On the other hand, it seems that a high TG to HDL-C ratio is a feature of insulin resistance [Citation25]. This association might be attributed to the role of triglyceride and HDL in the metabolism of glucose and insulin function. Elevated free fatty acids, as a result of increased levels of triglyceride, disrupt the linkage of insulin and glucose transporters, impair β-cell functions, and induce subclinical inflammation. Furthermore, HDL-C may improve insulin secretion and sensitivity through its anti-inflammatory properties, at least for some specific subtypes, and changing the intracellular microenvironment (lipids and inflammatory cytokines) by reverse cholesterol transport [Citation5,Citation26,Citation27]. Consistently, in a mouse model study, Apo lipoprotein (apoA1) knock-out has been associated with lower muscle glucose uptake but higher serum levels of glucose, triglyceride, and HbA1c [Citation28]. However, we failed to find any significant association between patterns of change in LDL-C and TC with incidence of T2DM. This null association might be, at least to some extent, explained by the lack of measurement of the LDL-C particles’ sizes [Citation20]. Indeed, the different lifestyles between Iranians and the Western population, can be mentioned as one the reason for the difference in average of LDL-C particles’ sizes between two population. For example, higher carbohydrate and lower fat consumption by Iranians in comparison with the Western might be associated with larger LDL-C particles’ sizes and therefore make it a weaker culprit of the T2DM development in Iranians.
To our knowledge, this is the first study used LGCM to identify the association between the pattern of changes in serum lipids and FBS and the risk of T2DM development during a long duration of follow-up in prediabetic people. Other studies have investigated the association of lipid and FBS levels or change in their levels over time with the risk of T2DM in a different population than in our study or with other statistical modeling approaches. The majority of previous studies neglected the fluctuations in lipid or FBS levels over time in association with the risk of affecting by T2DM. Whereas recently, it has been shown there is a relationship between lipid indices variability and different diseases, suggesting lipid fluctuations as an important risk factor for various health and clinical outcomes. Our statistical modeling approach enabled us to cover comprehensively the patterns of fluctuations in lipid indices and FBS for classifying our at-risk population into high or low risk groups (latent classes) in terms of trajectories of change in these variables. Finally, we evaluated the rate of progression to T2DM in each identified class. This is the unique property of LGCM that could not be followed by other statistical methods such as latent Markov models [Citation10].
Although our study is the first one examined the latent classes of FBS and lipid profile changes in relation to the incidence rate of T2DM, it has several limitations which should be considered when interpreting our results. First, our study participants were not a representative sample of Iranians and therefore the generalizability of our findings might be limited only to the first degree relative of people with T2DM. Second, although the association between LDL-C and the risk of prediabetes and T2DM incidence might be affected by the size of LDL-C particles, we did not have any data to further evaluate this association. Despite these limitations, our study includes a large sample from different socioeconomic status levels and the diagnosis of outcomes was based on laboratory tests rather than self-report. In addition, we applied an advanced statistical model that classifies prediabetic people based on trajectories of lipid indices and FBS for identifying high risk groups to predict the risk of T2DM development, reliably.
5. Conclusions
In conclusion, the present study demonstrates that individuals who have abnormal serum glucose and lipid levels over time are more probable to develop T2DM in comparison with those who have an approximately constant trajectories in these indices. Our study specifically showed that among serum lipids the persistently elevated TG and low serum levels of HDL-C will make individuals more susceptible to develop T2DM in future. Our study results by using an advanced statistical approach highlighted the importance of changes in key risk factors for predicting incidence of T2DM in future and clinicians should consider the trajectories of lipid indices and FBS instead of focusing on a one-time assessment of theses markers. Identification and treatment of prediabetic individuals is crucial. Preventing progression of prediabetes to diabetes is possible through lifestyle modification by adopting healthy diets and sufficient physical activity, these approaches can help the body weight reduction and normalizing the lipids and glycemic indices as important risk factors and can prevent or delay the onset of T2DM among prediabetic high-risk population.
Disclosure statement
No potential conflict of interest was reported by the author(s).
Additional information
Notes on contributors
Awat Feizi
Awat Feizi is professor of Biostatistics at Department Biostatistics and Epidemiology, school of health.
Fahimeh Haghighatdoost
Fahimeh Haghighatdoost is assistant professor of Nutrition at Isfahan Cardiovascular Research Center, Cardiovascular Research Institute.
Parisa Zakeri
Parisa Zakeri is master of science in Biostatistics.
Ashraf Aminorroaya
Ashraf Aminorroaya is full professor of Endocrine and metabolism at Endocrinology and Metabolism Research Center, School of Medicine.
Masoud Amini
Masoud Amini is full professor of Endocrine and metabolism at Endocrinology and Metabolism Research Center, School of Medicine.
References
- https://www.who.int/news-room/fact-sheets/detail/diabetes. Available 2020 Jan 13.
- Belete B, Biadgo B, Abebe SM, et al. Correlation between serum lipid profile with anthropometric and clinical variables in patients with type 2 diabetes mellitus. Ethiop J Health Sci. 2017;27(3):215–226.
- Joshi SR, Anjana RM, Deepa M, et al. Prevalence of dyslipidemia in urban and rural India: the ICMR-INDIAB study. PloS One. 2014;9(5):e96808.
- Tomkin GH, Owens D. Diabetes and dyslipidemia: characterizing lipoprotein metabolism. Diabetes Metab Syndr Obes. 2017;10:333–343.
- Parhofer KG. Interaction between Glucose and Lipid Metabolism: more than Diabetic Dyslipidemia. Diabetes Metab J. 2015;39(5):353–362.
- Oh YS, Bae GD, Baek DJ, et al. Fatty acid-induced lipotoxicity in pancreatic beta cells during development of type 2 diabetes. Front Endocrinol. 2018;9:384.
- Inaishi J, Saisho Y. Beta-cell mass in obesity and type 2 diabetes, and its relation to pancreas fat: a mini-review. Nutrients. 2020;12(12):1–16.
- Haile K, Timerga A. Dyslipidemia and Its Associated Risk Factors Among Adult Type-2 Diabetic Patients at Jimma University Medical Center, Jimma, Southwest Ethiopia. Diabetes Metab Syndr Obes. 2020;13:4589–4597.
- Amini M, Janghorbani M. Diabetes and impaired glucose regulation in first-degree relatives of patients with type 2 diabetes in Isfahan, Iran: prevalence and risk factors. The Review of Diabetic Studies: RDS. 2007;4(3):169–176.
- Safari S, Amini M, Aminorroaya A, et al. Patterns of changes in serum lipid profiles in prediabetic subjects: results from a 16-year prospective cohort study among first-degree relatives of type 2 diabetic patients. Lipids Health Dis. 2020;19(193). DOI:10.1186/s12944-020-01371-y.
- Rhee E-J, Han K, S-h K, et al. Increased risk for diabetes development in subjects with large variation in total cholesterol levels in 2,827,950 Koreans: a nationwide population-based study. PLoS ONE. 2017;12(5):e0176615.
- Lee S-H, Kim H-S, Park Y-M, et al. HDL-Cholesterol, Its Variability, and the Risk of Diabetes: a Nationwide Population-Based Study. J Clin Endocrinol Metab. 2019 November;104(11):5633–5641.
- International Diabetes Federation. (2019). IDF Diabetes Atlas. 9th Edition.
- Friedewald WT, Levy RI, Fredrickson DS. Estimation of the concentration of low-density lipoprotein cholesterol in plasma, without use of the preparative ultracentrifuge. Clin Chem. 1972;18(6):499–502.
- Expert Panel on Detection EJJ. Executive summary of the third report of the National Cholesterol Education Program (NCEP) expert panel on detection, evaluation, and treatment of high blood cholesterol in adults (Adult Treatment Panel III). JAMA. 285(19)2486 2001.
- World Health Organization %J Nutrition Unit document EIN. Measuring obesity—classification and description of anthropometric data. Report on a WHO consultation of the epidemiology of obesity. Warsaw 1987 Oct 21-23. Copenhagen: WHO, 1989. 1987;123.
- Bartolucci F, Farcomeni A, Pennoni F. Latent Markov models for longitudinal data. New York,USA: CRC Press; 2012.
- van de Schoot R, Sijbrandij M, Winter SD, et al. The GRoLTS-checklist: guidelines for reporting on latent trajectory studies. Struct Equ Model Multidiscip J. 2017;24(3):451–467.
- Habiba NM, Fulda KG, Basha R, et al. Correlation of lipid profile and risk of developing type 2 diabetes mellitus in 10–14 year old children. Cell Physiol Biochem. 2016;39(5):1695–1704.
- Zheng D, Li H, Ai F, et al. Association between the triglyceride to high-density lipoprotein cholesterol ratio and the risk of type 2 diabetes mellitus among Chinese elderly: the Beijing Longitudinal Study of Aging. BMJ Open Diabetes Res Care. 2020;8(1):e000811.
- Safari S, Amini M, Aminorroaya A, et al. Patterns of changes in fasting plasma glucose, hemoglobin A1c and the area under the curve during oral glucose tolerance tests in prediabetic subjects: results from a 16-year prospective cohort study among first-degree relatives of type 2 diabetic patients. Acta Diabetol. 2021;58(3):371–381.
- Drew BG, Rye K-A, Duffy SJ, et al. The emerging role of HDL in glucose metabolism. Nat Rev Endocrinol. 2012;8(4):237.
- Barter PJ, Rye K-A, Tardif J-C, et al. Effect of torcetrapib on glucose, insulin, and hemoglobin A1c in subjects in the Investigation of Lipid Level Management to Understand its Impact in Atherosclerotic Events (ILLUMINATE) trial. Circulation. 2011;124(5):555–562.
- Drew BG, Duffy SJ, Formosa MF, et al. High-density lipoprotein modulates glucose metabolism in patients with type 2 diabetes mellitus. Circulation. 2009;119(15):2103.
- Rashid S, Watanabe T, Sakaue T, et al. Mechanisms of HDL lowering in insulin resistant, hypertriglyceridemic states: the combined effect of HDL triglyceride enrichment and elevated hepatic lipase activity. Clin Biochem. 2003;36(6):421–429.
- Lehti M, Donelan E, Abplanalp W, et al. High-density lipoprotein maintains skeletal muscle function by modulating cellular respiration in mice. Circulation. 2013;128(22):2364–2371.
- Mortensen SP, Boushel R. High-density lipoprotein: a new therapeutic target for glucose intolerance? Circulation. 2013;128:2349–2350.
- Reaven G. Metabolic syndrome: pathophysiology and implications for management of cardiovascular disease. Circulation. 2002;106(3):286–288.