
ABSTRACT
Background
Nutrition is the most important environmental factor in the development and progression of childhood obesity, which is very common in Arabic countries.
Aim
Study of associated factors and nutritional status of childhood obesity.
Methods
This was a comparative study of 50 obese children recruited from the outpatient department of the children’s hospital, as well as 35 controls. The two groups were matched for gender and age. Anthropometric measurements have been undertaken. A food history as well as a frequency of consumption of certain foods were performed.
Results
There were 32 girls in obese group. Breastfeeding was more common in the control group (p = 0.04) but gestational diabetes, pregnancy weight gain, and macrosomia were greater in obese people (p = 0.002; 0.0001 and 0.004) . Food diversification was early in the obese (p = 0.05). Mobile phone use was higher among obese people (p = 0.001) but time spent watching TV was not significant (p = 0.06). There was no significant difference between the two groups regarding: the number of hours of sleep, and the practice of sport. Sedentary lifestyle concerned 34% of obese versus 8.57% controls. Intense physical activity was practiced by 14.29% of the controls against any obese (p = 0.0001). The anthropometric parameters of the parents of the obese were more important than those of the controls. The average BMI of the obese was 25.63 Kg/m2.The frequency of consumption showed a more caloric and fat diet in obese group.The diet of the controls was richer in proteins and lipids but better distributed in MUFA and PUFA, but the energy intake of the obese was significantly higher (10,612 versus 4097 Kcal/d). The mineral and vitamin intakes of the obese were correct.
Conclusions
The fight against childhood obesity essentially involves prevention and promotion of a good lifestyle.
1. Introduction
Obesity is defined as an increase in body fat, or adipose tissue [Citation1]. This is a chronic disease that must be treated so that it does not cause other metabolic complications.
According to the World Health Organization, 39 million children under the age of 5 were overweight or obese in 2020 [Citation1].
If the current trend continues, the number of overweight young children could reach 70 million by 2025 [Citation2].
In Tunisia, the finding is alarming, in Monastir in 2011 the prevalence of overweight among children aged 4 to 6 was 11.6% and that of obesity 9.1% [Citation3].
The survey organized by the National Institute of Public Health in the governorate of Ben Arous in 2006, among 2,600 students showed that the prevalence of overweight was 5.7% in boys and 8.7% in girls [Citation4].
The origin of childhood obesity is multifactorial linked to genetic (macrosmia at birth, weight gain during mother’s pregnancy, familial history of obesity)and environmental factors, foremost among which are poor eating habits and a sedentary lifestyle [Citation5].
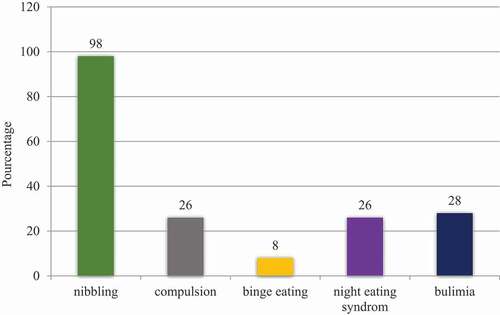
Eating disorders are very common in adults with obesity such as: nibbling (the consumption of multiple smaller meals per day), compulsion (an irresistible persistent impulse to eat), binge eating (an eating disorder in which a person regularly eats unusually large amounts of food.), night eating syndrome (eating a large amounts of food after the evening meal, often waking up during the night to eat) and bulimia (a loss of control over the eating) but these disorders are not described well in children [Citation6].
1.1. Our work aimed to
1. Identify the nutritional and environmental factors of childhood obesity by comparing a group of obese children to a group of control children.
2. Study the anthropometric profile and eating disorders of obese children.
1.2. Methods
This is a comparative study involving 50 obese children, recruited at the outpatient department of the “Béchir Hamza” children’s hospital, from December, 2016 to February, 2017, as well as 35 control children with normal weight. Both groups were randomly recruited at the same time and in the same place. The two groups (patients and controls) were matched for age and sex.
We included obese children aged between 6 and 13 in our study. Obesity was defined by the French reference curves.
We didn’t recruit children taking long-term corticosteroids, those followed for renal failure, nephrotic syndrome, diabetes, hypothyroidism, chronic diarrhea or any other endocrinopathies.
The degree of physical activity evaluated according to the validated AQAP questionnaire [Citation7]. We have asked parents about the duration of sleep of their children and a number of hours of sleep <10 h/d was considered insufficient [Citation8].
For anthropometric parameters: the Weight gain was noticed using a scale: The patient standing, motionless, lightly clothed. Height measurement using a height rod: The patient is standing with his feet flat with his heels touching the plate of the rod. The distance from the bottom of the feet to the top of the head is considered to be the height. The BMI was calculated and has been reported on the growth curve. Waist circumference was Taken halfway between the anterosuperior iliac spine and the costal margin on the mid-axillary line using a tape measure.
2. Food survey
A qualified dietitian made the food survey for both groups. An assessment of spontaneous food consumption based on a “24 hour recall” questionnaire coupled with eating habits and the composition of the main meals and snacks.
We used the CIQUAL Table (2013 version) from The French Agency for Food, Environmental and Occupational Health and Safety (ANSES) for the analysis of foods and their translation into nutrients.
Data entry from dietary surveys was carried out using the computer program “BILNUT, version 2.01–1990” in order to assess spontaneous nutritional intake.
2.1. Statistical analysis
Statistical analysis was performed using statistical software (SPSS 20) using the Chi-square test for the comparison of qualitative variables and the T-Student test for the comparison of quantitative ones. The results of the quantitative variables are given as the mean ± standard deviation (SD).
3. Results
Our population is composed of 32 girls and 18 boys in the obese group with 18 girls and 17 boys in the control group. The mean age of obeses was 8.93 ± 3.36 years and 8.03 ± 3.29 years for the control group. Both groups were matched for sex and age.
General characteristics of the population are present in .
Table 1. General characteristics of the population.
Table 2. Distribution of the population by age of food diversification.
Table 3. Parent’s and patient’s BMI.
None had an exclusively breastfeeding.
The average age of diversification for the obese was 5.11 months versus 5.8 months for the controls (p = 0,05). The obese children had a significantly earlier age of diversification than the controls with a minimum of 2 months for the obese and 3 months for the controls.
A normal diversification age at 6 months was noticed in 60% of the controls against 34% of the obese (p = 0.01). Obeses had early food diversification in 54% of cases (p = 0.009).
Class 2 was predominant in obese people compared to other classes.
Waist circumference was higher in obese group with 70% of them with waist circumference at +2 deviation standard.
We asked mothers about how they perceive the obesity of their children and we noticed that 48% of them perceive that their child has normal weight.
About the half (56%) of mothers controlled qualitatively and quantitatively the feeding of their children (considered as controlling parents). The rest gave to their children what they want when they want (indulgent parents).
On average, 60% of family meals (breakfast, lunch and dinner) took place in front of the TV for the obese versus 40% of the controls (p = 0.0001).
Attendance at fast food restaurants concerned 68% of obese people and 62.9% of controls with no statistically significant difference (p = 0.63).
The composition of meals showed more consumption of wight bread in the breakfast of obeses versus control group (94% vs 80%; p = 0.04).
Obeses drink more sweet drinks for lunch (84% vs 54.3%; p = 0.002).
For snacks, obeses eat more sweets (chocolate and candies) than control groups (76% vs 42.85%; p = 0.002) and more sandwiches (22% vs 5.7%; p = 0.04).
Almost all 98% of obese patients snacked every day. Nibbling also concerned the majority of controls but occasionally. The composition of nibbling was very different between groups.
Eating disorders are present in .
Figure 1. Eating disorders in obeses.
Food survey results are present in .
Table 4. Composition of nibbling.
Table 5. Food survey results.
The obese had a significantly higher calorie and carbohydrate intake than the controls. Indeed, the controls consumed more protein,PUFA and fibers.
4. Discussion
Our results show many differences between the two groups. These differences concern constitutional factors such as family history, pregnancy, parents’ weight, etc., but also environmental factors such as playing sports, eating habits or sedentary behavior.
Concerning the pregnancy of obese children, it was more often complicated by GDM.
The mechanism behind the relationship between gestational diabetes and subsequent childhood obesity may be linked to maternal glycemic dysregulation, which results in insulin dysfunction and high adiposity in the fetus [Citation9]. Newborns of pregnancies complicated by gestational diabetes are exposed to high concentrations of amniotic insulin [Citation10]. In addition, an elevated C peptide in cord blood, indicating abnormal insulin tolerance in the uterus, has been associated with increased adiposity at birth and obesity later in life [Citation10,Citation11]. Excessive adiposity (regardless of birth weight) due to increased maternal blood sugar appears to be a key factor in obesity in children of pregnancies complicated by gestational diabetes [Citation12,Citation13]. similarly we noted a significant relationship with weight gain during pregnancy. Our results have been confirmed by other studies [Citation14]. Indeed, Shao’s study showed that excess weight gain during pregnancy was a risk factor for childhood obesity [Citation15]. This maternal weight gain leads to an increase in the fat mass of the future offspring which will persist during their growth [Citation16]. The control group was more breastfed than the obese group (94.3% vs 80% p = 0.04).
Breast-fed infants have different weight growth in the first year and weigh on average 600 g less by the age of one year than infants given infant formula [Citation17]. A meta-analysis of Arenz, after adjusting for confounding factors, showed that breastfed infants had a 22% reduction in the risk of obesity compared to infants fed formula [Citation18].
The hours spent in front of the television were comparable between the 2 groups but it was the use of mobile phones that was more important among the obese.
According to the American Academy of Pediatrics, which investigated the use of screen devices in children, there was confirmation of our results [Citation19]. As a result, mobile phones are currently the target of obesity prevention campaigns with very promising results [Citation14,Citation20–22]. The time spent sitting and playing on the cell phone favors a sedentary lifestyle which leads to an increase in weight gain in children. and this is why the phones themselves are currently an integral part of the treatment of childhood obesity with a lot of applications that have emerged to promote physical activity and a healthy lifestyle.
Our results showed that half of the mothers were unaware that their children were obese. For parents, realizing their child’s obesity is a complex process. Parents most often underestimate their child’s weight, or minimize overweight [Citation23]. In some cultures, criteria for obesity may be questioned [Citation24–26].
Half (56%) of mothers qualitatively and quantitatively controlled the feeding of their children.
Mothers who did not deprive their children gave them the dishes they wanted without adjusting the proportions.
Parents play a pivotal role in terms of food intake and preferences. The role of the educational framework has been shown in particular in the ability of the baby and then the child to adjust their food energy intake to their needs [Citation27]. The baby seems to have a good capacity for this adjustment until the age of 1 year, then this capacity decreases [Citation28]. Studies have shown that certain educational behaviors influence this self-adjustment: those which aim to reinforce the external signals of consumption rather than the internal signals of hunger and satiety will accentuate this deregulation. These are, for example, portion size, the pressure that some parents may exert (“finish your plate”), the use of food as a reward, requests for consumption (family offer) .
Conversely, too much restriction can have the same effect [Citation25]Certain practices such as excessive dietary control over the quality and quantity of what a child eats can contribute to the development of overweight in children.
A review of the literature from 26 studies concluded that dietary restriction in children has frequently and consistently been associated with weight gain and that there is a causal relationship between parental restriction and overweight in children. child [Citation29]. Another review of the literature assessed parental influence on the development of infant feeding behavior. The results show a correlation between parents and children with regard to nutritional behaviors such as food intake. Although the data are conflicting, studies show that parental eating disorders are associated with eating disorders and obesity in children [Citation30,Citation31].
Concerning eating behavior, we note a significant proportion of snacking in obese people. Sometimes snacking can fill an emotional void or become “an essential” linked to certain events of the day: such as going to school with full pockets, falling asleep with a bottle of juice watching television while eating at the same time [Citation32].
We notice that the obese have a higher carbohydrate intake than the controls. However, qualitatively, carbohydrates in obese people are provided by the consumption of sweets and sugary drinks. These results are confirmed by Ben Slema [Citation33] who showed that the consumption of sweet drinks during meals and sugary foods is correlated with overweight children and an Algerian study by Hayet Oulamara et al [Citation34] who has also proven that the carbohydrate intake of obese people is in the form of sugar and sweets and not through starches, grains and legumes.
In our study, the average fat intake in obese children was similar to that of controls. The high fat diet is not a major contributor to childhood obesity. Indeed, the clear increase in the prevalence of overweight and obesity was not accompanied by a significant increase in lipid consumption but was accompanied by an increased sedentary lifestyle according to Ailhaud and Davis [Citation35,Citation36]. Nevertheless, in terms of lipid quality, PUFAs were statistically more consumed by witnesses than obese people. In the witnesses, PUFA intake was provided by foods rich in PUFAs from the omega 3 family (blue fish, mainly sardines), unlike the obese. This has been confirmed by several studies which have shown that an intake of omega 3 family PUFA plays a role in the prevention of obesity [Citation37].
The controls had a diet richer in fiber. It is well established that fiber chewing is slower, energy intake is lower, and feelings of fullness appear more quickly [Citation38].
Our study has certain limitations: a small sample, a retrospective study, biological assays have not been carried out, such as the glycemic and lipid profile, likewise the deficiencies in the supply of certain micronutrients have not been confirmed by the tests and the respondents’ responses can sometimes be unreliable due to oversight or inaccuracy.
5. Conclusion
Preventing childhood obesity is becoming a public health priority in order to stop the increase in this scourge. To achieve this, it is necessary to put in place:
• A screening strategy based on regular monitoring of the child’s BMI
• Nutritional education for children, parents and teachers.
• Promotion of physical activity and reduction of the time spent on television and video games.
• Nationally, the implementation of national obesity control programs.
Disclosure statement
No potential conflict of interest was reported by the author(s).
References
- Obesity and overweight. [Cited 2021 Dec 23]. https://www.who.int/news-room/fact-sheets/detail/obesity-and-overweight
- Abdelkafi Koubaa A, Younes K, Gabsi Z, et al. Risk factors of children overweight and obesity. Tunis Med. 2012;90(5):387–393.
- Regaieg S, Charfi N, Trabelsi L, et al. Prévalence et facteurs de risque du surpoids et de l’obésité dans une population d’enfants scolarisés en milieu urbain à Sfax, Tunisie. Pan Afr Med J. 2014;17(1). DOI:10.4314/pamj.v17i1
- Ben Slama F, Achour N. Mise au point : l’obésité de l’enfant en Tunisie et dans le Monde [Focus: Childhood obesity in Tunisia and in the World]. Ordre National des Médecins de Tunisie, 2007 (Disponible en ligne http://www.ordre-medecins.org.tn/article.php?id_article=325, consulté le 13 mars 2012).
- Weihrauch-Blüher S, Wiegand S. Risk Factors and Implications of Childhood Obesity. Curr Obes Rep. 2018;7(4):254–259.
- Mairs R, Nicholls D. Assessment and treatment of eating disorders in children and adolescents. Arch Dis Child. 2016;101(12):1168–1175.
- Vol S, Bedouet M, Gusto G, et al. Evaluating physical activity: the AQAP questionnaire and its interpretation software. Ann Phys Rehabil Med. 2011;54(8):478–495.
- Fredriks AM, van Buuren S, Fekkes M, et al. Are age references for waist circumference, Hip circumference and waist-Hip ratio in Dutch children useful in clinical practice? Eur J Pediatr. 2005;164(4):216–222.
- Shearrer GE, Whaley SE, Miller SJ, et al. Association of gestational diabetes and breastfeeding on obesity prevalence in predominately Hispanic low-income youth. Pediatr Obes. 2015;10(3):165–171.
- Silverman BL, Rizzo TA, Cho NH, et al. Long-term effects of the intrauterine environment. The northwestern university diabetes in pregnancy center. Diabetes Care. 1998;21 Suppl 2:B142–149.
- Group HSCR. Hyperglycemia and adverse pregnancy outcome (HAPO) study: associations with neonatal anthropometrics. Diabetes. 2009;58:453–459.
- Catalano PM, Thomas A, Huston-Presley L, et al. Increased fetal adiposity: a very sensitive marker of abnormal in utero development. Am J Obstet Gynecol. 2003;189:1698–1704.
- Chandler-Laney PC, Bush NC, Rouse DJ, et al. Gut hormone activity of children born to women with and without gestational diabetes. Pediatr Obes. 2014;9(1):53–62.
- Pretlow RA, Stock CM, Allison S, et al. Treatment of child/adolescent obesity using the addiction model: a smartphone app pilot study. Child Obes Print. 2015;11(3):248–259.
- Shao T, Tao H, Ni L, et al. Maternal pre-pregnancy body mass index and gestational weight gain with preschool children’s overweight and obesity. Zhonghua Yu Fang Yi Xue Za Zhi. 2016;50(2):123–128.
- Castillo H, Santos IS, Matijasevich A. Relationship between maternal pre-pregnancy body mass index, gestational weight gain and childhood fatness at 6-7 years by air displacement plethysmography. Matern Child Nutr. 2015;11(4):606–617.
- Dewey KG, Heinig MJ, Nommsen LA, et al. Growth of breast-fed and formula-fed infants from 0 to 18 months: the DARLING Study. Pediatrics. 1992;89(6 Pt 1):1035–1041.
- Arenz S, Rückerl R, Koletzko B, et al. Breast-feeding and childhood obesity–a systematic review. Int J Obes Relat Metab Disord J Int Assoc Study Obes. 2004;28(10):1247–1256.
- L’étude qui va vous dissuader d’exposer vos enfants aux écrans. L’Obs. [Cited 2017 May 9]. http://tempsreel.nouvelobs.com/sante/20161025.OBS0300/l-etude-qui-va-vous-dissuader-d-exposer-vos-enfants-aux-ecrans.html
- Wearing JR, Nollen N, Befort C, et al. iPhone app adherence to expert-recommended guidelines for pediatric obesity prevention. Child Obes Print. 2014;10(2):132–144.
- Sharifi M, Dryden EM, Horan CM, et al. Leveraging text messaging and mobile technology to support pediatric obesity-related behavior change: a qualitative study using parent focus groups and interviews. J Med Internet Res. 2013;15(12):e272.
- Price S, Ferisin S, Sharifi M, et al. Development and implementation of an interactive text messaging campaign to support behavior change in a childhood obesity randomized controlled trial. J Health Commun. 2015;20(7):843–850.
- Grigioni S, Garcia F-D, Déchelotte P. Sémiologie et classification des troubles du comportement alimentaire: eating disorders: semiology and classification. Médecine Mal Métaboliques. 2012;6(2):125–130.
- Bion A, Cascales T, Dubedout S, et al. Troubles du comportement alimentaire restrictif du nourrisson et du jeune enfant: évaluation quantitative des interactions parent/nourrisson pendant le repas. L’Encéphale. 2018;44(1):32–39.
- Dubedout S, Cascales T, Mas E, et al. Troubles du comportement alimentaire restrictifs du nourrisson et du jeune enfant: situations à risque et facteurs favorisants. Arch Pédiatrie. 2016;23(6):570–576.
- Le Heuzey M-F, Turberg-Romain C, Lelièvre B. Comportement alimentaire des nourrissons et jeunes enfants de 0 à 36 mois: comparaison des habitudes des mères. Arch Pédiatrie. 2007;14(11):1379–1388.
- Dobbins M, Husson H, DeCorby K, et al. School‐based physical activity programs for promoting physical activity and fitness in children and adolescents aged 6 to 18. Cochrane Database Syst Rev. 2013;2. DOI:10.1002/14651858.CD007651.pub2.
- Le Heuzey M-F. La prévention des troubles du comportement alimentaire du jeune enfant est-elle possible ? J Pédiatrie Puériculture. 2006;19(7):261–264.
- Hurley KM, Cross MB, Hughes SO. A systematic review of responsive feeding and child obesity in high-income countries123. J Nutr. 2011;141(3):495–501.
- Hayes JF, Fitzsimmons-Craft EE, Karam AM, et al. Disordered eating attitudes and behaviors in youth with overweight and obesity: implications for treatment. Curr Obes Rep. 2018;7(3):235–246.
- Martini MG, Barona-Martinez M, Micali N. Eating disorders mothers and their children: a systematic review of the literature. Arch Womens Ment Health. 2020;23(4):449–467.
- Seo D-C, King MH, Kim N, et al. Predictors for persistent overweight, deteriorated weight status, and improved weight status during 18 months in a school-based longitudinal cohort. Am J Health Promot AJHP. 2015;30(1):22–27.
- Ben Slama F, Ayari I, Ouzini F, et al. Exclusive breastfeeding and mixed feeding: knowledge, attitudes and practices of primiparous mothers. East Mediterr Health J Rev Sante Mediterr Orient. 2010;16(6):630–635. Al-Majallah Al-Sihhiyah Li-Sharq Al-Mutawassit.
- Oulamara H, Agli AN, Frelut M-L. Alimentation, activité physique et surpoids chez des enfants de l’est Algérien. Cah Nutr Diététique. 2006;41(1):46–54.
- Ailhaud G. Acides gras polyinsaturés alimentaires et risque d’obésité de l’enfant. Nutr Clin Métabolisme. 2005;19(3):135–137.
- Davis MM, Gance-Cleveland B, Hassink S, et al. Recommendations for prevention of childhood obesity. Pediatrics. 2007;120(4):S229–253.
- Les lipides alimentaires. J Pédiatrie Puériculture. 2006;19(3):138–143. https://www.em-consulte.com/article/47131/article/les-lipides-alimentaires
- De Vadder F, Goncalves D, Vinera J, et al. PO23 Les acides gras à courte chaîne et les fibres alimentaires solubles améliorent l’homéostasie glucidique via une induction de la néoglucogenèse intestinale. Diabetes Metab. 2013;39:A26.