
 ?Mathematical formulae have been encoded as MathML and are displayed in this HTML version using MathJax in order to improve their display. Uncheck the box to turn MathJax off. This feature requires Javascript. Click on a formula to zoom.
ABSTRACT
Background: Failure of endogenous antioxidant system to eliminate high levels of ROS results to oxidative stress, consequently leading to liver damage. Excessive alcohol consumption leads to liver damage due to ROS generation, thus regarded as the leading causes of death worldwide, suggesting great need for use of exogenous antioxidants like epigallocatechin-3-gallate (EGCG), to avert liver damage. However, underlying EGCG mechanisms remains elusive.Aim of the work: This study focused on mechanistic role of EGCG in regulation of antioxidant marker activities during ethanol induced liver damage.Materials and Methods: 20 male Swiss Albino mice were divided into four groups and treated with different dosage. ALT, AST and total proteins were determined as indicators of liver damage. MDA and protein carbonyls were measured as oxidative stress markers. Activities of SOD and CAT were determined. SOD-2 and CAT differential gene expression were also determined. Liver histology analysis by H&E staining. All the experiments were run in duplicates. ANOVA was used to analyzes data using Tukey’s multiple comparison tests and results considered statistically significant if p ≤ 0.05 at 95% confidence level. Results: Findings revealed that chronic consumption of ethanol leads to liver damage through increased levels of serum ALT and AST, MDA, protein carbonyls and remarkable diffuse lipid droplets and decreased enzyme activity of SOD and CAT. EGCG increased activity of SOD and CAT and SOD-2 expression and did not affect CAT expression. Conclusion: In summary, ethanol induces liver damage, and administration of EGCG increases antioxidant system expression, suggesting its role in regulating their activities, defensive of oxidative stress through various pathways.
1. Introduction
Oxidative stress, which is considered the most important pathogenic event in liver damage, leading to liver diseases [Citation1]. This could be due to uncontrolled production of reactive oxygen species (ROS), particularly when endogenous antioxidant system fails to eliminate ROS [Citation2]. Risk factors like excessive ethanol consumption and environmental pollutants can induce oxidative stress in liver [Citation3]. Excessive consumption and metabolism of ethanol by hepatocytes leads to overproduction of ROS which oxidize biomolecules like proteins, lipids and DNA [Citation4] and this results into liver damage, and hence alcohol liver diseases like alcoholic hepatitis, steatosis, steatohepatitis, and cirrhosis may occur [Citation3]. Under physiological conditions, enzymatic antioxidants like superoxide dismutase (SOD) and catalase (CAT) are the first defense mechanisms to eliminate ROS [Citation5]. SOD catalyzes the formation of hydrogen peroxide from super-peroxide radical while CAT catalyzes the decomposition of hydrogen peroxide into water and oxygen [Citation2]. It has been reported that SOD and CAT activities are reduced during prolonged oxidative stress resulting into failure to eliminate ROS [Citation6]. In such situations, the endogenous antioxidant system of the liver fails to neutralize very high levels of ROS, necessitating the use of exogenous antioxidants to prevent oxidative stress induced liver damage. Epigallocatechin-3-gallate (EGCG) is one of the exogenous antioxidants which has gained a lot of importance because of its medicinal properties. Several experimental studies have shown that EGCG could prevent oxidative stress-induced liver damage through free radical scavenging and chelating transitional metal ions mechanisms [Citation7]. It is also reported that EGCG increases the activity of antioxidant enzymes when it is used to prevent oxidative stress-induced liver damage [Citation3,Citation6]. However, the mechanism by which EGCG increases the activity of antioxidant enzymes is poorly understood. One probable mechanism is that EGCG could indirectly regulate the gene expression of enzymatic antioxidants [Citation8]. In this view, therefore the current work aimed at finding out the role of EGCG in regulation of activities of antioxidant markers in ethanol induced liver damage.
2. Materials and methods
2.1. Study design
A total of 20 male Swiss Albino mice were divided randomly into four groups, of 5 mice each. The control group received 200 µl of double distilled water, Group II received 6.5 mg/kg of EGCG in 180 µl of water, Group III received 180 µl of 50% V/V of Ethanol and Group IV received 6.5 mg/kg of EGCG contained in 180 µl of double distilled after which it received 180 µl of 50% Ethanol after one hour. All the animals received these fluids orally, daily for a period of 35 days. They also received food and water adlib and were kept in cages under standard conditions of a 12 h/12 h light/dark cycle at room temperature with free access to food and water at KIU-WC Animal House.
2.2. Sample size determination
The sample size 20 mice was determined using Resource Equation method [Citation9] that states:- E = Total number of animals- Total number of groups; where E is the degree of freedom of analysis of variance (ANOVA). The value E determined was 16 which lay between 10 and 20.
2.3. Induction of oxidative stress
The mice were given 180 µl ml of 50% (V/V) ethanol orally daily for 35 days. After 35 days, were given ether anesthesia and cardiac puncture was performed and blood collected to prepare serum for further analyses. The activities of ALT, AST and total serum protein were assessed as indicators of liver damage. The liver was extracted out and divided into three pieces. One piece was used to prepare a 10% liver homogenate (described in Section 2.4.1), used to determine the levels of MDA and protein carbonyls which are indicators of oxidative stress in the liver and the activities of antioxidant enzymes at Institute of Biomedical Research Laboratory of Kampala International University. The remainder liver pieces were transferred to Molecular Biology Laboratory at College of Veterinary Medicine, Animal Resource and Biosecurity (COVAB), Makerere University for histological examination and analysis of differential expression of antioxidant genes.
2.4. Measurement of oxidative stress markers
2.4.1. Preparation of the Liver homogenate
After 35 days, all animals were given light Ether anesthesia, abdomen was excised and liver removed immediately and was used to prepare the homogenate. A 10% liver homogenate was prepared as described by Szlezak and colleagues [Citation10]. Briefly, 100 mg of liver tissue was ground in a mortar with a pestle under cold conditions. Nine hundred microliters of cold buffer (0.1 M Potassium Phosphate; pH 7.5) was added and the homogenate centrifuged at 10, 000 g for 15 min. The supernatant was transferred to a new tube (this now referred to as the cleared liver homogenate) and used for the MDA, protein carbonyls and antioxidant enzyme assays.
2.4.2. Measurement of the levels of MDA
MDA is one of the end-product of oxidation of lipids by ROS that reacts with thiobarbituric acid (TBA) to produce a pink colored complex which has peak absorbance at 532 nm. The levels of liver MDA in the clear liver homogenate were determined by the method described by Prabhakar and colleagues [Citation11]. A spectrophotometer was used to determine the absorbance of the pink tinted extract in n-butanol at 532 nm. The amount of MDA was calculated using a molar extinction coefficient of 1.56 × 10⁵ M−1 cm−1 and it was expressed as nmoles of MDA formed per gram weight of tissue.
2.4.3. Measurement of protein carbonyl content
The protein carbonyl content in the liver was determined by the method described by Levine and colleagues [Citation12]. The spectrophotometer was used to measure the absorbance at 390 nm. Protein carbonyl content was calculated from maximum absorbance (390 nm) using molar extinction coefficient of 22 mM−1 cm−1. Protein carbonyl content in the liver was expressed in nmol per mg of the protein.
2.5. Measurement of serum biomarkers of liver damage
Alanine transaminase (ALT) and Aspartate transaminase (AST) activities and total serum protein were used as biomarkers of liver damage in this study.
2.5.1. Measurement of serum ALT and AST activities
The activities of both serum ALT and AST from each group were determined spectrophotometrically using Cypress Diagnostics ALT assay kit following the manufacturer’s instructions. The formula: Serum ALT or AST activity (U/l) = Δ Abs./min x 1750 was used and the activity was expressed as U/l. One international unit (U) is defined as the amount of enzyme that transforms 1 µmol of the substrate per minute, in standard conditions.
2.5.2. Measurement of total serum protein
Each group’s total serum protein was measured using the Cypress Diagnostics Total Protein Assay Kit.
2.6. Histological examination of the liver
Each animal’s liver tissue was extracted and fixed in 10% formalin, after which it was embedded in paraffin and sliced into 5 µm thick slices and stained with H and E technique and examined under a light microscope at a magnification of X40 for observation of morphological changes.
2.7. Measurement of activities of hepatic antioxidant enzymes
2.7.1. Measurement of hepatic Superoxide dismutase (SOD) activity
The conversion of superoxide radical into Oxygen and Hydrogen peroxide is catalyzed by superoxide dismutase (SOD). The SOD activity was determined according [Citation13]. The assay was based on the capacity of SOD to inhibit autoxidation of epinephrine (adrenaline). 1 unit of SOD activity was defined as the amount of SOD necessary to cause 50% inhibition of the auto-oxidation of adrenaline to adrenochrome during 1 min.
2.7.2. Measurement of hepatic Catalase (CAT) activity
Catalase (CAT) catalyzes the conversion of hydrogen peroxide to water and oxygen. Catalase activity was determined using the method given by Cohen and colleagues [Citation14]. The assay was based on measuring the amount of hydrogen peroxide remained by reacting it with standard excess potassium permanganate (KMnO4) then measuring residual amount of KMnO4 spectrophotometrically. CAT activity was expressed as amount of CAT required to decompose 1 µmole of hydrogen peroxide per liter of the sample.
2.8. Effect of EGCG on the expression of antioxidant enzymes
2.8.1. Isolation of total RNA using trizol reagent
One milligram of liver tissue per sample previously stored at −80°C was put in a motor and crushed using a pestle. Immediately after crushing, 1000 µl of Trizol reagent was added to it (Invitrogen, ThermoFisher Scientific). Total RNA was isolated from each tissue homogenate (1000 µl) by adding 200 l of chloroform to a 1.5 ml microfuge tube. The samples were vortexed for 15 seconds, incubated for 3 minutes at room temperature. The samples were centrifuged for 15 minutes at 12,000 g at 4°C, and aqueous phase containing Total RNA transferred to fresh tubes. This was precipitated by mixing the aqueous phase with 500 µl Isopropyl alcohol and incubating for 10 minutes. After centrifugation at 12,000 g for 10 minutes at 4°C, Total RNA pellets were washed with 1000 µl of 75% ethanol and centrifuged at 7, 500 g for 5 minutes at 4°C. The pellets were air dried for about 20 min and re-suspended in 30 µl nuclease-free water (Life Technologies, USA). DNA in the samples was digested using Deoxy-ribonuclease 1 Amplification Grade kit (Invitrogen Life Technologies, USA) following manufacturer’s instructions. The reaction mixture (10 µl) containing 10x DNase reaction buffer, DNase 1 Amp Grade (1 U/ µl), Nuclease free water and 1 µg of total RNA sample was set up in PCR tubes on ice. For 15 minutes, the mixture was incubated at room temperature. DNase 1 was inactivated in the reaction mixture by adding 1 µl of 25 mM EDTA solution and incubating at 65°C for 10 minutes. Nanodrop-2000C (Thermos Scientific, USA) was used to determine both purity and quantity of the isolated total RNA.
2.8.2. Real time reverse transcription
Total RNA in the sample was converted to cDNA using sensiFASTTM cDNA synthesis Kit (Celtic Molecular Diagnostics (Pty) Limited, South Africa). The SensiFASTTM SYBR® Hi-ROX one-step kit (Meridian Bioscience) was used to determine the effect of EGCG on SOD-2 and CAT expression. The primers for SOD-2 and CAT used are shown in .
Table 1. Primers used for amplification of antioxidant enzyme genes.
2.9. Data analysis
The numerical data was analyzed using one way analysis of variance (ANOVA) where by Tukey’s HSD multiple comparison test was used to compare mean of each group with the mean of every other group using Graph Pad Prism software version 8.0.2 and represented as mean ± SD. If p ≤ 0.05 at 95% confidence level, the results were considered statistically significant.
3. Results
3.1. Effect of EGCG on MDA and protein carbonyls
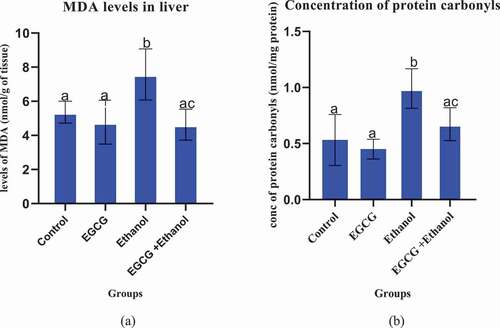
Chronic consumption of ethanol significantly elevated levels of oxidative stress markers in liver. Results indicate that chronic consumption of ethanol by mice for 35 days significantly increased levels of MDA (p = 0.0325) and protein carbonyls (p = 0.0026) (), respectively. However, EGCG administration one hour before consumption of alcohol significantly (p > 0.05) prevented the increase of these markers. There was no significant increase in the levels of MDA and protein carbonyls in the group that received EGCG alone when compared to the control.
Figure 1. Effect of EGCG on selected oxidative stress markers. (a): MDA levels, (b): Protein carbonyls. Results were analyzed using one way ANOVA and expressed as mean ± SD. In first level of comparison, Turkey’s multiple comparisons test was used to compare the mean of the control group with mean of every other group at confidence level of 95%. Bars with letter a were not statistically different against the control (p > 0.05). In second level of comparison using the same test, the mean of Ethanol group was compared with EGCG + Ethanol group. Bar with letter ac was statistically different against ethanol group (p < 0.05).
3.2. Effect of EGCG on ALT, AST and total proteins
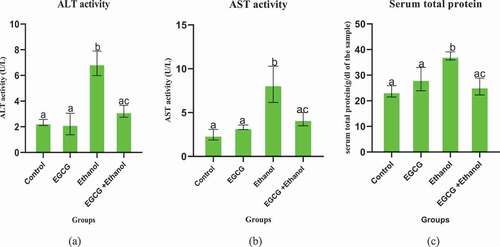
Chronic consumption of ethanol significantly elevated levels of serum ALT, AST and concentration of Total serum proteins compared to the control group () indicating possibility of liver damage. Results showed that daily administration of ethanol to mice for 35 days significantly increased the activities of ALT (p < 0.0001), AST ((p = 0.0001) and concentration of serum total protein (p = 0.0026) against the control group. However, administration of EGCG one hour before daily alcohol consumption for the same number of days, significantly (p < 0.05) prevented elevation of all the markers. The findings also indicate that, under physiological conditions, EGCG alone did not have a significant change in the activities of serum ALT (p = 0.9945), AST (p = 0.7112), and concentration of total serum protein (p = 0.1558).
Figure 2. Effect of EGCG on selected serum markers of ethanol induced liver damage in mice. (a): ALT, (b) AST, and (c) Total serum protein. Results were analyzed using one way ANOVA and expressed as mean ± SD. In the first level of comparison, Turkey’s multiple comparisons test compare the mean of control group with the mean of every other group at confidence level of 95%. All bars with letter a were not statistically different against the control (p > 0.05). In the second level of comparison using the same test at the same confidence level, the mean of Ethanol group was compared with the mean of EGCG + Ethanol group. Bar with letter ac is statistically different against ethanol group (p < 0.05).
3.3. Effect of EGCG on liver histopathology
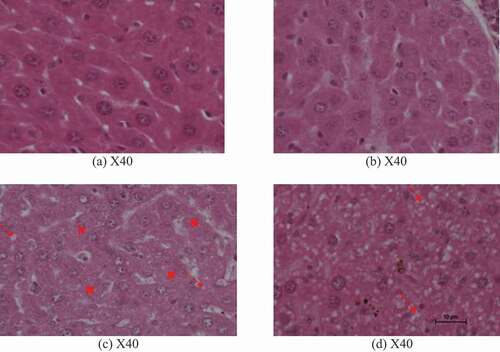
The micrographs from ethanol treated mice showed loss in normal liver cell architecture with remarkable diffuse spherical vacuoles of lipids as indicated by red arrows and random necrosis as indicated by letter N of . Administration of EGCG alone did not affect normal liver structure as shown in . However, daily administration of EGCG one hour before consumption of ethanol for 35 days maintained normal liver structure with tiny lipid droplets as indicated by red arrows in .
Figure 3. Histological micrographs for Control group (a), EGCG group (b), Ethanol induced group (c) and EGCG + Ethanol group (d). Magnification X40.
3.4. Effect of EGCG on superoxide dismutase and catalase enzymes
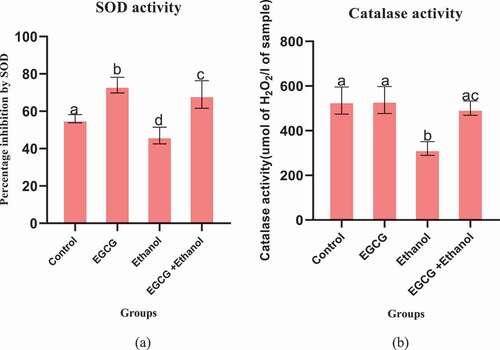
The findings of this study indicated that daily consumption of ethanol for 35 days by mice significantly reduced both activity of SOD (p = 0.0002) and activity of CAT (p = 0.0001) compared to the control group (). However, daily administration of EGCG one hour before ethanol consumption by mice for the same number of days significantly increased activity of CAT activity (p = 0.0001) and activity of SOD (p = 0.0001) compared to the ethanol treated mice (). The study further revealed that EGCG administration, under physiological conditions, significantly (p = 0.0037) increase SOD activity.
Figure 4. Effect of EGCG on activity of enzymatic antioxidant markers of ethanol induced liver damage. (a) SOD and (b): CAT. Results were analyzed using one way ANOVA and expressed as mean ± SD. In the first level of comparison using Turkey’s multiple comparisons test at confidence level of 95%, mean of the control group was compared with the mean of every group: All bars with letter a were not statistically different against the control (p > 0.05). In the second level of comparison, mean of ethanol group was compared against mean of EGCG + Ethanol group. Bar with letter ac was statistically different against ethanol treated mice (p < 0.05).
3.5. Effect of EGCG on the expression of superoxide dismutase and catalase genes
The effect of EGCG on expression of either liver SOD-2 and CAT gene during ethanol induced liver damage was determined using average threshold cycle (Ct) value. The study findings showed chronic consumption of ethanol by mice resulted into a slight increase in the decrease in SOD-2 expression (Ct value = 28.963) compared to that of control (Ct value = 28.789) though it was not statistically (p = 0.9722) significant. However, daily administration of EGCG one hour before consumption of ethanol for 35 days resulted into a significant (p < 0.0001) increase in SOD-2 expression (Ct value = 25.07) compared to that of ethanol treated mice (Ct value = 28.789) (). Administration of EGCG alone in absence of oxidative stress inducer (Ethanol) did not affect expression of SOD-2.
Figure 5. Effect of EGCG on expression of (a) SOD-2 and (b) CAT genes using 0.06 as baseline. Results were analyzed using one way ANOVA and expressed as mean ± SD. Turkey’s multiple comparisons test at confidence level of 95% was used to compare mean of each group with mean of every other group. Bars with different letters were statistically different (p < 0.05). Bars with the same letters are not statistically different (p < 0.05).
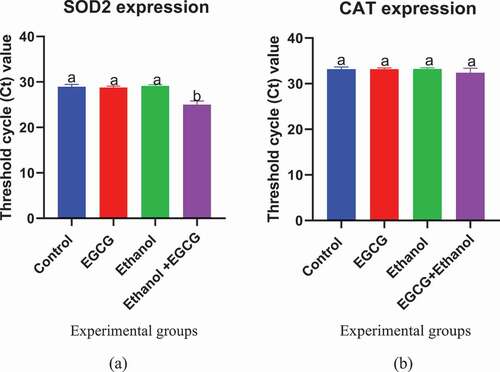
The study further revealed that chronic consumption of ethanol did not significantly (p = 0.9994) affect the expression of CAT (Ct value = 33.2264) compared to control (Ct value = 33.1845) as shown in . Daily administration of EGCG before consumption of ethanol by mice for 35 days also did not significantly (p = 0.1784) affect the expression of CAT (Ct value = 32.383) compared to ethanol group (Ct value = 33.2264). Administration of EGCG alone in absence of oxidative stress inducer (Ethanol) did not affect expression of CAT (Ct value = 33.1800) compared to the control group (Ct value = 33.1845) ().
4. Discussion
One of the major causes of liver damage is oxidative stress [Citation1], whereby there is over-production of ROS, and endogenous antioxidant system fails to eliminate high levels of ROS which in turn leads to cell death and eventually liver damage through oxidation of biomolecules like proteins and lipids. Ethanol is one of chemical substances that causes oxidative stress by generating ROS through its chronic consumption and metabolism. In this study, oxidative stress was induced by oral administration of ethanol to the mice for 35 days and the preventive effect of EGCG studied. It was found out that chronic consumption of ethanol by mice significantly increased the levels of both MDA and protein carbonyls compared to the control group, indicating that oxidative stress occurred. However, daily administration of EGCG one hour before consumption of ethanol by mice for the same number of days prevented accumulation of very unstable ROS as shown by significantly low levels of MDA and protein carbonyls compared to that of ethanol treated mice. These findings concur to studies by Zhao and colleagues [Citation3] who also reported significantly low levels of MDA and protein carbonyls. It’s apparent that oxidative stress damages cell membrane through oxidation of unsaturated fatty acids in the phospholipids bilayer affecting the integrity and functioning of cell membranes [Citation15], consequently leading to the leakage of metabolic enzymes such as ALT and AST and well as proteins into the serum. In this study, daily intake of ethanol by mice for 35 days significantly elevated levels of serum ALT (p = 0.0001), AST (p = 0.0001) and total serum protein (p < 0.0001) compared to the control group indicating damage to the cell membrane. These results were further supported by the histological analysis which confirmed liver damage by the evidence of remarkable diffuse lipid droplets and random necrosis. However, administration of EGCG one hour before consumption of ethanol significantly prevented the disruption of the hepatocyte cell membrane as shown by significantly lowering the levels of ALT, AST and total protein in serum relative to ethanol group, suggesting EGCG defensive of oxidation of plasma membrane proteins and lipids by ROS, thus maintaining the integrity of plasma membrane as alluded in the previous studies [Citation3].
Under physiological conditions SOD and CAT are endogenous antioxidant enzymes that eliminate ROS, thus preventing oxidative damage of cellular biomolecules. However, the activity of these enzymes has been shown to decrease due to prolonged exposure to oxidative stress [Citation16]. The findings herein indicated a significant decrease in activities of both SOD and CAT in mice that consumed alcohol compared to the control group and are in agreement [Citation3] who also reported a decrease in activities of the same enzymes after exposing rodents to ethanol. It is possible that over-production of superoxide radicals from chronic consumption and metabolism of ethanol reacted with nitrogen monoxide ion to form peroxynitrite that nitrated SOD leading to decrease in the activity of SOD compared to control [Citation17]. SOD activity is also regulated by either induction or repression [Citation18] and Kaep1/Nrf2/ARE signaling pathway, majorly involved in regulation of antioxidant enzymes [Citation19]. It has been reported that polyphenols including EGCG could modulate Kaep1/Nrf2/ARE signaling pathway leading to increased SOD-2 expression to prevent oxidative stress induced by ethanol [Citation20]. Therefore, EGCG increased activity of SOD by increasing SOD-2 gene expression. Whereas CAT activity is regulated by either induction or repression, this study showed that chronic consumption of ethanol by mice did not affect expression of CAT expression yet the enzyme activity significantly decreased compared to the control group, depicting that CAT activity is not regulated by either induction or repression during ethanol induced oxidative stress. Studies show that phosphorylation of CAT is a post-translational modification mechanism regulating CAT activity and it is dependent on ROS levels. It is evident that chronic consumption of ethanol resulted into production of uncontrolled levels of ROS, which could have led to dissociation of the c-Abl and Arg from phosphorylated CAT and the enzyme undergoes ubiquitination and proteasomal degradation resulting into decreased CAT activity [Citation21]. Additionally, reports show that activity of CAT is decreased during prolonged oxidative stress through dephosphorylation of CAT enzyme by phosphatases [Citation22]. Daily EGCG administration one hour before consumption of ethanol for 35 days also did not affect the expression of CAT yet the CAT activity increased. This could be due to effect of EGCG preventing ROS elevation, and in turn low levels of ROS stimulated phosphorylation of CAT by c-Abl and Arg tyrosine kinases resulting into increased CAT activity [Citation23].
5. Conclusion
In summary, the findings of this study showed that consumption of alcohol leads to liver damage caused by oxidative stress. However, administration of EGCG prevented elevation of oxidative markers by increasing both enzyme activity of CAT and SOD and SOD-2 expression, thereby controlling ROS levels that could potentially damage liver via various pathways.
Abbreviations
ALT: Alanine transaminase; AST: Aspartate transaminase; ARE: Antioxidant response element; ADH: Alcohol dehydrogenase; ANOVA; Analysis of variance; SOD: Superoxide dismutase; SOD-2: Superoxide dismutase 2; CAT: Catalase; Ct: Threshold value; DNA: Deoxyribonucleic acid; MDA: Malondialdehyde; H2O2: Hydrogen peroxide; ECGC: Epigallocatechin-3-gallate, TBA: Thiobarbituric acid; Keap1: Kelch-like ECH associated protein 1; KIU-WC: Kampala International Western Campus; Nrf2: Nuclear factor erythroid −2-related factor 2; TCA: Trichloroacetic acid; ROS: Reactive oxygen species; RNA: Ribonucleic acid
Availability of data and materials
Raw data and any form of data generated by this research can be obtained on request by an-email.
Ethical approval
Ethical approval number: RrUG-013/202,004 was granted by Research Ethics Committee for ethical review and approval, Kampala International University–Western Campus.
Limitations of the study
This study did not look at expression of SOD1 and SOD 3 yet they contribute to the activity of the total SOD activity determined. In order to understand how EGCG increases SOD activity, it is recommended that the activity of each of the three isoforms of SOD and their corresponding expression both at mRNA and protein level should be investigated.
Authors’ contribution
This work was carried out in collaboration among all authors. Dr Ondari Erick Nyakundi conceptualized, designed, edited and supervised this study. Mujinya Pastori, Mbumbya Jackie, Daniel Okumu, Kwizera Eliah, Kembabazi Stellamaris, Niwamanya Boaz, Dominic Swase, Solomon Mbina and Allan Wandera carried out all the laboratory experiments. Mujinya Pastori and Robert Siida conducted data analysis. All authors read and approved manuscript.
Additional information
All data as pertains to this article is presented here. Raw data will be provided upon request.
Acknowledgments
We are thankful to Molecular Biology Laboratory management at College of Veterinary Medicine, Animal Resource and Biosecurity for providing laboratory space. We are grateful to Mr Emmanuel Banzubaze for helping us with the primers used in this study. We are also grateful to Dr Alexandro Pingtore for inspiring us in research field.
Disclosure statement
No potential conflict of interest was reported by the author(s).
Correction Statement
This article has been corrected with minor changes. These changes do not impact the academic content of the article.
Additional information
Funding
Notes on contributors
Mujinya Pastori
Mujinya Pastori is an MSc student and teaching assistant at the Department of Biochemistry, Faculty of Biomedical Sciences, Kampala International University-Western Campus. Pastori’s research interests are in natural products and Molecular biochemistry.
Stellamaris Kembabazi
Stellamaris Kembambazi is a PhD student and assistant lecturer at the Department of Biochemistry, Faculty of Biomedical Sciences, Kampala International University-Western Campus. Jackie’s research interests are in nutritional biochemistry.
Wandera Allan
Wandera Allan is an MSc student and teaching assistant at the Department of Biochemistry, Faculty of Biomedical Sciences, Kampala International University-Western Campus. Wandera’s research interests are in plant biochemistry.
Robert Siida
Robert Siida is an MSc student and teaching assistant at the Department of Biochemistry, Faculty of Biomedical Sciences, Kampala International University-Western Campus. Siida’s research interests are in molecular biochemistry.
Mpumbya Jackie Rachael
Mpumbya Jackie Rachael is an MSc student and teaching assistant at the Department of Biochemistry, Faculty of Biomedical Sciences, Kampala International University-Western Campus. Jackie’s research interests are in nutritional biochemistry.
Solomon Adomi Mbina
Solomon Adomi Mbina is an MSc student and teaching assistant at the Department of Biochemistry, Faculty of Biomedical Sciences, Kampala International University-Western Campus. Solomon’s research interests are in plant biochemistry.
Daniel Okumu
Daniel Okumu is an undergraduate student at the Department of Biochemistry, Faculty of Biomedical Sciences, Kampala International University-Western Campus. Daniel’s research interests are in nutritional biochemistry.
Dominic Terkimbi Swase
Dominic Terkimbi Swase is an MSc student and teaching assistant at the Department of Biochemistry, Faculty of Biomedical Sciences, Kampala International University-Western Campus. His research interests are in molecular biochemistry.
Kimanje Kyobe Ronald
Kimanje Kyobe Ronald is a PhD student and assistant lecturer at the Department of Biochemistry, Faculty of Biomedical Sciences, Kampala International University-Western Campus. Jackie’s research interests are in plant biochemistry.
Kwizera Eliah
Kwizera Eliah is an MSc student and teaching assistant at the Department of Biochemistry, Faculty of Biomedical Sciences, Kampala International University-Western Campus. Eliah’s research interests are in nutritional biochemistry.
Niwamanya Boaz
Niwamanya Boaz is an MSc student and teaching assistant at the Department of Biochemistry, Faculty of Biomedical Sciences, Kampala International University-Western Campus. His research interests are in nutritional biochemistry.
Ondari Erick Nyakundi
Ondari Erick Nyakundi is a lecturer at the Department of Biochemistry, Faculty of Biomedical Sciences, Kampala International University-Western Campus and Kisii University, Department of Biological Sciences, School of Pure & Applied Sciences, Kenya. His research focus is on Nano-Biotechnology, Natural products, and Molecular physiology.
References
- Reyes-Gordillo K, Shah R, Muriel P. Oxidative stress and inflammation in hepatic diseases: current and future therapy. Oxid Med Cell Longev. 2017;(2017(2):2–4.
- Dayem AA, Hossain MK, Bin LS, et al. The role of Reactive Oxygen Species (ROS) in the biological activities of metallic nanoparticles. Int J Mol Sc. 2017;18(1):1–21.
- Zhao L, Zhang N, Yang D, et al. Protective effects of five structurally diverse flavonoid subgroups against chronic alcohol-induced hepatic damage in a mouse model. J Nutrients. 2018;10(1754):1–14.
- Teschke R. Alcoholic liver disease: alcohol metabolism, cascade of molecular mechanisms, cellular targets, and clinical aspects. J Biomed. 2018;6(106):1–57.
- Erdemli ME, Zayman E, Erdemli Z, et al. Protective effects of melatonin and vitamin E in acetamiprid-induced nephrotoxicity. Environ Sci Pollut Res. 2020;27(9):9202–9213.
- Mao X, Gu C, Chen D, et al. Oxidative stress-induced diseases and tea polyphenols. Imparct J. 2017;8(46):81649–81661.
- Zwolak I. Epigallocatechin Gallate Manage Heavy Metal-Induced Oxid Stress. Catalase is regulated by ubiquitination and proteosomal degradation. Role of the c-Abl and Arg tyrosine kinases. 2021;22(4027):2–24. https://doi.org/10.3390/ijms22084027
- Bernatoniene J, Kopustinskiene DM. The role of catechins in cellular responses to oxidative stress. J Mol. 2018;23(965):1–11.
- Ilyas MN, Adzim MKR SN, A. A. Sample size calculation for animal studies using degree of freedom (E); an easy and statistically defined approach for metabolomics and genetic research. Curr Trends Biomed Eng Biosci. 2017;10(2):1–2.
- Szlęzak D, Bronowicka-Adamska P, Hutsch T, et al. Hypertension and aging affect liver sulfur metabolism in rats. Cells. 2021;10(5):5.
- Prabhakar PV, Reddy UA, Singh SP, et al. Oxidative stress induced by aluminum oxide nanomaterials after acute oral treatment in Wistar rats. J Appl Toxicol. 2012;32(2012):436–445.
- Levine BRL, Garland D, Oliver CN, et al. Determination Carbonyl content in Oxidat Ively Modified Proteins. Methods in Enzymology. 1990;186(187):464–478.
- Fridovich MP, Hawa M. The role of superoxide anion in the autoxidation of Epinephrine and a simple assay for superoxide dismutase. J Biol Chem. 1972;247(10):3170–3175.
- Cohen G, Judith M, X- T. Measurement of catalase activity in tissue extracts. Anal Biochem. 1970;34(1):30–38. https://doi.org/10.1016/0003-2697(70)90083-7
- Wilson DF, Matschinsky FM. Ethanol metabolism: the good, the bad, and the ugly. Med Hypotheses. 2020;140(1096):1–22.
- Karimi-khouzani O, Heidarian E, Amini SA. oxidative stress and liver damage in rats. Pharmacol Rep. 2017;46(4):830–835.
- Moya EA, Arias P, Iturriaga R. Nitration of MnSOD in the carotid body and adrenal gland induced by chronic intermittent hypoxia. J Histochem Cytochem. 2018;66(10):753–765.
- Rosa AC, Corsi D, Cavi N, et al. Superoxide dismutaseg administration: a review of proposed human uses. Molecules. 2021;26(7):1–40.
- Yu C, Xiao J. Review article the Keap1-Nrf2 system: a mediator between oxidative stress and aging. J Oxid Med Cell Longevity. 2021;(2021(6635460):1–16.
- Lee D, Song M, Kim E. Role of oxidative stress and Nrf2/KEAP1 signaling in colorectal cancer: mechanisms and therapeutic perspectives with phytochemicals. J Antioxid. 2021;10(173):1–23.
- Rhee SG, Yang KS, Kang SW, et al. Controlled elimination of intracellular H2O2: regulation of peroxiredoxin, catalase, and glutathione peroxidase via post-translational modification. Antioxid Redox Signaling. 2005;7(6):619–626.
- Lismont C, Revenco I, Fransen M. Peroxisomal hydrogen peroxide metabolism and signaling in health and disease. Int J Mol Sci. 2019;20(15):15.
- Tatalovi N, Uzelac TV, Orešˇ Z. Ibogaine-Mediated ROS/antioxidant elevation in Isolated Rat Uterus is β -Adrenergic receptors and K ATP channels mediated (Antioxidants (MDPI)). 2021. p. 1–16.