
ABSTRACT
Introduction
Introducing proper nutrition interventions to critically ill patients has been proven effective in mitigating the metabolic stress response and positively influencing immune reactions. Providing nutritional support to critically ill patients helps prevent further metabolic decline and preserves lean body mass.
Material and Methods
This study was conducted in Critical Care Units 1, 2, 3 and 4 at our Main Hospital included 316 patients divided into 2 groups, 155 patient (control group) and 161 patient (interventional group), where the interventional group was subjected to local nutritional protocol; which is based on various existing guidelines, meta-analyses, and randomized controlled trials (RCTs). The comprehensive study focuses on the impact of the local nutritional protocol on length of ICU stay, length of hospital stay, survival at 30 days, and at 90 days.
Results
There is statistically significant difference between interventional group ICU stay and control group ICU stay with P-value <0.001. Also, there is statistically significant difference between interventional group hospital stay and control group hospital stay with P-value <0.001. For 30 days overall survival; mean survival time of interventional group compared to mean survival time of control group, results show statistically significant with P-value <0.001. For 90 days overall survival; mean survival time of interventional group compared to mean survival time of control group results show statistically significant with P-value <0.001.
Conclusions
Applying our local nutritional protocol effectively reduced the duration of ICU stay, duration of hospital stay, 30 days all-cause mortality rate and mortality rate at 90 days.
1. Introduction
Hospitalized patients, especially in ICUs, require proper nutritional support, accounting for medical conditions [Citation1]. Nutritional support reduces hospital costs by up to 30%, including surgery and intensive care [Citation2]. Nutritional support in ICU patients is complex due to varying metabolic needs throughout critical illness stages, necessitating individualized approaches. The traditional “ebb” and “flow” phases of critical illness have evolved into an early phase marked by metabolic instability and catabolism, followed by a later phase characterized by muscle wasting and metabolic stabilization [Citation3]. Nutritional assessment aims to precisely determine a patient’s nutritional status, assess the clinical significance of malnutrition severity, and monitor changes, typically employing anthropometric, dietary, biochemical, clinical, and other parameters [Citation4].
Anthropometric data less accurate for malnutrition in critically ill patients. Creatinine excretion affected by renal function, diet, activity, illness. Malnutrition assessment challenged in critical illness [Citation5]. Serum proteins reflect acute phase response severity and disease prognosis. Inflammation markers include C-reactive protein (CRP) and interleukin-6 [Citation6].
NRS 2002 and NUTRIC score are extensively studied among nutritional screening tools [Citation7]. Malnutrition involves body composition changes due to energy and nutrient imbalances, as defined by Stratton et al. and the Academy of Nutrition and Dietetics (AND) and the American Society for Parenteral and Enteral Nutrition (A.S.P.E.N.) [Citation1,Citation8].
Malnutrition in ICU patients stems from various factors including catabolic hormones, surgical stress response cytokines, environmental constraints on food intake and physical activity, and sedative drugs, leading to muscle loss, impaired wound healing, and heightened infection susceptibility. Surgery and critical illness induce hypermetabolism and hypercatabolism, exacerbating tissue breakdown, while diseases may increase nutritional needs or decrease food intake, further disrupting the anabolism-catabolism balance, rapidly depleting body stores. Prolonged hospitalization weakens patients physically and psychologically, exacerbating eating difficulties and malnutrition risk [Citation9–12].
The Global Leadership in Malnutrition (GLIM) criteria, established in 2019 by international nutrition societies, provide practicable indicators for diagnosing malnutrition through a two-step model involving risk screening and severity assessment [Citation13].
Various methods for measuring energy requirements exist, including direct calorimetry, which directly measures heat production but is impractical for routine use; indirect calorimetry, considered the “gold standard,” calculates energy expenditure based on oxygen consumption and carbon dioxide production; and predictive equations, such as the Harris-Benedict equations, which estimate resting energy expenditure based on factors like sex, age, height, and body mass, but may not consider body composition. Additionally, protein requirements are estimated around 0.75–0.8 g/kg, with ICU patients often needing 1.3–1.5 g/kg, and caloric requirements can be predicted using formulae or adjusted based on factors influencing energy expenditure in intensive care [Citation14–17].
Fluid balance and electrolytes are crucial components of nutrition management, with phases of metabolic changes occurring in response to injury, impacting sodium retention and diuresis phases, as well as potassium balance. Micronutrients, including vitamins and trace elements, play essential roles in various physiological processes, especially in patients with predisposing conditions, necessitating their inclusion in both parenteral and enteral nutrition regimens. Additionally, immune-enhancing enteral nutrition formulas, containing additives like omega-3 fatty acids and antioxidants, aim to bolster immune responses in conditions such as trauma and infections, though their efficacy in improving overall health remains uncertain, with caution advised in severe sepsis cases due to increased mortality risk [Citation18,Citation19].
Nutritional support can be administered orally or enterally, with oral nutritional supplements (ONS) utilized for various therapeutic goals including malnutrition treatment. Enteral nutrition (EN) through tubes is recommended for patients unable to meet oral intake requirements, ensuring adequate nutrition, especially in conditions affecting oral intake. Parenteral nutrition (PN) involves intravenous administration of nutrients, utilized when oral or enteral intake is not feasible, with options such as total parenteral nutrition (TPN) or supplemental parenteral nutrition (SPN). PN can be administered through separate bottles or “all-in-one” admixtures, with considerations for minimizing contamination and ensuring proper nutrient balance [Citation4,Citation19].
2. Materials and methods
2.1. Patients
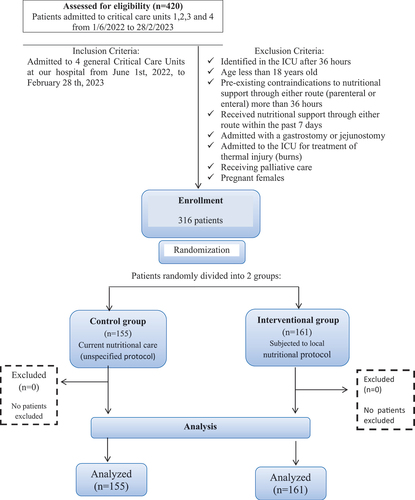
This research involved 316 participants, with 155 individuals in the control group and 161 in the interventional group. The study focused on patients admitted to four general Critical Care Units at our Main Hospital from June 1 2022, to February 28 2023, as determined by sample size calculation. Our institution’s ethics committee approved the study.
2.2. Eligibility criteria
All patients admitted during the study period were included with exclusion of patients met one or more of the following criteria:Identified in the ICU after 36 hours, age less than 18 year old, had preexisting contraindications to nutritional support through either route (parenteral or enteral) more than 36 hours, received nutritional support through either route within the past 7 days, admitted with a gastrostomy or jejunostomy (as they are on nutritional therapy), admitted to the ICU for treatment of thermal injury (burns), receiving palliative care and pregnant females.
2.3. Setting
Critical Care Units 1 (8 beds), 2 (12 beds), 3 (16 beds) and 4 (8 beds) are general critical care units.
2.4. Study design
Interventional study.
Figure 1. Study flow chart.
2.5. Data collection
Data collection occurred over 273 days, 316 patients were randomly divided into two groups, 155 patient (control group) and 161 patient (interventional group), where the interventional group was subjected to local nutritional protocol; which is based on various existing guidelines, meta-analyses, and randomized controlled trials (RCTs). For each patient enrolled in the study, the length of ICU stay, the length of hospital stay and mortality/survival at 30 days (even after discharge) were reported as primary outcome. Also, mortality/survival at 90 days was reported as secondary outcome.
2.6. Parameters studied
The local nutritional protocol for group 2 emphasizes early nutrition assessment using the NUTRIC score, observing signs of malnutrition, and initiating enteral nutrition (EN) within 24–48 hours, with parenteral nutrition (PN) considered if EN is inadequate after 7 days. Electrolyte monitoring and assessment of drug-nutrient interactions are crucial, with EN preferred over PN and tube feeding via the nasogastric route. Monitoring tolerance through gastric residual volume (GRV) and selecting appropriate enteral formulas are emphasized, with EN continued during diarrhea while investigating its cause. Micronutrient evaluation and supplementation, along with cautious use of immune-modulating nutrients, are recommended, tailored to the patient’s requirements. Specific protocols for conditions such as hepatic failure, traumatic brain injury, respiratory compromise, and acute kidney injury are outlined, emphasizing the importance of individualized nutritional support and regular documentation of practices for effective management.
2.7. Sample size calculation
A minimum required sample size of 145 critically ill patients that was subjected to new local nutritional protocol and 145 critically ill patients received the current nutritional care (unspecified protocol) currently applied by critical care staff achieves 80% power to detect proportion difference in 30 days all-cause mortality rate.
The sample size was calculated based on a similar study demonstrated 33.3% mortality rate in the new regimen versus 43.1% in conservative regimen [RR (95%) CI 0.77 (0.49, 1.20)].
The sample size was calculated by comparing two proportions at .05 significance level utilizing R software.
2.8. Statistical analysis
Data was fed to the computer and analyzed using IBM SPSS software package version 20.0. (Armonk, NY: IBM Corp). The significance of the obtained results was judged at the 5% level. Categorical data were represented as frequencies and percentages. The chi-square test was applied to compare between different groups. Alternatively, the Fisher Exact correction test was used when more than 20% of the cells have an expected count of less than 5. Quantitative data were represented as means and standard deviation after testing the normality of data using Kolmogorov–Smirnov test. Student t-test for normally distributed quantitative variables, to compare between two studied groups. Kaplan–Meier survival analysis for computing the survival over time associated with subjects that are represented by graph (Kaplan–Meier curve) showing survival probability according to certain factor over time. Log Rank test compare the survival probability of two or more groups over same time (two or more Kaplan–Meier curves). Cox proportional hazard regression analysis is a regression model to test the association between the survival time of patients and one predictor (unadjusted hazard ratio) or more than one predictor variables (adjusted hazard ratio).
2.9. Results
The current research was conducted in four general Critical Care Units included 316 patients divided into four groups, 155 patient (control group) and 161 patient (interventional group), where the interventional group was subjected to local nutritional protocol; which is based on various existing guidelines, meta-analyses, and randomized controlled trials (RCTs). The study found a significant difference in the mean mechanical ventilation (MV) days between the intervention and control groups (p < .001). The intervention group had a mean of 2 days (SD = 4) of MV days, while the control group had a significantly higher mean of 13 days (SD = 20) (). This indicates that the intervention resulted in a statistically significant reduction in the duration of mechanical ventilation compared to the control group. There exists a statistically significant difference between the ICU stays of the interventional group (mean 8 ± 6) and the control group (mean 21 ± 39), with a P-value of less than 0.001. Similarly, a statistically significant difference is observed between the hospital stays of the interventional group (mean 12 ± 7) and the control group (mean 26 ± 39), with a P-value of less than 0.001 (). Regarding overall survival at 30 days, the mean survival time of the interventional group (29.6 with a 95% confidence interval of 28.5–30.7) is significantly lower compared to the mean survival time of the control group (54.6 with a 95% confidence interval of 37.5–71.7), with a P-value of less than 0.001 (, ). Similarly, for overall survival at 90 days, the mean survival time of the interventional group (23.4 with a 95% confidence interval of 20.4–26.3) is significantly lower compared to the mean survival time of the control group (39.3 with a 95% confidence interval of 27–51.6), with a P-value of less than 0.001 (, ).On average, 2.7 patients would have to receive experimental treatment (instead of control treatment) for one additional patient to NOT have 30 days mortality outcome. On average, 2.6 patients would have to receive experimental treatment (instead of control treatment) for one additional patient to NOT have the 90 days mortality outcome.
Figure 2. Kaplan–Meier curves of 30-day survival with patients grouped according to intervention.
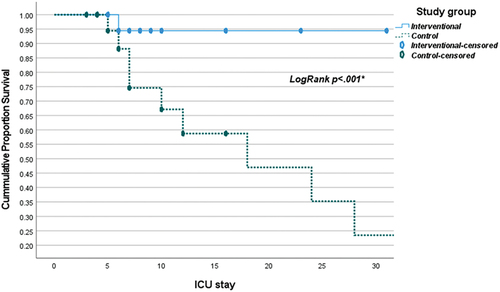
Figure 3. Kaplan–Meier curves of 90-day survival with patients grouped according to intervention.
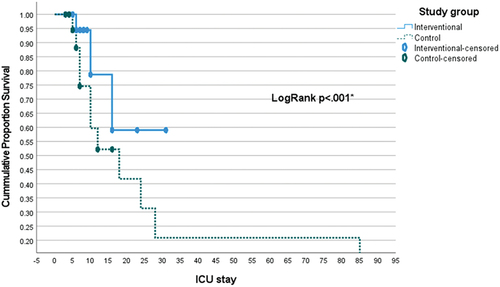
Table 1. Comparison between the studied groups according to MV days, ICU stay and hospital stay.
Table 2. Comparison between the studied groups according to 30 days mortality.
Table 3. Comparison between the studied groups mean survival time according to the overall survival time in 90 days.
3. Discussion
In this study, the interventional group had mean mechanical ventilation (MV) duration of 2 ± 4 days, contrasting with 13 ± 20 days in the control group. Additionally, ICU stays were shorter in the interventional group (8 ± 6 days) compared to the control group (21 ± 39 days), as were hospital stays (12 ± 7 days vs. 26 ± 39 days). These results suggest that the intervention significantly reduced MV days and shortened ICU and hospital stays, potentially aiding in organ support reduction and overall recovery improvement. O’Leary-Kelley et al. note the direct impact of nutritional care on diaphragm muscle function, underscoring the importance of proper nutrition in shortening MV duration [Citation20]. Koontalay et al. found associations between nutritional status, early enteral nutrition, and calorie targets within 7 days of admission with MV duration, suggesting guidelines could be developed to reduce ventilation duration [Citation21]. Agarwal et al. observed longer length of stay (LOS) for malnourished patients compared to well-nourished ones [Citation22], while Sharma et al. reported shorter LOS in the interventional group compared to the control group [Citation23]. Moreover, Munk et al. reported mean LOS differences between intervention and control groups [Citation24]. These findings collectively emphasize the significant role of nutrition in critical care outcomes, highlighting the potential for interventions to reduce MV duration and improve patient recovery.
In our study, the comparison of mean survival time over 30 days revealed a significant difference between the interventional group (29.6 days) and the control group (54.6 days), suggesting a substantial gap in survival outcomes (p < 0.001). Kaplan–Meier curves () supported this, showing improved survival with the intervention (p < 0.001). In both low and high mNutric score groups, the intervention yielded significantly higher survival rates (p < 0.001), especially notable in patients with high mNutric scores. The intervention group had better 90-day survival (23.4 days vs. 39.3 days, p < 0.001), supported by Kaplan–Meier analysis () (p < 0.001). Cox regression identified intervention, high mNutric score, and pneumonia presence as predictors of 30-day mortality. Mukhopadhyay et al. noted improved 28-day mortality with higher nutritional adequacy in high mNutric scores [Citation25], contrasting with Im et al. findings of complications and mortality with higher mNutric scores [Citation6]. Lower mNutric scores correlated with better survival, aligning with previous studies. Interventional group’s superior survival persisted at both 30 and 90 days, suggesting its efficacy. Shifting outcome measures toward patient-centered parameters and functional outcomes is advocated for better reflecting quality of life post-discharge.
3.1. Conclusions
In summary, our research underscores the critical role of nutritional intervention in enhancing outcomes for ICU patients compared to traditional care. The study reveals that baseline similarities in patient characteristics ensure reliable comparisons between groups. Importantly, the intervention’s association with improved mortality rates, reduced organ support needs, and shorter hospital stays highlights its significant clinical impact. Additionally, higher survival rates across all mNutric score categories demonstrate the intervention’s broad efficacy. These findings provide strong support for implementing nutritional interventions in ICU settings, although further research is warranted to elucidate underlying mechanisms and refine implementation strategies for optimal patient care.
Disclosure statement
No potential conflict of interest was reported by the author(s).
Additional information
Notes on contributors
Reham Hossam Mohamed Zaki
Reham Hossam Mohamed Zaki specializes in critical care and inpatient nutrition, contributing to research and clinical practice.
Amr Abdulla Elsayed
Amr Abdulla Elsayed is a critical care professor with expertise in sepsis management and patient safety.
Ehab Mahmoud Elreweny
Ehab Mahmoud Elreweny focuses on managing complex conditions in critically ill patients and mentors future healthcare professionals.
Tamer Nabil Habib
Tamer Nabil Habib advances critical illness management through research and education.
References
- Dumlu EG, Özdedeoğlu M, Bozkurt B, et al. A general consideration of the importance of nutrition for critically ill patients. Turk J Med Sci. 2014;44(6):1055–1059. doi: 10.3906/sag-1308-68
- McClave SA, Taylor BE, Martindale RG, et al. Guidelines for the provision and assessment of nutrition support therapy in the adult critically Ill patient: society of critical care medicine (SCCM) and American society for parenteral and enteral nutrition (A.S.P.E.N.). JPEN J Parenter Enteral Nutr. 2016;40(2):159–211. doi: 10.1177/0148607115621863
- Braga M, Gianotti L, Vignali A, et al. Hospital resources consumed for surgical morbidity: effects of preoperative arginine and omega-3 fatty acid supplementation on costs. Nutrition. 2005;21(11–12):1078–1086. doi: 10.1016/j.nut.2005.05.003
- Moizé V, Pi-Sunyer X, Vidal J, et al. Effect on nitrogen balance, thermogenesis, body composition, satiety, and circulating branched chain amino acid levels up to one year after surgery: protocol of a randomized controlled trial on dietary protein during surgical weight loss. JMIR Res Protoc. 2016;5(4):e220. doi: 10.2196/resprot.6438
- de Vries MC, Koekkoek WK, Opdam MH, et al. Nutritional assessment of critically ill patients: validation of the modified NUTRIC score. EUR J Clin Nutr. 2018;72(3):428–435. doi: 10.1038/s41430-017-0008-7
- Im KM, Kim EY. Identification of ICU patients with high nutritional risk after abdominal surgery using modified NUTRIC score and the association of energy adequacy with 90-day mortality. Nutrients. 2022;14(5):946. doi: 10.3390/nu14050946
- Thibault R, Chikhi M, Clerc A, et al. Assessment of food intake in hospitalised patients: a 10-year comparative study of a prospective hospital survey. Clin Nutr. 2011;30(3):289–296. doi: 10.1016/j.clnu.2010.10.002
- Laviano A. Approach to parenteral nutrition: module 9.4. Monitoring and complications of parenteral nutrition. Switzerland: ESPEN LLL Nutrition Programme; 2023.
- Singer P, Berger MM, Van den Berghe G, et al. ESPEN guidelines on parenteral nutrition: intensive care. Clin Nutr. 2009;28(4):387–400. doi: 10.1016/j.clnu.2009.04.024
- Claude P, Rémy M, Komsa R. Introduction to clinical nutrition. Switzerland: ESPEN; 2022.
- Frankenfield DC, Coleman A, Alam S, et al. Analysis of estimation methods for resting metabolic rate in critically ill adults. JPEN J Parenter Enteral Nutr. 2009;33(1):27–36. doi: 10.1177/0148607108322399
- Tsai AC, Chang TL, Yang TW, et al. A modified mini nutritional assessment without BMI predicts nutritional status of community-living elderly in Taiwan. J Nutr Health Aging. 2010;14(3):183–189. doi: 10.1007/s12603-010-0046-5
- Braga M, Gianotti L, Nespoli L, et al. Nutritional approach in malnourished surgical patients: a prospective randomized study. Arch Surg (Chicago, Ill: 1960). 2002;137(2):174–180. doi: 10.1001/archsurg.137.2.174
- Narayan SK, Gudivada KK, Krishna B. Assessment of nutritional status in the critically ill. Indian J Crit Care Med: Peer-Rev, Off Pub Indian Soc Crit Care Med. 2020;24(Suppl 4):S152–6. doi: 10.5005/jp-journals-10071-23617
- Jensen GL, Mirtallo J, Compher C, et al. Adult starvation and disease-related malnutrition: a proposal for etiology-based diagnosis in the clinical practice setting from the international consensus guideline committee. JPEN J Parenter Enteral Nutr. 2010;34(2):156–159. doi: 10.1177/0148607110361910
- Cederholm T, Jensen GL, Correia M, et al. GLIM criteria for the diagnosis of malnutrition - a consensus report from the global clinical nutrition community. Clin Nutr. 2019;38(1):1–9. doi: 10.1016/j.clnu.2018.08.002
- ASPEN Board of Directors and the Clinical Guidelines Task Force. Guidelines for the use of parenteral and enteral nutrition in adult and pediatric patients. JPEN J Parenter Enteral Nutr. 2002;26(1 Suppl):1SA–138SA. doi: 10.1177/0148607102026001011
- Stratton R, Green CJ, Elia M. Disease related malnutrition: an evidence-based approach to treatment. Wallingford: CABI Publishing; 2003.
- Bernal W. Nutritional support in liver diseases: module 13.1. Nutritional support in acute liver failure. Switzerland: ESPEN LLL Nutrition Programme; 2022.
- O’Leary-Kelley C, Bawel-Brinkley K. Nutrition support protocols: enhancing delivery of enteral nutrition. Crit Care Nurse. 2017;37(2):e15–23. doi: 10.4037/ccn2017650
- Koontalay A, Suksatan W, Sadang JM, et al. Optimal nutritional factors influencing the duration of mechanical ventilation among adult patients with critical illnesses in an intensive care unit. J Multidiscip. 2021;14:1385–1393. doi: 10.2147/JMDH.S319553
- Agarwal E, Ferguson M, Banks M, et al. Malnutrition and poor food intake are associated with prolonged hospital stay, frequent readmissions, and greater in-hospital mortality: results from the nutrition care day survey 2010. Clin Nutr. 2013;32(5):737–745. doi: 10.1016/j.clnu.2012.11.021
- Sharma M, Wahed S, O’Dair G, et al. A randomized controlled trial comparing a standard postoperative diet with low-volume high-calorie oral supplements following colorectal surgery. Colorectal Dis. 2013;15(7):885–891. doi: 10.1111/codi.12168
- Munk T, Bruun N, Nielsen MA, et al. From evidence to Clinical practice: positive effect of implementing a protein-enriched hospital menu in conjunction with individualized dietary counseling. Nut In Clin Prac. 2017;32(3):420–426. doi: 10.1177/0884533616688432
- Mukhopadhyay A, Henry J, Ong V, et al. Association of modified NUTRIC score with 28-day mortality in critically ill patients. Clin Nutr. 2017;36(4):1143–1148. doi: 10.1016/j.clnu.2016.08.004