
ABSTRACT
Noninvasive geoelectrical subsurface characterisation provides screening of the earth medium to resolve complexity in subsurface geology caused by inhomogeneity of the overburden strata and bedrock architectures. The subsurface geological, hydrogeophysical and engineering conditions of Etioro-Akoko, southwestern Nigeria, were investigated using electrical resistivity tomography (ERT). This was aimed at unravelling the hydrogeodynamic and litho-structural complexity that are responsible for low groundwater yield in wells/boreholes and foundation failures. Field 2D resistivity data sets of the study area were inverted and used to produce geotomographic models for detailed insights into the complex subsurface geological setting. Results of the 2D resistivity inverted models showed three to four distinct layers; the topsoil, weathered layer, partially weathered/fractured bedrock and fresh bedrock. Bedrock structures occasioned by fracturing and deep weathering of the bedrock were delineated with resistivities and thicknesses ranging from 40 to 950 Ωm and 10–25 m, respectively. The fracture systems; F1, F2, F3, F4 and F5 in NW-SE, NNW-SSE, NE-SW and ENE-WSW orientations act as the major groundwater collecting centres in the area. The orientations and geometries of these geologic features are the manifestations of structural deformation of the underlying geology. Fourteen hand-dug well and four borehole points were proposed based on the ERT results. Conversely, the localised bedrock structures and oscillating bedrock topography were suggestive of potential threats to the foundations of engineering structures in the studied area. Reinforcement of concrete foundations at certain sites where ERT suggested that the underlying strata were not capable of bearing loads was recommended as well. This study has offered a detailed understanding of the subsurface geological disposition for sustainable groundwater development and siting of durable civil engineering structures in the studied area and other areas with typical complex geological settings.
1. Introduction
Groundwater is the major source of freshwater to man for survival, and it plays immeasurable roles in domestic, agricultural and industrial activities, among others. The groundwater productivity in wells/boreholes and the siting of durable civil engineering structures depend on the favourable subsurface geological setting. Concealed subsurface geologic structures, such as weathered troughs, grabens, seepage zones and open-to-surface fractures, which act as conduits and storage for groundwater and threats to the foundations of civil engineering structures can efficiently be delineated through electrical resistivity method.
Electrical resistivity tomography (ERT) is a noninvasive technique that has become increasingly useful in near-surface geophysical investigations, especially for hydrogeological and geoengineering purposes. Various authors have described the relationships between electrical resistivity and geologic features, such as lithological unit and weight, soil water content, grain size distribution, pores and fluid saturating fills (Abu-Hassanein et al. Citation1996; Hassan Citation2014; Karim and Tucker-Kulesza Citation2017; Citation2018) which have made ERT very useful for lateral and vertical subsurface geological characterisation. ERT technique measures bulk earth’s resistivity information rapidly and effectively with higher resolution than the conventional geoelectrical and geotechnical probing techniques.
ERT offers continuous profiling of the earth medium and characterisation of soil constituents, vadose zone, thicknesses of strata/overburden covers, bedrock topography and structures for sustainable groundwater exploitation (Daily et al. Citation1991; Arora and Ahmed Citation2011; Arora et al. Citation2016; Uhlemann et al. Citation2017; Amaya et al. Citation2018; Costall et al. Citation2018; Akingboye et al. Citation2019; Hojat et al. Citation2020; McLachlan et al. Citation2020), as well as information about soil properties pertinent to engineering studies (Abu-Zied Citation1994; Ganerød et al. Citation2006; Robineau et al. Citation2007; Wisén et al. Citation2008; Osazuwa and Chii Citation2009; Ngan-Tillard et al. Citation2010; Maslakowski et al. Citation2014; Mao et al. Citation2015; Maurits et al. Citation2017; Abudeifa et al. Citation2019; Akingboye et al. Citation2020), particularly in complex geological areas. The technique also plays important roles in geology and other large-scale site characterisation (Nguyen et al. Citation2005; Dahlin et al. Citation2007; Bery and Saad Citation2012; Binley et al. Citation2015; Bernardinetti et al. Citation2018; Dahlin and Loke Citation2018; Gourdol et al. Citation2018; Mita et al. Citation2018). The geotomograms of ERT can sufficiently delineate subsurface boundary conditions and also resolve difficulties with the mapping of complex structure and structural artefacts (Lok et al. Citation2013; Carey et al. Citation2017; Akingboye and Ogunyele Citation2019).
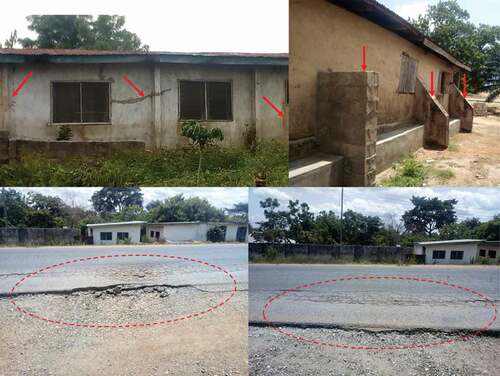
The study area in the town of Etioro-Akoko has peculiar complex subsurface characteristic features. Its overburden development is poor and hence, makes groundwater yield generally low in hand-dug wells and boreholes. This effect and the localisation of few fractures/faults cause failures of boreholes and wells, thereby making sufficient groundwater exploitation very difficult for the inhabitants relying on this resource as their major source of freshwater in this area. The long dry season spell from November to March/April also contributes to this problem by totally drying up most streams and wells in the area. Furthermore, it has been observed in the study area that foundation threats in civil engineering structures particularly road pavements () may be premised on the nature of the incompetent overburden strata, water saturating fills and rugosity of the bedrock topography. These effects combined have led to unnecessary waste of financial resources. Therefore, there is a need for detailed and adequate information on the nature of the subsurface geological condition that is responsible for low groundwater yield in wells/boreholes and foundation failures in the study area.
Figure 1. Images showing some of the defected engineering structures in the study area. The red arrows indicate reinforcements (concrete patching and buttress supports), while the red circles show the sections of the highway with pavement defects
The complexity of the subsurface geological conditions of the study area has been studied by some researchers like Akingboye et al. (Citation2019; Citation2020) basically on small scale from two traverses using ERT. Akingboye et al. (Citation2019) conducted a survey around the two mostly used boreholes in the study area to delineate the hydrogeological features and depths of aquifers responsible for their groundwater yield. In their other study (Citation2020), they investigated the subsurface geoengineering defects along the substrate of Etioro-Akoko highway, to properly delineate the subsurface geological characteristics responsible for the pavement failure of the highway in this area. These studies were not sufficient to fully understand the subsurface hydrogeophysical and engineering characteristics of the subsurface strata, including the subsurface litho-structural architecture on large scale.
In this study, we employed ERT on a large scale to characterise and provide a detailed understanding of the subsurface litho-structural, hydrogeophysical and engineering dynamics of Etioro-Akoko area. The specific objectives of this study include the delineation of the subsurface litho-structures and their thicknesses; nature and depths of aquifers; productive groundwater zones, and bedrock architectures in order to propose suitable locations for siting of productive wells/boreholes for sustainable groundwater abstraction and identifying of stable/competent strata to avert foundation/pavement failures in the study area.
2. Location and geological setting
Etioro-Akoko is located in the northern part of Ondo State, southwestern Nigeria. It lies between latitudes 07°26ʹ and 07°27ʹ N and longitudes 005°43ʹ and 005°44ʹ E (). The area falls within the tropical rainforest belt of Nigeria with the tropical wet and dry climates. The annual mean rainfall varies between 1000 mm and 1500 mm, with its peaks in July to September, while the dry season starts around November and ends by March/April. The topographic relief of the area ranges averagely between 280 m and 350 m above mean sea level, and it is characterised by hills, low-lying outcrops, plains and valleys. The drainage system in the area is characterised by seasonal streams that formed dendritic patterns, except in few places with trellis patterns.
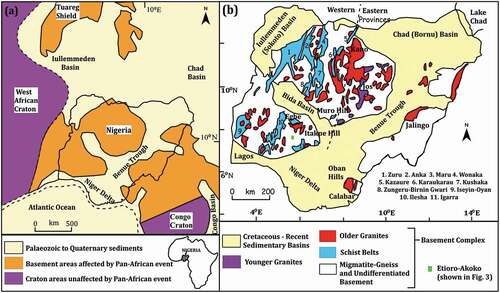
The Precambrian Basement Complex rocks of Etioro-Akoko area form a part of the southwestern Nigerian Basement Complex. Precambrian Basement Complex of Nigeria is located within the Pan-African Trans-Saharan mobile belt between the West African and Congo Cratons and to the south of the Tuareg Shield (Woakes et al. Citation1987; Kroner et al. Citation2001; Obaje Citation2009; Goodenough et al. Citation2014) ()). It comprises three major lithological groups; the Migmatite-Gneiss Complex, the Schist Belts and the Older Granites which intruded the former two groups ()).
Figure 2. (a) Regional geological map of Nigeria within the Pan-African mobile belt between the West African and Congo Cratons. (b) Outline geological map of Nigeria showing Etioro-Akoko in the southwestern Nigerian Basement Complex (modified after Woakes et al. Citation1987)
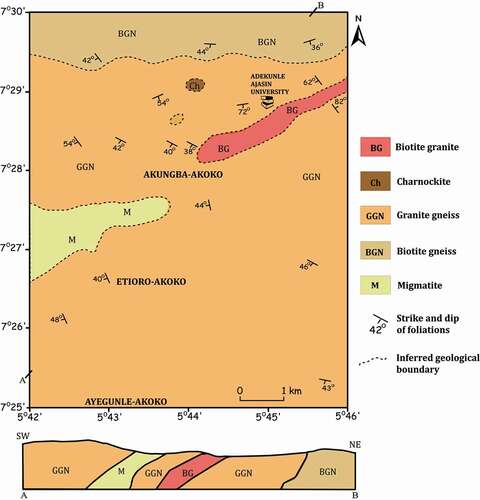
Etioro-Akoko with its environs is underlain by the Migmatite-Gneiss Complex of the Precambrian Basement rocks of southwestern Nigeria. The granite gneissic rock is the predominant lithological unit in the study area as observed from detailed field geological mapping, and it is shown in (geological map of Etioro-Akoko combined with the geological map of Akungba–Akoko in the work of Ogunyele et al. Citation2019). The granite gneiss of Etioro-Akoko, which extends to other parts of Akungba–Akoko area is weakly to moderately foliated, light grey, medium to coarse-grained in nature, with a blastoporphyritic to porphyroblastic fabric based on field observation. This rock is composed of alternating bands of light-coloured minerals (quartz- and feldspar-rich) and dark-coloured minerals rich in biotite, hornblende and other ferromagnesian minerals. The rock mainly trends WNW-ESE to ENE-WSW with moderate to steep dips to the south. The granite gneiss shows evidence of vein quartz and quartz lenses, and other intrusives, such as pegmatites, basic dykes and sills, giving the gneiss a migmatite form. This rock had undergone a series of tectonic deformations, which created both simple and complex structures comprising of folds, fractures and sheared zones. Since this granite gneiss is similar in forms, textures and colours to that found around Akungba-Akoko, it is likely that it has a similar chemical composition as reported in (Ogunyele et al. Citation2019).
Figure 3. Geological map of Etioro-Akoko and its environs, Ondo State, southwestern Nigeria
3. Materials and methods
3.1. Field measurements
A reconnaissance geological survey employed involves the field mapping of the various rock types and the identification of suitable places for geophysical traverses in the study area. Through this, insight into the selection of suitable array type for the geophysical investigation was gained. Data were acquired along ten (10) traverses (TRs) in the study area (). Four traverses comprising TRs 1, 2, 3 and 8 were laid approximately parallel to one another at the western side of the major road. TRs 4, 7 and 10 were laid in approximately E-W direction. TRs 5 and 6 were laid approximately NS along the eastern shoulder of the major road to cut through TRs 1, 3, 4, 7, 8 and 10. TR 9 was established in NS direction to cut through TRs 8 and terminated about 15 m before getting to TR 3. All the traverses were carefully established away from underground utilities, such as underground pipes and cables, and trenches in order to annul the effects of underground artefacts from such features.
A spread length of 200 m with a spacing of 5 m between station electrodes was employed for each geophysical traverse, and the resistivity data were acquired using an ABEM Lund Resistivity Imaging System. This electrode spacing was employed for higher depth penetration in order for the bedrock structures and architecture to be mapped. The Wenner array protocol was selected for the tomographic survey, because of its low sensitivity to noise (Loke Citation2004; Akingboye and Ogunyele Citation2019). Measurement procedures were repeated for other traverses after the completion of one profile. A single tomographic imaging technique was adopted instead of the roll-along techniques for TRs 1 and 5, with spread length longer than 200 m and TRs 2 and 6 were established as their extension, respectively. This method was adopted to optimise the level of signal-to-noise ratio in order to achieve high-resolution inverse resistivity models with no distorted structures arising from artefacts and cultural/self-potential noise due to the complexity of the subsurface geology. In addition, the reduction in the amount of penetrating current with respect to increasing electrodes spacing and probing depths was also a possible effect.
Figure 4. (a) Data acquisition map of the study area showing all the geophysical traverses and existing boreholes and wells. (b) 3-dimensional (3D) electrode array diagram showing the surface relief of the study area, geophysical traverses, and the positions of the electrodes along each traverse. Inset: location map of Ondo state showing the study area
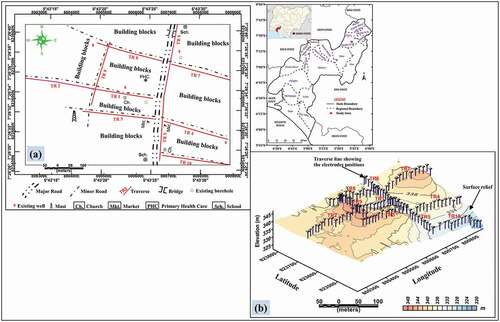
The coordinates and elevations of respective electrodes position were also taken for the purpose of the topographic and resistivity geotomographic modelling, and to serve as a guide for selecting the actual points for wells/boreholes and civil engineering structures that are to be sited in the future. The surveyed area covers a total area of approximately 2.6 km2, which is approximately 70% of the area occupied by the inhabitants. This investigation was the largest ever performed in the study area and surrounding communities. This large-scale approach was adopted in order to achieve detailed and realistic subsurface geological information to fully address the specific objectives of this study.
3.2. Field data processing, inversion and modelling
The acquired field resistivity data sets were processed and inverted using RES2DINVx64 software. Bad data points having extremely high or low resistivity threshold values when compared with surrounding stations were removed, and the resulting data were iteratively inverted. This inversion process involved forward modelling and data inversion with well-modified inversion parameters to determine the true subsurface resistivity distribution using the least-square inversion method. The least-square inversion uses a mathematical inverse problem that determines the subsurface resistivity distribution from measurements of apparent resistivity datasets. This inversion technique attempts to produce a subsurface-inverted model that agrees mostly with the field apparent resistivity measurements based on the predefined numbers of iterations for convergence.
For this study, the adjusted parameters included model refinement using cell widths of half electrode spacing for optimum results. This technique divides each of the cell blocks with original unit electrodes spacing of 5 m into half (i.e. 2.5 m). This process takes into consideration the subsurface layers at the near-surface depths because the depths of engineering structures particularly roads rarely exceed the near-surface strata, except investigations for siting of high rise buildings/superstructures. Finite-element method of 4 nodes and L1-norm was employed for more accurate-calculated apparent resistivity and stable inversion models. The vertical/horizontal flatness ratio filter of 0.5 was used for better resolution of anomaly appearances. The damping factor of 0.1 with a minimum of 0.02 (one-fifth of the initial value) was also adopted to stabilise the inversion process and to increase the certainty that the identified anomalies actually exist (deGroot-Hedlin and Constable Citation1990; Loke Citation2004). Inverse model convergence RMS/Abs error limit below 10% was chosen for a maximum of 10 iterations. The convergence of the resistivity model was monitored critically from the fifth iterations for a better result, because inverted resistivity model with the lowest convergence limit may sometimes not give the required ideal subsurface geological structures and anomalies.
Other software packages used in this work included the use of Oasis MontajTM and Geosoft SurferTM for production of the 2- and 3-dimensional (2D and 3D) geotomographic maps and models as well as profiles for detailed subsurface interpretation.
3.3. Interpretation criteria
The information relating to the thicknesses of the overburden sequence derived from stream channels, failed wells with depth to fresh bedrock of less than 2 m, and other shallow hand-dug wells were used to constrain the ERT results to delineate respective layers in relation to their resistivity values. Our interpretation also used information contained in the works of Akingboye et al. (Citation2019; Citation2020). In the 2D inverse model resistivity sections, the resistivity patterns with values below 150 Ωm were interpreted as the surficial clayey topsoil, while the low to intermediate resistivity patterns for the second near-surface strata were interpreted as the weathered layer. High resistivity values generally in excess of 1000 Ωm was interpreted as the fresh bedrock (basal unit). The partially weathered/fractured bedrock, the third layer, exists between the weathered layer and the fresh bedrock. The weathered bedrock troughs and fractures were interpreted as the conduits for groundwater in the study area.
4. Results and discussion
The 2D inverse model resistivity sections of the study area () generally show three to four distinct subsurface layers based on the observed low to very high resistivity values. These layers include the surficial clayey topsoil, clayey- to sandy-rich-weathered layer (second layer), partially weathered/fractured bedrock (third layer), and fresh bedrock, with resistivity values of <150 Ωm, 10–650 Ωm, 200–950 Ωm and >1000 Ωm, respectively. However, the partially weathered/fractured bedrock layer is absent in some profiles. The thickness values of the first, second and third layers across the area range from 0.2 to 2.5 m, 2.6–15 m and 10 – >25 m, respectively.
The inverse model resistivity section of TR 1 ()) is characterised by deep weathered troughs in stations 18–65 m and 170 m westward, and a fracture (F1 – F’1) between stations 100 m and 122 m. These features extend to depths >20 m. TR 2 ()) is characterised by a layer of clayey to hard-pan lateritic topsoil with thickness ranging from 0.69 to 2.2 m. Stations 48 m, 68–120 m and 150 m westward are characterised by subrounded to elongated lenticular-weathered soil constituents with a thickness of about 20 m. This feature and the deep weathered trough of thickness >25 m, extending from station 145 m westward, are concealed by an overlying hard-pan lateritic soil. TR 3 ()) mirrors a sequence of partially weathered troughs in stations 8–20 m, 30 m, 47 m and 145 m, and a deeply weathered trough at stations 120–126 m; these features have thicknesses of about 10.5 m each. The latter zone is suggestive of progressive weathering due to the water-filled conically formed structure. TR 4 ()) shows a thin overburden cover with low to intermediate resistivity overlying the fresh bedrock. The fresh bedrock segmented the overburden in stations 98–107 m into approximately equal halves. The western half shows two features – an elongated plunging structure, which we have interpreted to be water-filled. It extends from the nearly vertical bedrock scrap and the inclined trough-like structure in station 110 m and 155–185 m, with thicknesses of 12 m and >20 m, respectively. The other eastern half shows similar features, but with shallower depths. The deeply weathered trough in section 155 m at the western flank of this traverse is suggestive of water-seeping channel migrating through the down-thrown fractured bedrock.
Figure 5. The inverse model resistivity sections of TRs 1–10 (a–j). The slanting broken lines (F – F’) indicate the bedrock fractures.
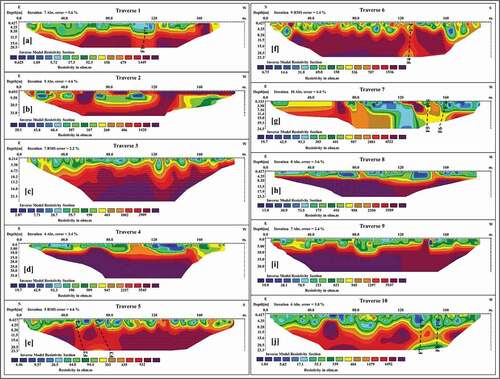
Along TR 5 ()), the partially weathered/fractured bedrock interspersed the weathered layer at stations 65 m, 92 m, 105 m, 122–132 m and 170 m, producing curve to lenticular-shaped structures with in-filled weathered materials. Two different concurrent fractures: F2 – F’2 and F3 – F’3, are evident between stations 47–55 m and 65–88 m, respectively. These fractured zones with depths >24 m segmented the fresh bedrock into northern and southern sections. Both segmented bedrock slabs dip gently with axial planes in the same direction as the two fractures at stations 45 m and 85 m, respectively. Similarly, along with TR 6 ()), the bedrock surface shows variable patterns attributed to the foundation of the existing bridge at the depth range of 0.5–5 m in stations 8–25 m. It also shows oscillating bedrock troughs in stations 12–23 m, 32–48 m, 65–110 m and 156–178 m, and a deep fracture (F4 – F’4) between stations 122 m and 135 m. These features act as pathways for infiltrating water. The fracture fragmented the fresh bedrock into a segment extending from station 120 m to the northern end of the traverse and a southern segment with a partially weathered base which is bounded by an elongated bedrock trough. TR 7 ()) shows evidence of deep weathered bedrock troughs (<450 Ωm) extending to depths >25 m and 12 m in stations 85–128 m and 160 m, respectively. In addition, a series of contemporaneous fractures; F5 – F’5 and F6 – F’6 occurring between stations 145 m and 158 m discontinued the fresh bedrock.
TR 8 ()) is characterised by generally thin-weathered layer, with exception of stations 110–145 m having depths of about 10 m. The fresh bedrock underlying this layer depicts approximately flat topography with no structural feature. The fresh bedrock, however, extends to the near-surface in stations 82 m and 148 m. The bedrock underlying TR 9 ()) depicts almost similar resistivity patterns. The resistive bedrock extending from the near-surface to the basal part of the inverted model demarcates the overburden to form troughs in stations 12–40 m and 78–98 m. Interestingly, the resistivities and thicknesses of the subsurface materials in stations 172 m, 185 m and the western ends of TRs 8, 1 and 3, respectively, are similar to those observed at the points where they all intercepted TR 9. TR 10 ()) shows that the underlying bedrock is characterised by circular to oblique highly resistive bodies which are probably dykes. This bedrock is less resistive, and it was caused by the progressive weathering which was responsible for the formed varying weathered bedrock troughs between stations 62 m and 95 m and a thin-weathered bedrock slab extending from station 130 m westward. The deep multiple fractures (F7 – F’7 and F8 – F’8) indicated between stations 136 m and 155 m also contributed to the reduced bedrock resistivity compared to the sections with dykes. The base of these fractured zones from depth 16 m is marked by low resistivity (<150 Ωm).
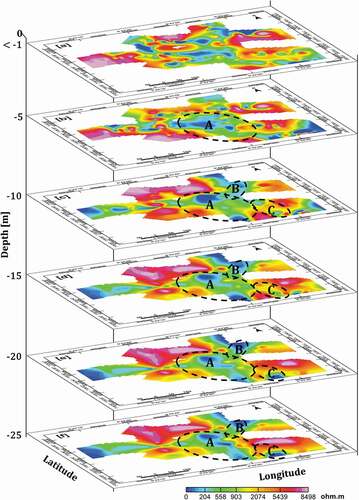
In an attempt to have a broader and clearer picture of the subsurface resistivity distribution as interpreted in the ERT tomograms of the study area, 2D resistivity depth slices () were produced from the inverted ERT results. The maps were inverted from resistivity values picked from the ERT tomograms at every station starting from the surface depths (<1 m) to 25 m at an interval of 5 m. ) shows the depth slice of the layer at depths 0 – <1 m. it shows that the western, eastern, and the extreme north and parts of the central and southern sections of the map are characterised by highly resistive soil constituents (>1000 Ωm) consisting of lateritic soil and outcropping bedrock. The central anomalously low to moderate resistivity values (<200 Ωm) with NE-SW orientation as seen in suggest clayey to sandy soil constituents. The water table around this section ranges between depths of 2 m and 3 m as observed in wells and this has contributed to the observed low resistivity values. But as the depth increases from 10 to 25 m (), the resistivity also increases due to the declining rate of weathering and fracturing.
Figure 6. 2D inverted resistivity depth slice map of the study area at depth: (a) 0 – <1 m (top layer), (b) 5 m, (c) 10 m, (d) 15 m, (e) 20 m and (f) 25 m. The maps depict the spatial distribution of the subsurface resistivities at various depths. The traverse lines were superimposed on map “A” to show the constraint of data sets to their exact position.
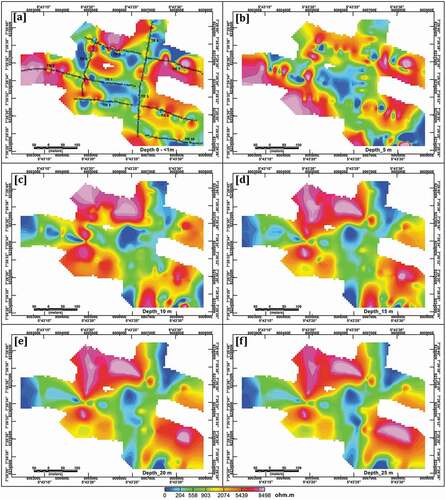
The delineated highly resistive anomalous sections showing an increase in anomalous sizes with increasing depths in ) are consistent throughout the other 2D inverted resistivity depth slice maps of the study area. As the depths of investigation increase above 5 m as shown in , the western ends with the initial high resistivities, however, show very low resistivity anomalies due to the variability of the soil profiles and weathering condition. This change in resistivity response indicates that the two near-surface strata in are lateritic in nature; these strata are capable of serving as a protective medium for the aquifers against contamination. The southeastern flank of this area characterised by discontinuities within the highly resistive bedrock is suggestive of multiple penetrative fractures (see )) extending from an average depth of 8 m. Therefore, it is generally deduced that the northeastern, central to the southwestern, western end and the southern sections of the study area have witnessed both progressive weathering and fracturing of the bedrock at varying depths.
4.1. Subsurface litho-structural characterisation of the study area
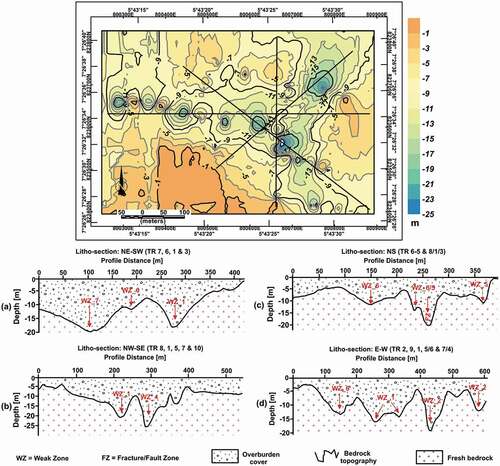
The interpreted 2D contoured bedrock surface map (top panel in ) was used to show the varying depths of the overburden to fresh bedrock in the study area. The least depth to fresh bedrock, that is, depth from the ground level to the top of the fresh bedrock is <0.7 m; however, it is deeper (>25 m) in some sections. The interpreted litho-section () of the four profile lines in NE-SW, NW-SE, NS and E-W directions shown in top panel map were used to clearly show where the depths of the overburden and geologic features are pronounced and their variability.
Generally, the sections with high depth values in coincide with sections with low to moderate resistivity values in . The prominent weak zones delineated in the area include WZ_7, WZ_6 and WZ_1 with approximate thicknesses of 19 m, 12 m and 17 m for the NE-SW litho-section profile; WZ_1 and WZ_4 with thicknesses of 20 m and 24 m for the NW-SE litho-section profile; WZ_6, WZ_6/5, WZ/FZ and WZ_5 with thicknesses of 13 m, 14 m, 20 m and 8.5 m for the NS litho-section profile, and WZ_6, WZ_1 and WZs_2 with thicknesses of 12.5 m, 16 m and 12–20 m for the E-W litho-section profile. These features were probably formed from gradual and deep weathering of the bedrock minerals, such as feldspar, micas and amphibole due to their susceptible nature to weathering and deformation arising from fracturing and shearing of the bedrock.
Figure 7. 2D contoured bedrock surface map of the study area (top panel) showing the litho-section lines with their resulting litho-section profiles (down panels) along NE-SW (a), NW-SE (b), NS (c) and E-W (d). The litho-sections show the depths to fresh bedrock, undulating bedrock topography, and weak zones in the area. A negative depth value implies depth below ground level (bgl).
shows the bedrock structural map of the study area with a view to understanding the extension and orientation of the eight fractures (F1 – F’1 to F8 – F’8) identified in the ERT results (see ), as tomograms suffers from giving the exact structural orientation. Interestingly, these eight identified fractures were shown as five major fracture systems based on their orientations within the bedrock architecture in . These major fracture systems include F1, F2, F3, F4 and F5 (now referred to as F 1–5). The orientation of F1 is NW-SE, F2 and F4 are NNW-SSE, F3 is ENE-WSW and F5 is approximately NE-SW. Fracture F4 is the most penetrative of all the identified fractures, followed by F5, F2 and F3 in the arranged order. F1 extends from TR1 and runs through the northern end of TR 5 to TR 4 to connect with F4. F4 connects other multiple fractures, especially fractures in TRs 1, 5, 4, and 10 and it may also have been collected with F5. As this may be true, structural evidences from other geophysical methods can further provide detailed interpretation. , 3D geotomographic depths slice model, clearly shows the depth extents of the delineated fractures in the subsurface. The sections annotated “A” show the depths of F1, F2, F3 and F4 from the fresh bedrock to the near-surface at an approximate depth of about 5 m, while the annotated sections “B” and “C” show that of F5 and F4, respectively, extending from the fresh bedrock to depth of 10 m. In spite of the generally thin overburden cover and ruggedness of the bedrock as interpreted from , the delineated fracture systems and other interpreted litho-structural features, such as the deep weathered troughs and seepage zones act as the pathways for groundwater storage in the aquifers to boost the groundwater potential of the study area. On the other hand, the clayey soil material, water saturating fills within the weathered bedrock troughs, and the oscillating bedrock topography with nearly vertical scarps and rugose surfaces evident in the geotomographic models have the potentials to adversely impact the foundations of civil engineering structures in the study area.
Figure 8. Bedrock structural map of the study area showing the variations in overburden thicknesses and trends of the subsurface fractures (F 1–5)
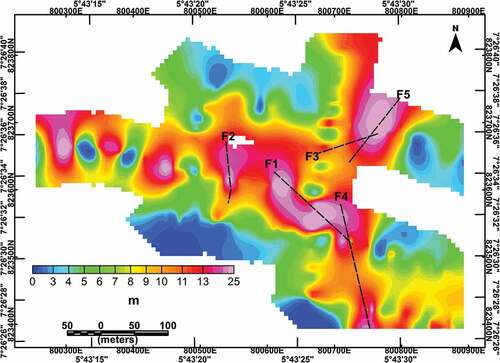
Figure 9. 3D geotomographic depths slice model showing the depth limits for the delineated fractures (in broken circles and annotated as A, B and C). The negative depth values imply depth bgl
4.2. Hydrogeophysical evaluation of the study area
The hydrogeophysical evaluation of the study area provides insights into the hydrogeological zones of potential groundwater yield. Based on the geotomographic models (), the identified viable hydrogeological zones include aquifers within the overburden column (preferentially the deep-weathered troughs) and the fractured zones. Due to the complex subsurface geology and prolonged dry season spell of the study area, the groundwater potentials of the aquifers were evaluated based on the overburden thicknesses and litho-structural dynamics. Aquifers with thicknesses of <8 m, 8–15 m and >24 m are rated as poor, fairly good and good with very low yield, low to moderate yield, and moderate to high yield, respectively, for groundwater abstraction. Hence, a total of 14 hand-dug well (PWLs 1–14) and four borehole (PBHs 1–4) points are proposed for aquifers with low to moderate and moderate to high groundwater-yielding capacity, respectively ( and ), in addition to the servicing hand-dug wells (WLs 1–4) and boreholes (BHs 1–2) for sufficient groundwater supply in the area.
Figure 10. Idealised composite image of the subsurface inverted resistivity models of the study area. It shows the litho-structural dynamics, proposed hand-dug well and borehole points, and proposed bridges for failed road sections.
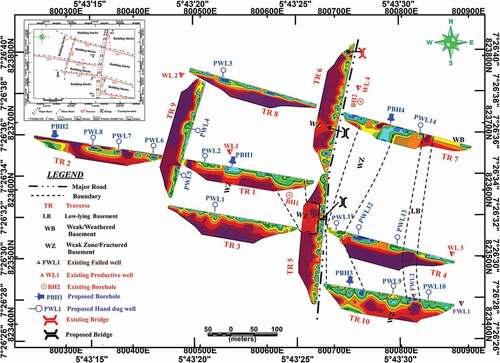
Table 1. A comprehensive summary of the locations, approximate drill depths, widths and the nature and geological conditions of aquifers proposed for siting of hand-dug wells and boreholes in the study area
PBHs 1–4 and PWLs 1–14 are characterised by fractured and overburden column aquifers, respectively. PWLs 2, 3, 5 and 12–14 may likely not provide the expected groundwater yield during the prolong dry season, because of their shallow depths (approx. 10 m). The fracture at PBH 4 may be linked to the fault line that runs through TR 6 (see ) from which the existing borehole (BH 2) abstracts its water. On the other hand, BH 1 may have taken its source of recharge from the weak zone adjoining TRs 1 and 3 and the weak zone in the northern section of TR 5. However, the failed hand-dug wells (FWLs 1–2) around TR 10 (see ) and in other parts of the study area are the result of the very thin overburden cover (<2 m) as observed in the field and ERT results.
4.3. Civil engineering evaluation of the study area
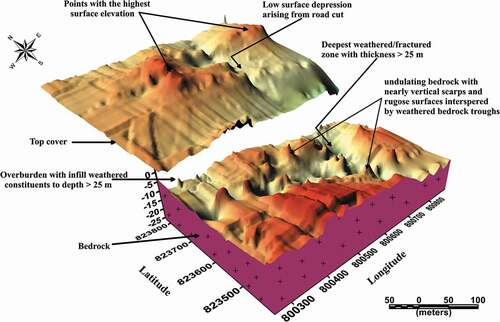
The durability of civil engineering structures are based on factors, such as the nature of subsurface soil constituents, soils’ grain sizes and pore spaces, amount of water saturating fills and bedrock structural architecture on which they are founded. In this study, the resistivity geotomographic models () show sections with potentially rich and thick clayey soil, deep-weathered troughs, floaters (boulders), oscillating bedrock topography and fractures. These features have the potentials to adversely affect the foundations of the engineering structures by causing a series of cracks in buildings without reinforced foundations or not resting on the stable ground due to differential settlement. These foundation threats vary across the surveyed area but are pronounced along with TRs 1, 4, 5–6 (major road), 7 and 10. The cracks have ripped off the asphalt coating in some sections of the highway and also left some buildings with secondary reinforcement (buttress supports and concrete patching as shown in ). The 3D-conceptualised soil-lithology thickness model of the study area () was produced by placing the surface topographic relief over the bedrock surface model. It shows the attributes of the subsurface features which may have provoked the foundation failures majorly at the central part of the area. This section is characterised by thick weathered profile, with the potential to cause swelling and shrinkage of the clayey rich near-surface strata (<150 Ωm) and floating boulders and fractured bedrock with declining load-bearing capacity (see ). Hence, engineering construction requires extra reinforcement.
Figure 11. 3D conceptualised soil-lithology thickness model of the study area showing the variability patterns of the topographic relief, weathering thickness and bedrock structural architecture
5. Conclusions
In this study, multi-electrode resistivity tomography was employed for the subsurface geological, hydrogeophysical and engineering characterisation of Etioro-Akoko, southwestern Nigeria, in order to delineate the hydrogeodynamic and litho-structural complexity that is responsible for low groundwater yield in wells/boreholes and foundation failures in civil engineering structures. The integration of the ERT results and other geotomographic model shows distinct layers, which include topsoil, clayey to sandy weathered layer, partially weathered/fractured bedrock and fresh bedrock. The floating boulders and deep weathered troughs in some sections are parts of the features characterising the second and third near-surface layers. These features in addition to the fractures act as the groundwater conduits in the area.
In a terrain with complex subsurface geology like Etioro-Akoko, taking advantage of the delineated subsurface features proposed for wells/boreholes at overburden- and fractured bedrock-aquifers for sustainable groundwater abstraction will help mitigate the serious shortage of water supplies and also prevent future deficit as population increases. However, there is a need for proper construction designs of wells to ensure adequate protection against surface contamination due to the thin overburden cover. We have also made some preliminary interpretation on clay thicknesses in Etioro-Akoko. This clay soil and the incompetent load-bearing strata and fractured bedrock adversely affect engineering construction quality. Hence, replacement of the clayey near-surface strata with competent sub-base soils, and construction of bridges and reinforcement of concrete foundation at certain sites with low load-bearing strata are proposed for the founding of durable civil engineering structures in the study area.
Acknowledgements
The authors are grateful to Messers Abimbola Chris Ogunyele, Olaniyi Richard Ijaleye, and Moses Salami for their field assistance. The NRIAG Editor-in-Chief and the two anonymous reviewers are greatly acknowledged for their insightful comments that have contributed significantly to the readability of the manuscript.
Disclosure statement
No potential conflict of interest was reported by the authors.
References
- Abudeifa AM, Mohammed MA, Fat-Helbary RE, El-Khashab HM, Masoud MM. 2019. Integration of 2D geoelectrical resistivity imaging and boreholes as rapid tools for geotechnical characterization of construction sites: a case study of New Akhmim city, Sohag, Egypt. J Afr Earth Sci. 15. doi:https://doi.org/10.1016/j.jafrearsci.2019.103734.
- Abu-Hassanein Z, Benson C, Blotz L. 1996. Electrical resistivity of compacted clays. J Geotech Eng. 122:397–406. doi:https://doi.org/10.1061/(ASCE)0733-9410.
- Abu-Zeid N. 1994. Investigation of channel seepage areas at the existing Kaffrein dam site (Jordan) using electrical resistivity measurements. J Appl Geophys. 32:163–175.
- Akingboye AS, Ogunyele AC. 2019. Insight into seismic refraction and electrical resistivity tomography techniques in subsurface investigations. Min-Geol-Petrol Eng Bull. 34(1):93–111. doi:https://doi.org/10.17794/rgn.2019.1.9.
- Akingboye AS, Osazuwa IB, Mohammed MZ. 2019. Electrical resistivity tomography for sustainable groundwater development in a complex geological area. Mat Geoenviron. 66(2):121–128. doi:https://doi.org/10.1515/rmzmag-2019-0004.
- Akingboye AS, Osazuwa IB, Mohammed MZ. 2020. Electrical resistivity tomography for geo-engineering investigation of subsurface defects: a case study of Etioro-Akoko highway, Ondo State, southwestern Nigeria. Studia Quaternaria. 37(2):101–107. doi:https://doi.org/10.24425/sq.2020.133754.
- Amaya AG, Ortiz J, Durán A, Villazon M. 2018. Hydrogeophysical methods and hydrogeological models: basis for groundwater sustainable management in Valle Alto (Bolivia). Sustain Water Resour Manag. doi:https://doi.org/10.1007/s40899-018-0293-x.
- Arora T, Ahmed S. 2011. Characterization of recharge through complex vadose zone of a granitic aquifer by time-lapse electrical resistivity tomography. J Appl Geophys. 73:35–44. doi:https://doi.org/10.1016/j.jappgeo.2010.11.003.
- Arora T, Boisson A, Ahmed S. 2016. Non-intrusive hydro-geophysical characterization of the unsaturated zone of South India-A case study. J Afr Earth Sci. 122:88–97. doi:https://doi.org/10.1016/j.jafrearsci.2016.04.021.
- Bernardinetti S, Pieruccioni D, Mugnaioli E, Talarico FM, Trotta M, Harroud A, Tufarolo E. 2018. A pilot study to test the reliability of the ERT method in the identification of mixed sulphides bearing dykes: the example of Sidi Flah mine (Anti-Atlas, Morocco). Ore Geol Rev. 101:819–838. doi:https://doi.org/10.1016/j.oregeorev.2018.08.028.
- Bery AA, Saad R. 2012. Analysis and imaging subsurface structure via engineering characterizations and integrated geophysical tomography modelling methods. Int J Geosci. 3:93–104. doi:https://doi.org/10.4236/ijg.2012.31011.
- Binley A, Hubbard SS, Huisman JA, Revil A, Robinson DA, Singha K, Slater LD. 2015. The emergence of hydrogeophysics for improved understanding of subsurface processes over multiple scales. Water Resour Res. 51(25):3837–3866.
- Carey AM, Paige GB, Carr BJ, Dogan M. 2017. Forward modeling to investigate inversion artifacts resulting from time-lapse electrical resistivity tomography during rainfall simulations. J Appl Geophys. 145:39–49. doi:https://doi.org/10.1016/j.jappgeo.2017.08.002.
- Costall A, Harris B, Pigois JP. 2018. Electrical resistivity imaging and the saline water interface in high-quality coastal aquifers. Surv Geophys. 1–64. doi:https://doi.org/10.1007/s10712-018-9468-0.
- Dahlin T, Loke MH. 2018. Underwater ERT surveying in water with resistivity layering with example of application to site investigation for a rock tunnel in central Stockholm. Near Surf Geophys. 16:230–237. doi:https://doi.org/10.3997/1873-0604.2018007.
- Dahlin T, Wisen R, Zhang D. 2007. 3D effects on 2D resistivity imaging-modelling and field surveying results. 13th European Meeting of Environmental and Engineering Geophysics, Istanbul, Turkey.
- Daily W, Ramirez A, LaBrecque D, Nitao J. 1991. Electrical resistivity tomography of vadose water movement. Water Resour Res. 28(5):1429–1442. doi:https://doi.org/10.1029/91WR03087.
- deGroot-Hedlin C, Constable SC. 1990. Occam’s inversion to generate smooth two-dimensional models from magnetotelluric data. Geophys. 55:1613–1624.
- Ganerød GV, Rønning JS, Dalsegg E, Elvebakk H, Holmøy K, Nilsen B, Braathen A. 2006. Comparison of geophysical methods for sub-surface mapping of faults and fracture zones in a section of the Viggja road tunnel, Norway. Bull Eng Geol Environ. 65:231–243. doi:https://doi.org/10.1007/s10064-006-0041-6.
- Goodenough KM, Lusty PAJ, Roberts NMW, Key RM, Garba A. 2014. Post-collisional Pan-African granitoids and rare metal pegmatites in western Nigeria: age, petrogenesis, and the ‘pegmatite conundrum’. Lithos. 200:22–34. doi:https://doi.org/10.1016/j.lithos.2014.04.006.
- Gourdol L, Clément R, Juilleret J, Pfister L, Hissler C. 2018. Large-scale ERT surveys for investigating shallow regolith properties and architecture. Hydrol Earth Sys Sci Discuss. 39. doi:https://doi.org/10.5194/hess-2018-519.
- Hassan AA. 2014. Electrical resistivity method for water content characterisation of unsaturated clay soil [Durham theses]. Durham University. http://etheses.dur.ac.uk/10806/.
- Hojat A, Arosio D, Ivanov VI, Loke MH, Longoni L, Papini M, Tresoldi G, Zanzi L. 2020. Quantifying seasonal 3D effects for a permanent electrical resistivity tomography monitoring system along the embankment of an irrigation canal. Near Surf Geophys. 18:427–443. doi:https://doi.org/10.1002/nsg.12110.
- Karim MZ, Tucker-Kulesza SE. 2017. Two-dimensional soil erosion profile using electrical resistivity surveys. Geotech Frontiers. Reston (VA): ASCE.
- Karim MZ, Tucker-Kulesza SE. 2018. Predicting soil erodibility using electrical resistivity tomography. J Geotech Geoenviron Eng. 144(4):1–11. doi:https://doi.org/10.1061/(ASCE)GT.1943-5606.0001857.
- Kroner A, Ekwueme BN, Pidgeon RT. 2001. The oldest rocks in West Africa: SHRIMP zircon age for early archean migmatitic orthogneiss at Kaduna, Northern Nigeria. J Geol. 109:399–406.
- Lok MH, Chambers JE, Rucker DF, Kuras O, Wilkinson PB. 2013. Recent developments in the direct-current geoelectrical imaging method. J Appl Geophys. 95:135–156.
- Loke MH. 2004. Rapid 2D resistivity and IP inversion using the least-square method. Manual for RES2DINV, version 3.54. p. 53.
- Mao D, Revil A, Hort RD, Munakata-Marr J, Atekwana EA, Kulessa B. 2015. Resistivity and self-potential tomography applied to groundwater remediation and contaminant plumes: sandbox and field experiments. J Hydrol. 530:1–14. doi:https://doi.org/10.1016/j.jhydrol.2015.09.031.
- Maslakowski M, Kowalczyk S, Mieszkowski R, Józefiak K. 2014. Using electrical resistivity tomography (ERT) as a tool in Geotechnical investigation of the subsurface of a highway. Studia Quaternaria. 31(2):83–89. doi:https://doi.org/10.2478/squa-2014-0008.
- Maurits VH, Thomas H, Gaël D, Frédéric N. 2017. 3D electrical resistivity tomography of karstified formations using cross-line measurements. Eng Geol. 220:123–132.
- McLachlan P, Chambers L, Uhlemann S, Sorensen J, Binley A. 2020. Electrical resistivity monitoring of river–groundwater interactions in a Chalk river and neighbouring riparian zone. Near Surf Geophys. 18:385–398. doi:https://doi.org/10.1002/nsg.12114.
- Mita M, Glazer M, Kaczmarzyk R, Dąbrowski M, Mita K. 2018. Case study of electrical resistivity tomography measurements used in landslides investigation, Southern Poland. Contemp Trends Geosci. 7(1):110–126. doi:https://doi.org/10.2478/ctg-2018-0007.
- Ngan-Tillard D, Venmans A, Slob E, Mulder A. 2010. Total engineering geology approach applied to motorway construction and widening in the Netherlands: part II: pilot site in tidal deposits. Eng Geol. 114:171–180. doi:https://doi.org/10.1016/j.enggeo.2010.04.015.
- Nguyen F, Garambois S, Jongmans D, Pirard E, Loke MH. 2005. Image processing of 2D resistivity data for imaging faults. J Appl Geophys. 57:260–277. doi:https://doi.org/10.1016/j.jappgeo.2005.02.001.
- Obaje NG. 2009. Geology and mineral resources of Nigeria. Heidelberge (Berlin): Springer-Verlag; p. 221. doi:https://doi.org/10.1007/978-3-540-92685-6.
- Ogunyele AC, Oluwajana OA, Ehinola IQ, Ameh BE, Salaudeen TA. 2019. Petrochemistry and petrogenesis of the Precambrian Basement Complex rocks around Akungba-Akoko, southwestern Nigeria. Mat Geoenviron. 66(3):173–184. doi:https://doi.org/10.2478/rmzmag-2019-0036.
- Osazuwa IB, Chii EC. 2009. A two-dimensional electrical resistivity imaging of an earth dam, Zaria, Nigeria. J Environ Hydrol. 17(28):1–8.
- Robineau B, Join JL, Beauvais A, Parisot JC, Savin C. 2007. Geoelectrical imaging of a thick regolith developed on ultramafic rocks: groundwater influence. Austra J Earth Sci. 54(5):773–781.
- Uhlemann S, Kuras O, Richards LA, Naden E, Polya DA. 2017. Electrical resistivity tomography determines the spatial distribution of clay layer thickness and aquifer vulnerability, Kandal Province, Cambodia. J Asian Earth Sci. 147:402–414. doi:https://doi.org/10.1016/j.jseaes.2017.07.043.
- Wisén R, Christiansen A, Dahlin T, Auken E. 2008. Experience from two resistivity inversion techniques applied in three cases of geotechnical site investigation. J Geotech Geoenviron Eng. 134:1730–1742. doi:https://doi.org/10.1061/(ASCE)1090-0241(2008)134:12(1730).
- Woakes M, Rahaman MA, Ajibade AC. 1987. Some metallogenetic features of the Nigerian Basement. J Afr Earth Sci. 6(5):655–664. doi:https://doi.org/10.1016/0899-5362(87)90004-2.